
An official website of the United States government
An official website of the United States government
The .gov means it's official.
Federal government websites often end in .gov or .mil. Before sharing sensitive information,
make sure you're on a federal government site.
The site is secure.
The
https:// ensures that you are connecting to the official website and that any
information you provide is encrypted and transmitted securely.
Conduct research, prepare reports, or formulate plans to address economic problems related to the production and distribution of goods and services or monetary and fiscal policy. May collect and process economic and statistical data using sampling techniques and econometric methods. Excludes "Market Research Analysts and Marketing Specialists" (13-1161).
Employment estimate and mean wage estimates for Economists:
| Employment (1) | Employment RSE (3) |
Mean hourly wage |
Mean annual wage (2) |
Wage RSE (3) |
|---|---|---|---|---|
| 17,520 | 3.3 % | $ 58.11 | $ 120,880 | 1.5 % |
Percentile wage estimates for Economists:
| Percentile | 10% | 25% | 50% (Median) |
75% | 90% |
|---|---|---|---|---|---|
| Hourly Wage | $ 28.47 | $ 38.39 | $ 52.09 | $ 72.70 | $ 95.30 |
| Annual Wage (2) | $ 59,220 | $ 79,860 | $ 108,350 | $ 151,210 | $ 198,230 |
Industries with the highest published employment and wages for Economists are provided. For a list of all industries with employment in Economists, see the Create Customized Tables function.
Industries with the highest levels of employment in Economists:
| Industry | Employment (1) | Percent of industry employment | Hourly mean wage | Annual mean wage (2) |
|---|---|---|---|---|
| Federal Executive Branch (OEWS Designation) | 4,230 | 0.20 | $ 61.85 | $ 128,640 |
| Management, Scientific, and Technical Consulting Services | 3,220 | 0.21 | $ 65.45 | $ 136,140 |
| Scientific Research and Development Services | 2,640 | 0.35 | $ 63.71 | $ 132,510 |
| State Government, excluding schools and hospitals (OEWS Designation) | 1,880 | 0.09 | $ 36.33 | $ 75,560 |
| Local Government, excluding schools and hospitals (OEWS Designation) | 1,340 | 0.02 | $ 41.90 | $ 87,150 |
Industries with the highest concentration of employment in Economists:
| Industry | Employment (1) | Percent of industry employment | Hourly mean wage | Annual mean wage (2) |
|---|---|---|---|---|
| Monetary Authorities-Central Bank | 350 | 1.77 | $ 75.37 | $ 156,770 |
| Scientific Research and Development Services | 2,640 | 0.35 | $ 63.71 | $ 132,510 |
| Management, Scientific, and Technical Consulting Services | 3,220 | 0.21 | $ 65.45 | $ 136,140 |
| Federal Executive Branch (OEWS Designation) | 4,230 | 0.20 | $ 61.85 | $ 128,640 |
| Business, Professional, Labor, Political, and Similar Organizations | 600 | 0.14 | $ 57.91 | $ 120,450 |
Top paying industries for Economists:
| Industry | Employment (1) | Percent of industry employment | Hourly mean wage | Annual mean wage (2) |
|---|---|---|---|---|
| Legal Services | (8) | (8) | $ 104.31 | $ 216,960 |
| Monetary Authorities-Central Bank | 350 | 1.77 | $ 75.37 | $ 156,770 |
| Other Professional, Scientific, and Technical Services | 220 | 0.03 | $ 68.88 | $ 143,270 |
| Management, Scientific, and Technical Consulting Services | 3,220 | 0.21 | $ 65.45 | $ 136,140 |
| Scientific Research and Development Services | 2,640 | 0.35 | $ 63.71 | $ 132,510 |
States and areas with the highest published employment, location quotients, and wages for Economists are provided. For a list of all areas with employment in Economists, see the Create Customized Tables function.
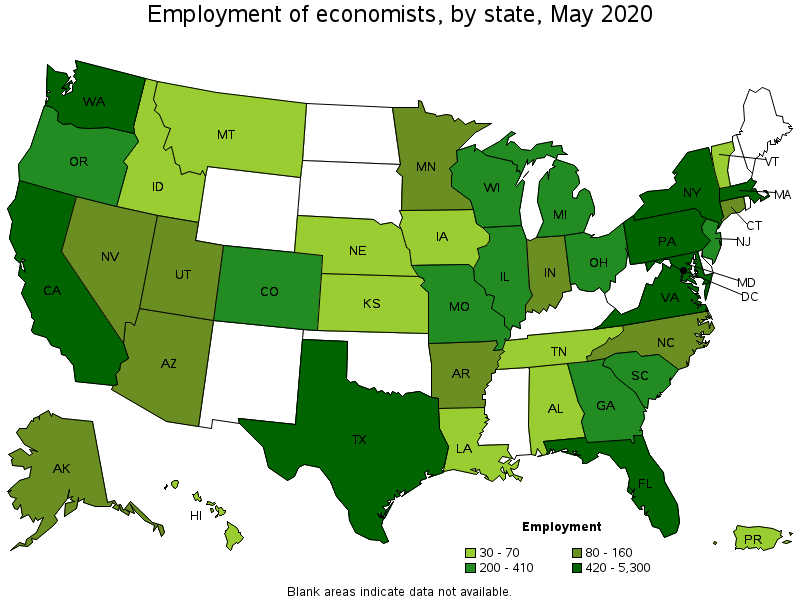
States with the highest employment level in Economists:
| State | Employment (1) | Employment per thousand jobs | Location quotient (9) | Hourly mean wage | Annual mean wage (2) |
|---|---|---|---|---|---|
| District of Columbia | 5,300 | 7.71 | 61.19 | $ 69.29 | $ 144,110 |
| California | 2,020 | 0.12 | 0.98 | $ 63.22 | $ 131,500 |
| Virginia | 980 | 0.27 | 2.11 | (8) | (8) |
| New York | 850 | 0.10 | 0.78 | $ 72.19 | $ 150,160 |
| Maryland | 800 | 0.32 | 2.52 | $ 61.04 | $ 126,960 |
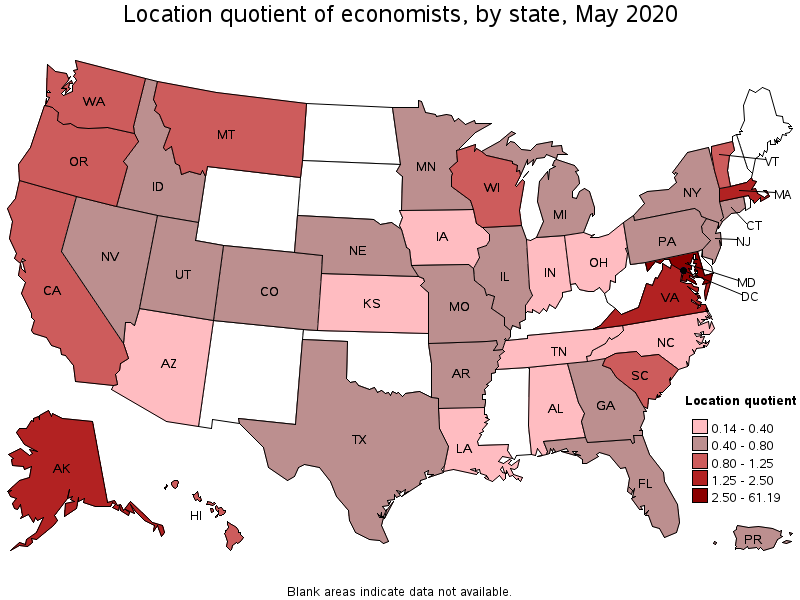
States with the highest concentration of jobs and location quotients in Economists:
| State | Employment (1) | Employment per thousand jobs | Location quotient (9) | Hourly mean wage | Annual mean wage (2) |
|---|---|---|---|---|---|
| District of Columbia | 5,300 | 7.71 | 61.19 | $ 69.29 | $ 144,110 |
| Maryland | 800 | 0.32 | 2.52 | $ 61.04 | $ 126,960 |
| Alaska | 80 | 0.27 | 2.11 | $ 44.99 | $ 93,570 |
| Virginia | 980 | 0.27 | 2.11 | (8) | (8) |
| Massachusetts | 610 | 0.18 | 1.44 | $ 53.63 | $ 111,550 |
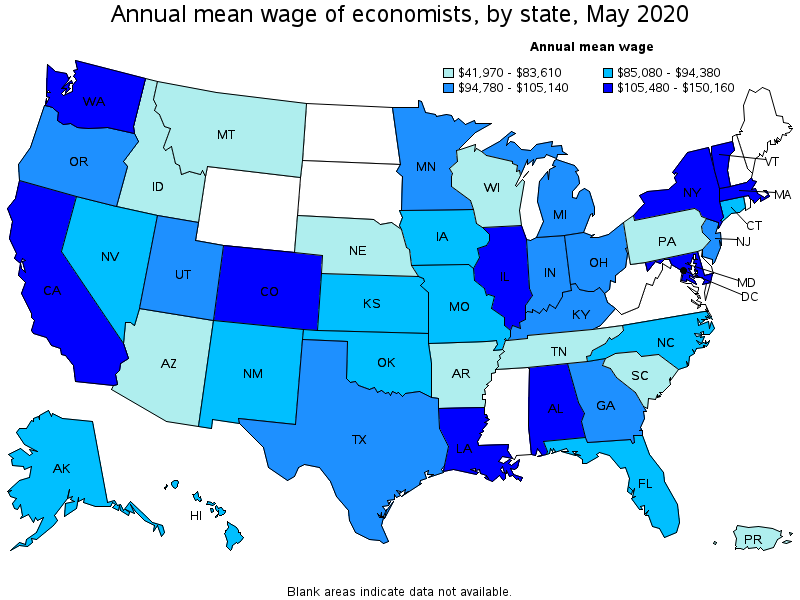
Top paying states for Economists:
| State | Employment (1) | Employment per thousand jobs | Location quotient (9) | Hourly mean wage | Annual mean wage (2) |
|---|---|---|---|---|---|
| New York | 850 | 0.10 | 0.78 | $ 72.19 | $ 150,160 |
| District of Columbia | 5,300 | 7.71 | 61.19 | $ 69.29 | $ 144,110 |
| California | 2,020 | 0.12 | 0.98 | $ 63.22 | $ 131,500 |
| Maryland | 800 | 0.32 | 2.52 | $ 61.04 | $ 126,960 |
| Vermont | 40 | 0.14 | 1.13 | $ 56.84 | $ 118,230 |
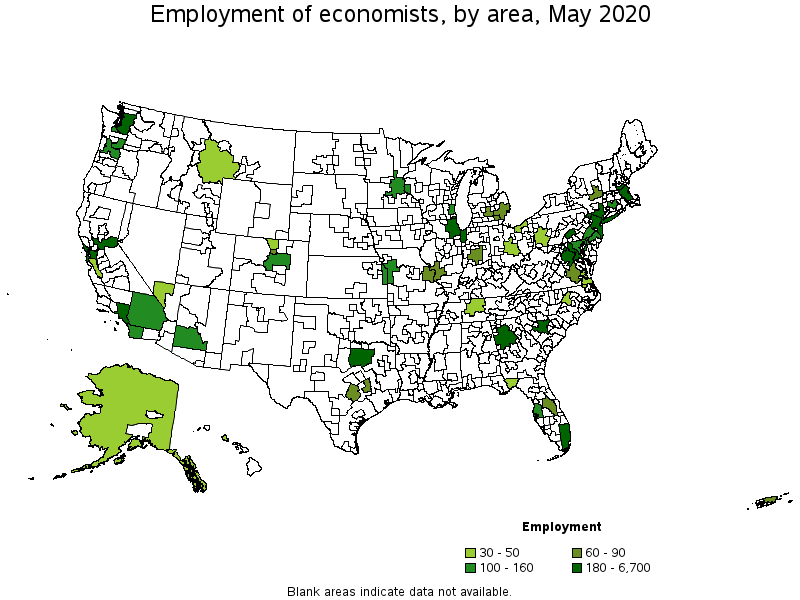
Metropolitan areas with the highest employment level in Economists:
| Metropolitan area | Employment (1) | Employment per thousand jobs | Location quotient (9) | Hourly mean wage | Annual mean wage (2) |
|---|---|---|---|---|---|
| Washington-Arlington-Alexandria, DC-VA-MD-WV | 6,700 | 2.22 | 17.61 | $ 68.55 | $ 142,580 |
| San Francisco-Oakland-Hayward, CA | 900 | 0.39 | 3.06 | $ 71.63 | $ 148,980 |
| New York-Newark-Jersey City, NY-NJ-PA | 820 | 0.09 | 0.73 | $ 73.85 | $ 153,610 |
| Boston-Cambridge-Nashua, MA-NH | 560 | 0.22 | 1.71 | $ 52.39 | $ 108,970 |
| Los Angeles-Long Beach-Anaheim, CA | 490 | 0.08 | 0.67 | $ 63.67 | $ 132,430 |
| Chicago-Naperville-Elgin, IL-IN-WI | 370 | 0.08 | 0.67 | $ 56.12 | $ 116,730 |
| Atlanta-Sandy Springs-Roswell, GA | 280 | 0.11 | 0.85 | $ 50.34 | $ 104,700 |
| Sacramento--Roseville--Arden-Arcade, CA | 270 | 0.27 | 2.17 | $ 42.25 | $ 87,880 |
| Seattle-Tacoma-Bellevue, WA | 230 | 0.12 | 0.94 | $ 59.42 | $ 123,600 |
| Miami-Fort Lauderdale-West Palm Beach, FL | 200 | 0.08 | 0.65 | (8) | (8) |
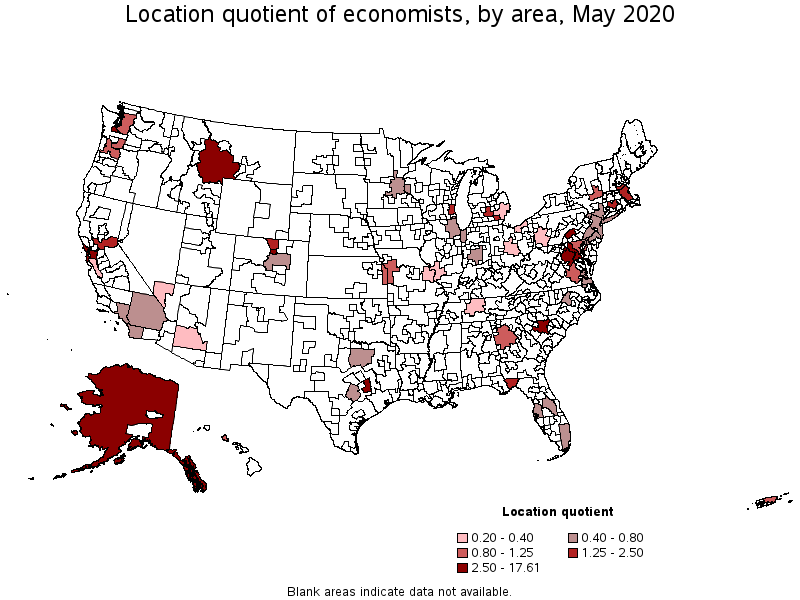
Metropolitan areas with the highest concentration of jobs and location quotients in Economists:
| Metropolitan area | Employment (1) | Employment per thousand jobs | Location quotient (9) | Hourly mean wage | Annual mean wage (2) |
|---|---|---|---|---|---|
| Washington-Arlington-Alexandria, DC-VA-MD-WV | 6,700 | 2.22 | 17.61 | $ 68.55 | $ 142,580 |
| Olympia-Tumwater, WA | 150 | 1.34 | 10.66 | $ 43.30 | $ 90,060 |
| Harrisburg-Carlisle, PA | 180 | 0.59 | 4.70 | $ 33.75 | $ 70,190 |
| College Station-Bryan, TX | 60 | 0.57 | 4.51 | $ 29.54 | $ 61,450 |
| Columbia, SC | 190 | 0.50 | 3.97 | $ 28.70 | $ 59,700 |
| Boulder, CO | 70 | 0.41 | 3.27 | $ 55.44 | $ 115,320 |
| San Francisco-Oakland-Hayward, CA | 900 | 0.39 | 3.06 | $ 71.63 | $ 148,980 |
| Ann Arbor, MI | 60 | 0.30 | 2.35 | $ 52.55 | $ 109,310 |
| Tallahassee, FL | 50 | 0.29 | 2.27 | $ 40.31 | $ 83,840 |
| Lansing-East Lansing, MI | 60 | 0.29 | 2.27 | $ 44.80 | $ 93,180 |
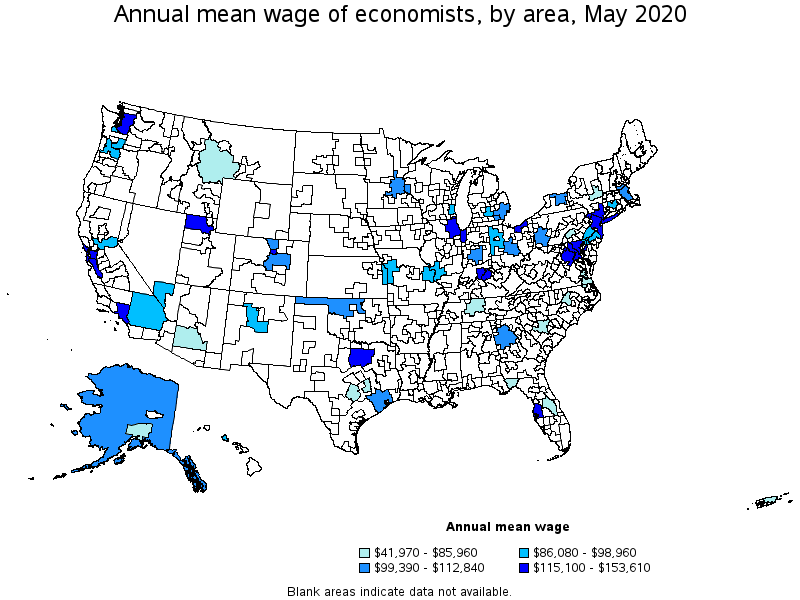
Top paying metropolitan areas for Economists:
| Metropolitan area | Employment (1) | Employment per thousand jobs | Location quotient (9) | Hourly mean wage | Annual mean wage (2) |
|---|---|---|---|---|---|
| New York-Newark-Jersey City, NY-NJ-PA | 820 | 0.09 | 0.73 | $ 73.85 | $ 153,610 |
| San Francisco-Oakland-Hayward, CA | 900 | 0.39 | 3.06 | $ 71.63 | $ 148,980 |
| Washington-Arlington-Alexandria, DC-VA-MD-WV | 6,700 | 2.22 | 17.61 | $ 68.55 | $ 142,580 |
| Baltimore-Columbia-Towson, MD | 160 | 0.12 | 0.96 | $ 65.96 | $ 137,200 |
| Los Angeles-Long Beach-Anaheim, CA | 490 | 0.08 | 0.67 | $ 63.67 | $ 132,430 |
| Cleveland-Elyria, OH | 30 | 0.03 | 0.27 | $ 62.59 | $ 130,190 |
| Tampa-St. Petersburg-Clearwater, FL | 100 | 0.07 | 0.58 | $ 60.87 | $ 126,600 |
| Seattle-Tacoma-Bellevue, WA | 230 | 0.12 | 0.94 | $ 59.42 | $ 123,600 |
| San Jose-Sunnyvale-Santa Clara, CA | 50 | 0.05 | 0.38 | $ 58.49 | $ 121,650 |
| Ogden-Clearfield, UT | (8) | (8) | (8) | $ 57.39 | $ 119,370 |
Nonmetropolitan areas with the highest employment in Economists:
| Nonmetropolitan area | Employment (1) | Employment per thousand jobs | Location quotient (9) | Hourly mean wage | Annual mean wage (2) |
|---|---|---|---|---|---|
| Southwest Montana nonmetropolitan area | 40 | 0.32 | 2.56 | $ 37.17 | $ 77,320 |
| Alaska nonmetropolitan area | 40 | 0.43 | 3.39 | $ 50.61 | $ 105,280 |
Nonmetropolitan areas with the highest concentration of jobs and location quotients in Economists:
| Nonmetropolitan area | Employment (1) | Employment per thousand jobs | Location quotient (9) | Hourly mean wage | Annual mean wage (2) |
|---|---|---|---|---|---|
| Alaska nonmetropolitan area | 40 | 0.43 | 3.39 | $ 50.61 | $ 105,280 |
| Southwest Montana nonmetropolitan area | 40 | 0.32 | 2.56 | $ 37.17 | $ 77,320 |
Top paying nonmetropolitan areas for Economists:
| Nonmetropolitan area | Employment (1) | Employment per thousand jobs | Location quotient (9) | Hourly mean wage | Annual mean wage (2) |
|---|---|---|---|---|---|
| Alaska nonmetropolitan area | 40 | 0.43 | 3.39 | $ 50.61 | $ 105,280 |
| Northwest Oklahoma nonmetropolitan area | (8) | (8) | (8) | $ 47.78 | $ 99,390 |
| West Northwestern Ohio nonmetropolitan area | (8) | (8) | (8) | $ 44.71 | $ 93,000 |
| Southwest Montana nonmetropolitan area | 40 | 0.32 | 2.56 | $ 37.17 | $ 77,320 |
These estimates are calculated with data collected from employers in all industry sectors, all metropolitan and nonmetropolitan areas, and all states and the District of Columbia. The top employment and wage figures are provided above. The complete list is available in the downloadable XLS files.
The percentile wage estimate is the value of a wage below which a certain percent of workers fall. The median wage is the 50th percentile wage estimate—50 percent of workers earn less than the median and 50 percent of workers earn more than the median. More about percentile wages.
(1) Estimates for detailed occupations do not sum to the totals because the totals include occupations not shown separately. Estimates do not include self-employed workers.
(2) Annual wages have been calculated by multiplying the hourly mean wage by a "year-round, full-time" hours figure of 2,080 hours; for those occupations where there is not an hourly wage published, the annual wage has been directly calculated from the reported survey data.
(3) The relative standard error (RSE) is a measure of the reliability of a survey statistic. The smaller the relative standard error, the more precise the estimate.
(8) Estimate not released.
(9) The location quotient is the ratio of the area concentration of occupational employment to the national average concentration. A location quotient greater than one indicates the occupation has a higher share of employment than average, and a location quotient less than one indicates the occupation is less prevalent in the area than average.
Other OEWS estimates and related information:
May 2020 National Occupational Employment and Wage Estimates
May 2020 State Occupational Employment and Wage Estimates
May 2020 Metropolitan and Nonmetropolitan Area Occupational Employment and Wage Estimates
May 2020 National Industry-Specific Occupational Employment and Wage Estimates
Last Modified Date: March 31, 2021