
An official website of the United States government
An official website of the United States government
The .gov means it's official.
Federal government websites often end in .gov or .mil. Before sharing sensitive information,
make sure you're on a federal government site.
The site is secure.
The
https:// ensures that you are connecting to the official website and that any
information you provide is encrypted and transmitted securely.
Advise and assist students and provide educational and vocational guidance services.
Employment estimate and mean wage estimates for Educational, Guidance, and Career Counselors and Advisors:
| Employment (1) | Employment RSE (3) |
Mean hourly wage |
Mean annual wage (2) |
Wage RSE (3) |
|---|---|---|---|---|
| 292,230 | 0.8 % | $ 29.96 | $ 62,320 | 0.5 % |
Percentile wage estimates for Educational, Guidance, and Career Counselors and Advisors:
| Percentile | 10% | 25% | 50% (Median) |
75% | 90% |
|---|---|---|---|---|---|
| Hourly Wage | $ 17.12 | $ 21.67 | $ 27.94 | $ 36.50 | $ 47.07 |
| Annual Wage (2) | $ 35,620 | $ 45,080 | $ 58,120 | $ 75,920 | $ 97,910 |
Industries with the highest published employment and wages for Educational, Guidance, and Career Counselors and Advisors are provided. For a list of all industries with employment in Educational, Guidance, and Career Counselors and Advisors, see the Create Customized Tables function.
Industries with the highest levels of employment in Educational, Guidance, and Career Counselors and Advisors:
| Industry | Employment (1) | Percent of industry employment | Hourly mean wage | Annual mean wage (2) |
|---|---|---|---|---|
| Elementary and Secondary Schools | 144,850 | 1.76 | $ 33.06 | $ 68,770 |
| Colleges, Universities, and Professional Schools | 70,400 | 2.32 | $ 26.47 | $ 55,060 |
| Junior Colleges | 23,870 | 3.50 | $ 30.50 | $ 63,440 |
| Educational Support Services | 9,420 | 5.09 | $ 28.23 | $ 58,710 |
| Vocational Rehabilitation Services | 8,600 | 2.99 | $ 21.81 | $ 45,350 |
Industries with the highest concentration of employment in Educational, Guidance, and Career Counselors and Advisors:
| Industry | Employment (1) | Percent of industry employment | Hourly mean wage | Annual mean wage (2) |
|---|---|---|---|---|
| Educational Support Services | 9,420 | 5.09 | $ 28.23 | $ 58,710 |
| Junior Colleges | 23,870 | 3.50 | $ 30.50 | $ 63,440 |
| Vocational Rehabilitation Services | 8,600 | 2.99 | $ 21.81 | $ 45,350 |
| Technical and Trade Schools | 3,250 | 2.59 | $ 25.70 | $ 53,460 |
| Colleges, Universities, and Professional Schools | 70,400 | 2.32 | $ 26.47 | $ 55,060 |
Top paying industries for Educational, Guidance, and Career Counselors and Advisors:
| Industry | Employment (1) | Percent of industry employment | Hourly mean wage | Annual mean wage (2) |
|---|---|---|---|---|
| Federal Executive Branch (OEWS Designation) | 770 | 0.04 | $ 36.17 | $ 75,230 |
| Computer Systems Design and Related Services | 70 | (7) | $ 34.20 | $ 71,140 |
| Elementary and Secondary Schools | 144,850 | 1.76 | $ 33.06 | $ 68,770 |
| Insurance Carriers | 60 | 0.01 | $ 31.09 | $ 64,660 |
| Scientific Research and Development Services | 1,100 | 0.15 | $ 31.03 | $ 64,540 |
States and areas with the highest published employment, location quotients, and wages for Educational, Guidance, and Career Counselors and Advisors are provided. For a list of all areas with employment in Educational, Guidance, and Career Counselors and Advisors, see the Create Customized Tables function.
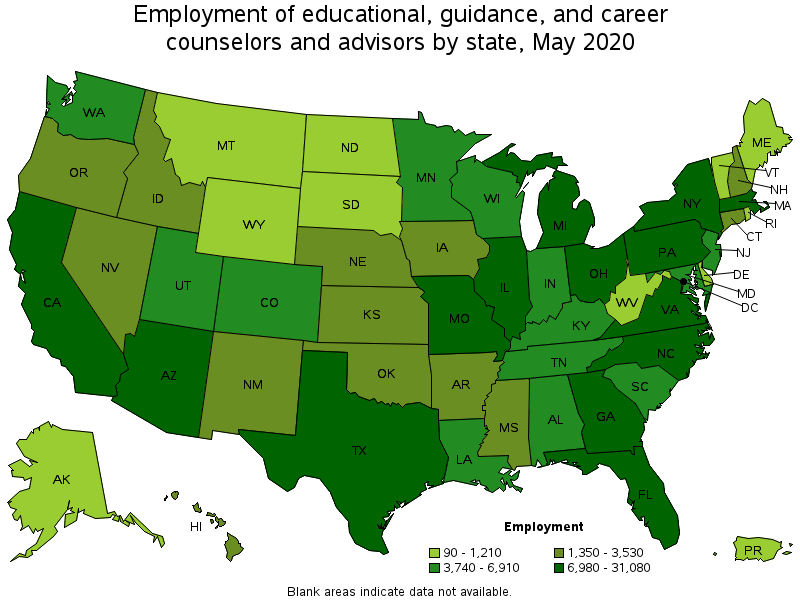
States with the highest employment level in Educational, Guidance, and Career Counselors and Advisors:
| State | Employment (1) | Employment per thousand jobs | Location quotient (9) | Hourly mean wage | Annual mean wage (2) |
|---|---|---|---|---|---|
| California | 31,080 | 1.89 | 0.90 | $ 39.11 | $ 81,350 |
| Texas | 25,960 | 2.15 | 1.02 | $ 28.78 | $ 59,860 |
| New York | 25,560 | 2.94 | 1.40 | $ 33.54 | $ 69,760 |
| Florida | 18,590 | 2.20 | 1.05 | $ 25.37 | $ 52,770 |
| Illinois | 13,660 | 2.43 | 1.16 | $ 27.85 | $ 57,920 |
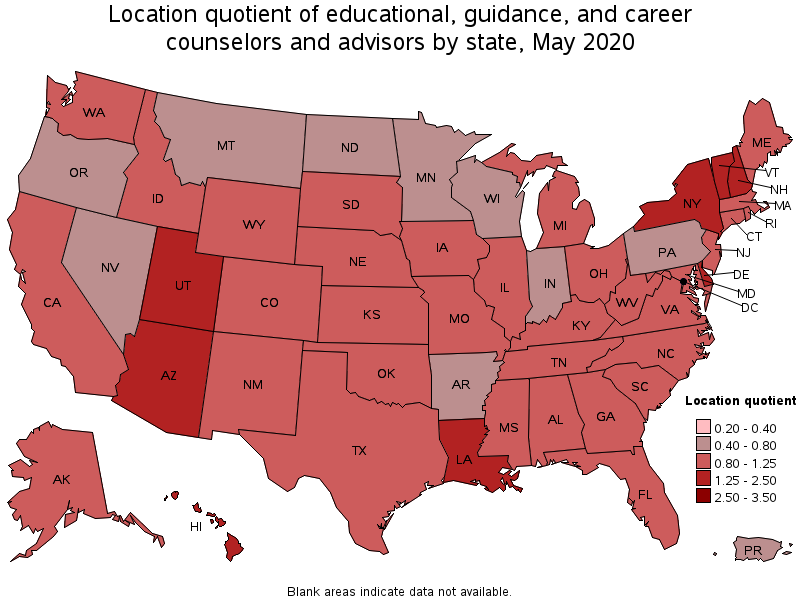
States with the highest concentration of jobs and location quotients in Educational, Guidance, and Career Counselors and Advisors:
| State | Employment (1) | Employment per thousand jobs | Location quotient (9) | Hourly mean wage | Annual mean wage (2) |
|---|---|---|---|---|---|
| Vermont | 960 | 3.41 | 1.62 | $ 27.22 | $ 56,610 |
| Louisiana | 6,080 | 3.38 | 1.61 | $ 26.95 | $ 56,050 |
| New Hampshire | 2,050 | 3.31 | 1.58 | $ 27.06 | $ 56,290 |
| Hawaii | 1,710 | 2.99 | 1.42 | $ 29.91 | $ 62,220 |
| Arizona | 8,460 | 2.99 | 1.42 | $ 25.09 | $ 52,190 |
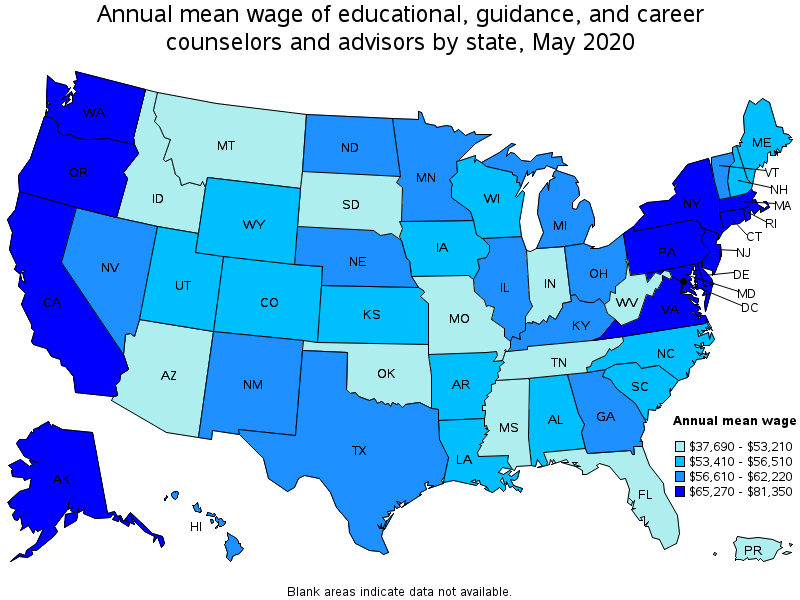
Top paying states for Educational, Guidance, and Career Counselors and Advisors:
| State | Employment (1) | Employment per thousand jobs | Location quotient (9) | Hourly mean wage | Annual mean wage (2) |
|---|---|---|---|---|---|
| California | 31,080 | 1.89 | 0.90 | $ 39.11 | $ 81,350 |
| New Jersey | 6,910 | 1.83 | 0.87 | $ 36.07 | $ 75,030 |
| Virginia | 6,980 | 1.89 | 0.90 | $ 35.38 | $ 73,590 |
| Massachusetts | 7,950 | 2.37 | 1.13 | $ 34.99 | $ 72,780 |
| Maryland | 5,580 | 2.21 | 1.05 | $ 34.96 | $ 72,720 |
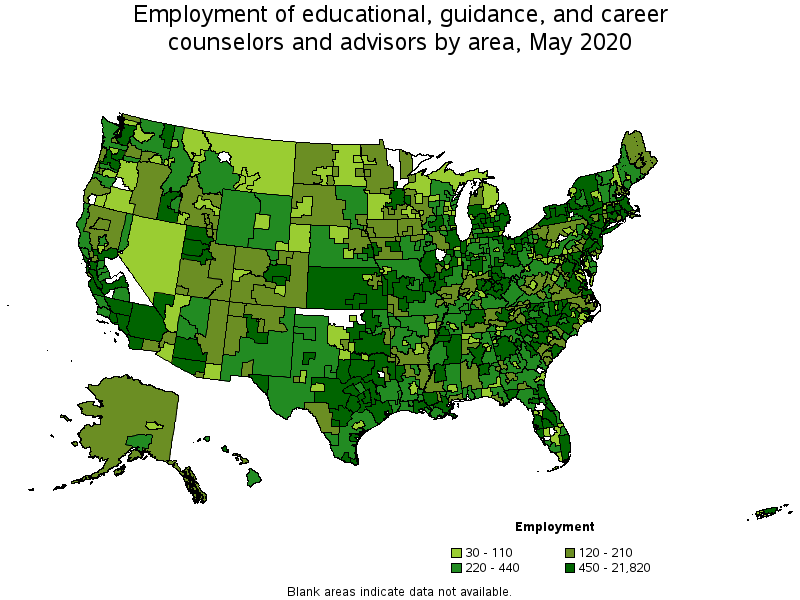
Metropolitan areas with the highest employment level in Educational, Guidance, and Career Counselors and Advisors:
| Metropolitan area | Employment (1) | Employment per thousand jobs | Location quotient (9) | Hourly mean wage | Annual mean wage (2) |
|---|---|---|---|---|---|
| New York-Newark-Jersey City, NY-NJ-PA | 21,820 | 2.47 | 1.18 | $ 35.90 | $ 74,670 |
| Los Angeles-Long Beach-Anaheim, CA | 12,000 | 2.06 | 0.98 | $ 40.00 | $ 83,210 |
| Chicago-Naperville-Elgin, IL-IN-WI | 10,020 | 2.30 | 1.09 | $ 29.35 | $ 61,060 |
| Washington-Arlington-Alexandria, DC-VA-MD-WV | 6,590 | 2.18 | 1.04 | $ 39.78 | $ 82,750 |
| Phoenix-Mesa-Scottsdale, AZ | 6,440 | 3.06 | 1.45 | $ 25.67 | $ 53,400 |
| Dallas-Fort Worth-Arlington, TX | 6,330 | 1.76 | 0.84 | $ 29.77 | $ 61,920 |
| Miami-Fort Lauderdale-West Palm Beach, FL | 6,260 | 2.49 | 1.19 | $ 26.49 | $ 55,110 |
| Boston-Cambridge-Nashua, MA-NH | 6,050 | 2.33 | 1.11 | $ 34.67 | $ 72,110 |
| Houston-The Woodlands-Sugar Land, TX | 5,920 | 1.99 | 0.95 | $ 30.18 | $ 62,770 |
| Atlanta-Sandy Springs-Roswell, GA | 5,110 | 1.94 | 0.92 | $ 29.64 | $ 61,650 |
Metropolitan areas with the highest concentration of jobs and location quotients in Educational, Guidance, and Career Counselors and Advisors:
| Metropolitan area | Employment (1) | Employment per thousand jobs | Location quotient (9) | Hourly mean wage | Annual mean wage (2) |
|---|---|---|---|---|---|
| Prescott, AZ | 410 | 6.66 | 3.17 | $ 23.99 | $ 49,900 |
| Athens-Clarke County, GA | 520 | 6.13 | 2.92 | $ 23.27 | $ 48,410 |
| College Station-Bryan, TX | 640 | 5.94 | 2.83 | $ 23.41 | $ 48,700 |
| Columbia, MO | 520 | 5.85 | 2.79 | (8) | (8) |
| Champaign-Urbana, IL | 530 | 5.50 | 2.62 | $ 24.70 | $ 51,370 |
| Lafayette-West Lafayette, IN | 490 | 5.50 | 2.62 | $ 24.91 | $ 51,810 |
| Corvallis, OR | 190 | 5.38 | 2.56 | $ 26.66 | $ 55,460 |
| Auburn-Opelika, AL | 290 | 5.09 | 2.42 | $ 26.96 | $ 56,080 |
| Provo-Orem, UT | 1,160 | 4.57 | 2.18 | $ 27.39 | $ 56,970 |
| Flagstaff, AZ | 240 | 4.27 | 2.03 | $ 23.15 | $ 48,160 |
Top paying metropolitan areas for Educational, Guidance, and Career Counselors and Advisors:
| Metropolitan area | Employment (1) | Employment per thousand jobs | Location quotient (9) | Hourly mean wage | Annual mean wage (2) |
|---|---|---|---|---|---|
| Riverside-San Bernardino-Ontario, CA | 2,750 | 1.85 | 0.88 | $ 43.95 | $ 91,420 |
| El Centro, CA | 130 | 2.24 | 1.07 | $ 43.80 | $ 91,110 |
| Fresno, CA | 1,030 | 2.73 | 1.30 | $ 43.68 | $ 90,860 |
| Stockton-Lodi, CA | 370 | 1.49 | 0.71 | $ 41.83 | $ 87,020 |
| Napa, CA | 170 | 2.41 | 1.15 | $ 41.78 | $ 86,900 |
| San Jose-Sunnyvale-Santa Clara, CA | 1,560 | 1.41 | 0.67 | $ 41.73 | $ 86,790 |
| Yuba City, CA | 90 | 2.14 | 1.02 | $ 41.54 | $ 86,410 |
| Bakersfield, CA | 510 | 1.68 | 0.80 | $ 40.31 | $ 83,840 |
| Los Angeles-Long Beach-Anaheim, CA | 12,000 | 2.06 | 0.98 | $ 40.00 | $ 83,210 |
| Santa Cruz-Watsonville, CA | 130 | 1.47 | 0.70 | $ 39.83 | $ 82,850 |
Nonmetropolitan areas with the highest employment in Educational, Guidance, and Career Counselors and Advisors:
| Nonmetropolitan area | Employment (1) | Employment per thousand jobs | Location quotient (9) | Hourly mean wage | Annual mean wage (2) |
|---|---|---|---|---|---|
| Kansas nonmetropolitan area | 970 | 2.56 | 1.22 | $ 23.96 | $ 49,840 |
| North Northeastern Ohio nonmetropolitan area (noncontiguous) | 880 | 2.81 | 1.34 | $ 24.47 | $ 50,900 |
| Central East New York nonmetropolitan area | 690 | 4.56 | 2.17 | $ 26.80 | $ 55,750 |
| North Texas Region of Texas nonmetropolitan area | 610 | 2.26 | 1.07 | $ 25.68 | $ 53,420 |
| Piedmont North Carolina nonmetropolitan area | 540 | 2.21 | 1.05 | $ 24.13 | $ 50,190 |
Nonmetropolitan areas with the highest concentration of jobs and location quotients in Educational, Guidance, and Career Counselors and Advisors:
| Nonmetropolitan area | Employment (1) | Employment per thousand jobs | Location quotient (9) | Hourly mean wage | Annual mean wage (2) |
|---|---|---|---|---|---|
| Connecticut nonmetropolitan area | 180 | 5.84 | 2.78 | $ 32.10 | $ 66,760 |
| East Georgia nonmetropolitan area | 430 | 5.07 | 2.42 | $ 22.07 | $ 45,900 |
| Southwest Louisiana nonmetropolitan area | 330 | 4.80 | 2.28 | $ 26.94 | $ 56,030 |
| Northern Vermont nonmetropolitan area | 310 | 4.75 | 2.26 | $ 27.03 | $ 56,220 |
| Central East New York nonmetropolitan area | 690 | 4.56 | 2.17 | $ 26.80 | $ 55,750 |
Top paying nonmetropolitan areas for Educational, Guidance, and Career Counselors and Advisors:
| Nonmetropolitan area | Employment (1) | Employment per thousand jobs | Location quotient (9) | Hourly mean wage | Annual mean wage (2) |
|---|---|---|---|---|---|
| Eastern Sierra-Mother Lode Region of California nonmetropolitan area | (8) | (8) | (8) | $ 41.09 | $ 85,460 |
| Massachusetts nonmetropolitan area | 210 | 3.69 | 1.76 | $ 35.33 | $ 73,480 |
| Western Washington nonmetropolitan area | 230 | 1.96 | 0.93 | $ 34.42 | $ 71,600 |
| Border Region of Texas nonmetropolitan area | 170 | 3.02 | 1.44 | $ 34.34 | $ 71,430 |
| Nevada nonmetropolitan area | 110 | 1.22 | 0.58 | $ 33.91 | $ 70,530 |
These estimates are calculated with data collected from employers in all industry sectors, all metropolitan and nonmetropolitan areas, and all states and the District of Columbia. The top employment and wage figures are provided above. The complete list is available in the downloadable XLS files.
The percentile wage estimate is the value of a wage below which a certain percent of workers fall. The median wage is the 50th percentile wage estimate—50 percent of workers earn less than the median and 50 percent of workers earn more than the median. More about percentile wages.
(1) Estimates for detailed occupations do not sum to the totals because the totals include occupations not shown separately. Estimates do not include self-employed workers.
(2) Annual wages have been calculated by multiplying the hourly mean wage by a "year-round, full-time" hours figure of 2,080 hours; for those occupations where there is not an hourly wage published, the annual wage has been directly calculated from the reported survey data.
(3) The relative standard error (RSE) is a measure of the reliability of a survey statistic. The smaller the relative standard error, the more precise the estimate.
(7) The value is less than .005 percent of industry employment.
(8) Estimate not released.
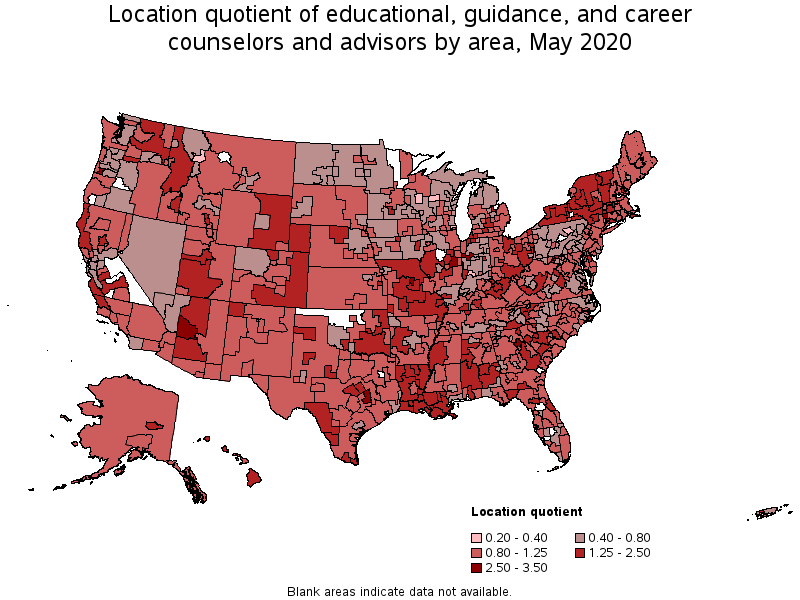
(9) The location quotient is the ratio of the area concentration of occupational employment to the national average concentration. A location quotient greater than one indicates the occupation has a higher share of employment than average, and a location quotient less than one indicates the occupation is less prevalent in the area than average.
Other OEWS estimates and related information:
May 2020 National Occupational Employment and Wage Estimates
May 2020 State Occupational Employment and Wage Estimates
May 2020 Metropolitan and Nonmetropolitan Area Occupational Employment and Wage Estimates
May 2020 National Industry-Specific Occupational Employment and Wage Estimates
Last Modified Date: March 31, 2021