
An official website of the United States government
An official website of the United States government
The .gov means it's official.
Federal government websites often end in .gov or .mil. Before sharing sensitive information,
make sure you're on a federal government site.
The site is secure.
The
https:// ensures that you are connecting to the official website and that any
information you provide is encrypted and transmitted securely.
Teach students on a short-term basis as a temporary replacement for a regular classroom teacher, typically using the regular teacher's lesson plan. Excludes long-term substitute teachers who perform all the duties of a regular teacher; these teachers are coded within the 25-1000 or 25-2000 minor groups.
Employment estimate and mean wage estimates for Substitute Teachers, Short-Term:
| Employment (1) | Employment RSE (3) |
Mean hourly wage |
Mean annual wage (2) |
Wage RSE (3) |
|---|---|---|---|---|
| 512,030 | 2.0 % | $ 17.35 | $ 36,090 | 3.6 % |
Percentile wage estimates for Substitute Teachers, Short-Term:
| Percentile | 10% | 25% | 50% (Median) |
75% | 90% |
|---|---|---|---|---|---|
| Hourly Wage | $ 9.16 | $ 11.25 | $ 14.12 | $ 18.35 | $ 24.93 |
| Annual Wage (2) | $ 19,060 | $ 23,390 | $ 29,370 | $ 38,160 | $ 51,850 |
Industries with the highest published employment and wages for Substitute Teachers, Short-Term are provided. For a list of all industries with employment in Substitute Teachers, Short-Term, see the Create Customized Tables function.
Industries with the highest levels of employment in Substitute Teachers, Short-Term:
| Industry | Employment (1) | Percent of industry employment | Hourly mean wage | Annual mean wage (2) |
|---|---|---|---|---|
| Elementary and Secondary Schools | 450,550 | 5.47 | $ 17.59 | $ 36,590 |
| Employment Services | 38,510 | 1.20 | $ 15.13 | $ 31,470 |
| Local Government, excluding schools and hospitals (OEWS Designation) | 6,840 | 0.13 | $ 17.71 | $ 36,830 |
| Child Day Care Services | 6,760 | 0.85 | $ 14.97 | $ 31,140 |
| Educational Support Services | 3,110 | 1.68 | $ 13.67 | $ 28,440 |
Industries with the highest concentration of employment in Substitute Teachers, Short-Term:
| Industry | Employment (1) | Percent of industry employment | Hourly mean wage | Annual mean wage (2) |
|---|---|---|---|---|
| Elementary and Secondary Schools | 450,550 | 5.47 | $ 17.59 | $ 36,590 |
| Educational Support Services | 3,110 | 1.68 | $ 13.67 | $ 28,440 |
| Employment Services | 38,510 | 1.20 | $ 15.13 | $ 31,470 |
| Child Day Care Services | 6,760 | 0.85 | $ 14.97 | $ 31,140 |
| Technical and Trade Schools | 300 | 0.24 | $ 20.97 | $ 43,630 |
Top paying industries for Substitute Teachers, Short-Term:
| Industry | Employment (1) | Percent of industry employment | Hourly mean wage | Annual mean wage (2) |
|---|---|---|---|---|
| Business Schools and Computer and Management Training | 100 | 0.14 | $ 23.13 | $ 48,120 |
| Technical and Trade Schools | 300 | 0.24 | $ 20.97 | $ 43,630 |
| Colleges, Universities, and Professional Schools | 780 | 0.03 | $ 20.06 | $ 41,730 |
| Junior Colleges | 930 | 0.14 | $ 19.45 | $ 40,460 |
| Residential Intellectual and Developmental Disability, Mental Health, and Substance Abuse Facilities | 50 | 0.01 | $ 19.07 | $ 39,670 |
States and areas with the highest published employment, location quotients, and wages for Substitute Teachers, Short-Term are provided. For a list of all areas with employment in Substitute Teachers, Short-Term, see the Create Customized Tables function.
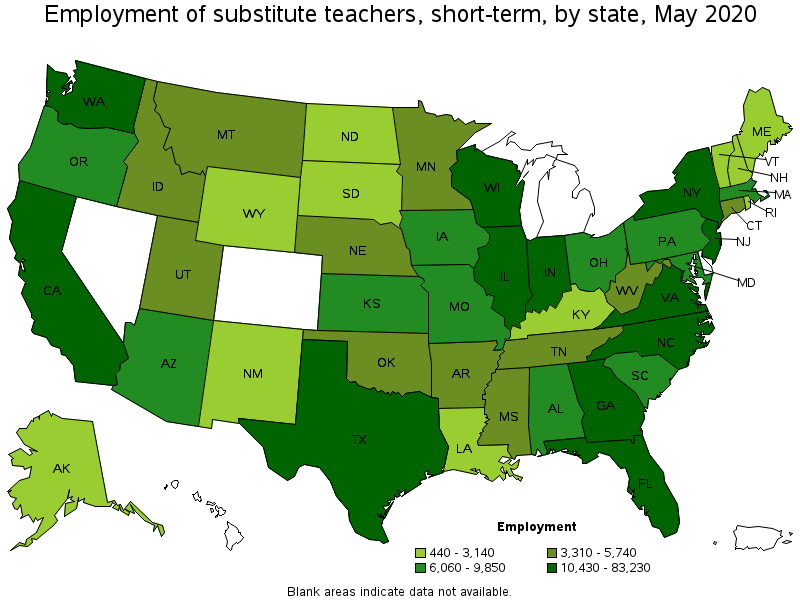
States with the highest employment level in Substitute Teachers, Short-Term:
| State | Employment (1) | Employment per thousand jobs | Location quotient (9) | Hourly mean wage | Annual mean wage (2) |
|---|---|---|---|---|---|
| California | 83,230 | 5.07 | 1.38 | $ 20.85 | $ 43,370 |
| Texas | 79,980 | 6.61 | 1.80 | $ 16.66 | $ 34,660 |
| New York | 29,780 | 3.43 | 0.93 | $ 19.77 | $ 41,110 |
| Illinois | 21,650 | 3.85 | 1.05 | $ 16.76 | $ 34,870 |
| Virginia | 21,300 | 5.76 | 1.56 | $ 13.53 | $ 28,150 |
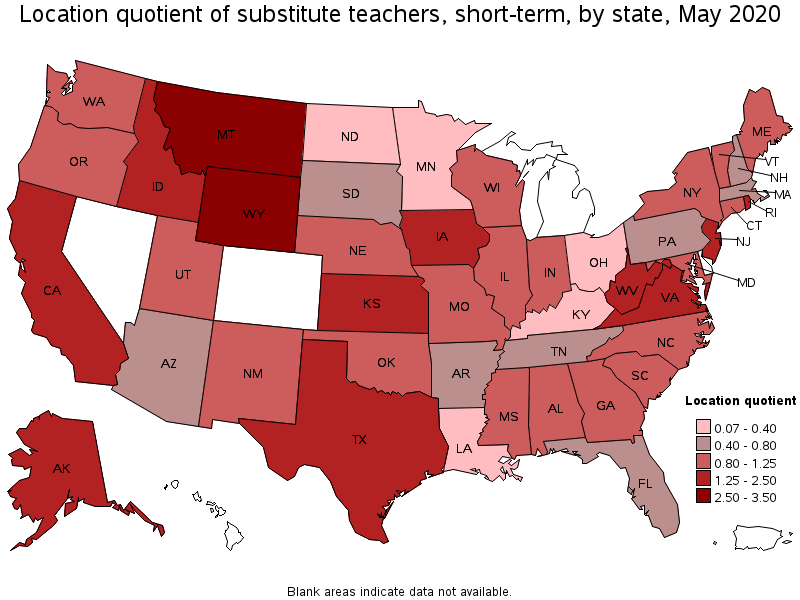
States with the highest concentration of jobs and location quotients in Substitute Teachers, Short-Term:
| State | Employment (1) | Employment per thousand jobs | Location quotient (9) | Hourly mean wage | Annual mean wage (2) |
|---|---|---|---|---|---|
| Wyoming | 2,600 | 9.93 | 2.70 | $ 15.60 | $ 32,440 |
| Montana | 4,330 | 9.50 | 2.58 | $ 10.82 | $ 22,500 |
| West Virginia | 4,830 | 7.44 | 2.02 | $ 19.47 | $ 40,510 |
| Alaska | 2,000 | 6.76 | 1.84 | $ 18.04 | $ 37,520 |
| Texas | 79,980 | 6.61 | 1.80 | $ 16.66 | $ 34,660 |
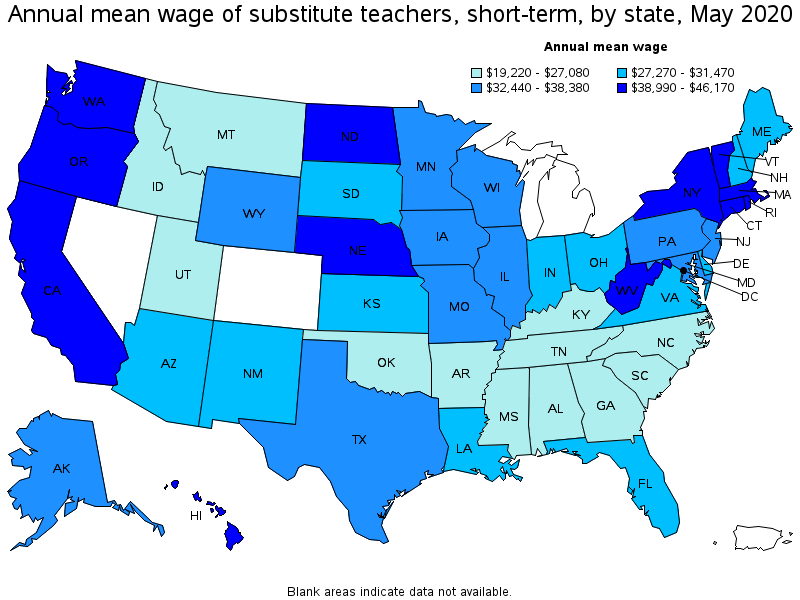
Top paying states for Substitute Teachers, Short-Term:
| State | Employment (1) | Employment per thousand jobs | Location quotient (9) | Hourly mean wage | Annual mean wage (2) |
|---|---|---|---|---|---|
| Hawaii | (8) | (8) | (8) | $ 22.20 | $ 46,170 |
| Massachusetts | 6,730 | 2.01 | 0.55 | $ 21.85 | $ 45,460 |
| Oregon | 6,060 | 3.35 | 0.91 | $ 21.73 | $ 45,190 |
| California | 83,230 | 5.07 | 1.38 | $ 20.85 | $ 43,370 |
| Washington | 13,590 | 4.25 | 1.16 | $ 20.69 | $ 43,040 |
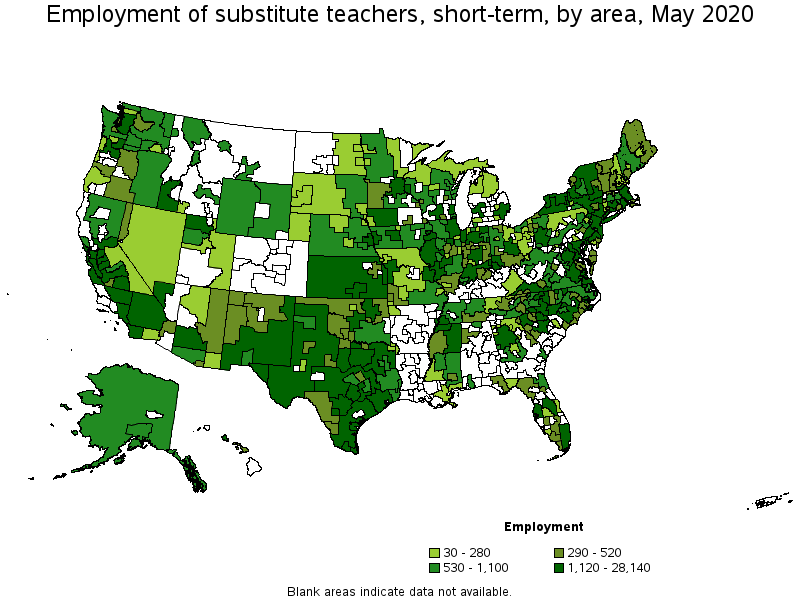
Metropolitan areas with the highest employment level in Substitute Teachers, Short-Term:
| Metropolitan area | Employment (1) | Employment per thousand jobs | Location quotient (9) | Hourly mean wage | Annual mean wage (2) |
|---|---|---|---|---|---|
| New York-Newark-Jersey City, NY-NJ-PA | 28,140 | 3.19 | 0.87 | $ 19.59 | $ 40,750 |
| Los Angeles-Long Beach-Anaheim, CA | 27,900 | 4.79 | 1.30 | $ 21.42 | $ 44,560 |
| Dallas-Fort Worth-Arlington, TX | 18,480 | 5.15 | 1.40 | $ 15.24 | $ 31,700 |
| Houston-The Woodlands-Sugar Land, TX | 16,870 | 5.68 | 1.54 | $ 23.82 | $ 49,540 |
| Washington-Arlington-Alexandria, DC-VA-MD-WV | 15,650 | 5.18 | 1.41 | $ 15.54 | $ 32,320 |
| Chicago-Naperville-Elgin, IL-IN-WI | 15,230 | 3.49 | 0.95 | $ 18.15 | $ 37,750 |
| Riverside-San Bernardino-Ontario, CA | 10,760 | 7.22 | 1.96 | $ 18.73 | $ 38,960 |
| San Francisco-Oakland-Hayward, CA | 10,600 | 4.55 | 1.24 | $ 21.77 | $ 45,280 |
| Atlanta-Sandy Springs-Roswell, GA | 8,810 | 3.35 | 0.91 | $ 10.27 | $ 21,370 |
| San Antonio-New Braunfels, TX | 7,020 | 6.99 | 1.90 | $ 15.21 | $ 31,630 |
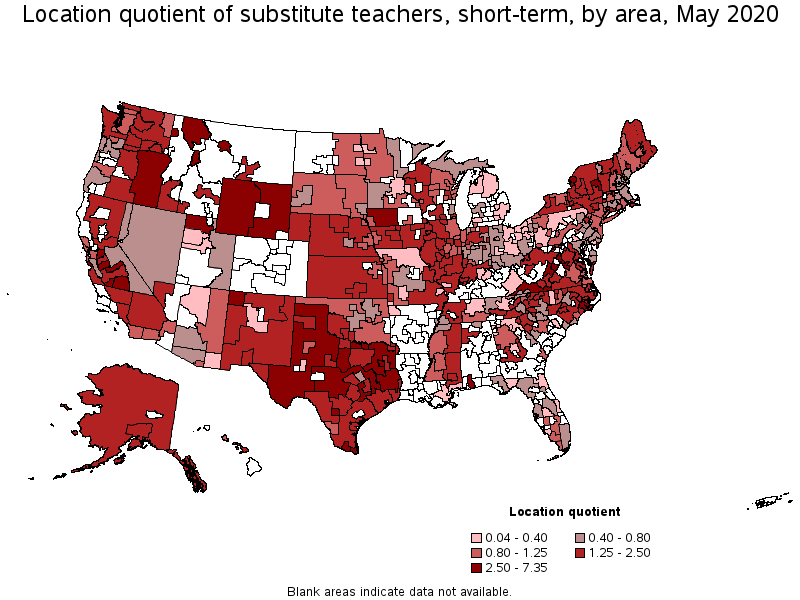
Metropolitan areas with the highest concentration of jobs and location quotients in Substitute Teachers, Short-Term:
| Metropolitan area | Employment (1) | Employment per thousand jobs | Location quotient (9) | Hourly mean wage | Annual mean wage (2) |
|---|---|---|---|---|---|
| Merced, CA | 1,930 | 27.04 | 7.35 | $ 18.14 | $ 37,730 |
| Madera, CA | 920 | 19.91 | 5.41 | $ 21.63 | $ 44,990 |
| Great Falls, MT | 600 | 17.53 | 4.76 | $ 10.65 | $ 22,160 |
| McAllen-Edinburg-Mission, TX | 4,220 | 16.23 | 4.41 | (8) | (8) |
| Visalia-Porterville, CA | 2,120 | 14.26 | 3.87 | $ 21.75 | $ 45,250 |
| Ogden-Clearfield, UT | 3,660 | 14.05 | 3.82 | $ 10.05 | $ 20,900 |
| Ocean City, NJ | 450 | 12.83 | 3.49 | $ 14.10 | $ 29,340 |
| Watertown-Fort Drum, NY | 440 | 12.10 | 3.29 | $ 14.86 | $ 30,910 |
| Daphne-Fairhope-Foley, AL | 880 | 12.01 | 3.26 | $ 8.35 | $ 17,360 |
| Farmington, NM | 520 | 11.92 | 3.24 | $ 15.31 | $ 31,840 |
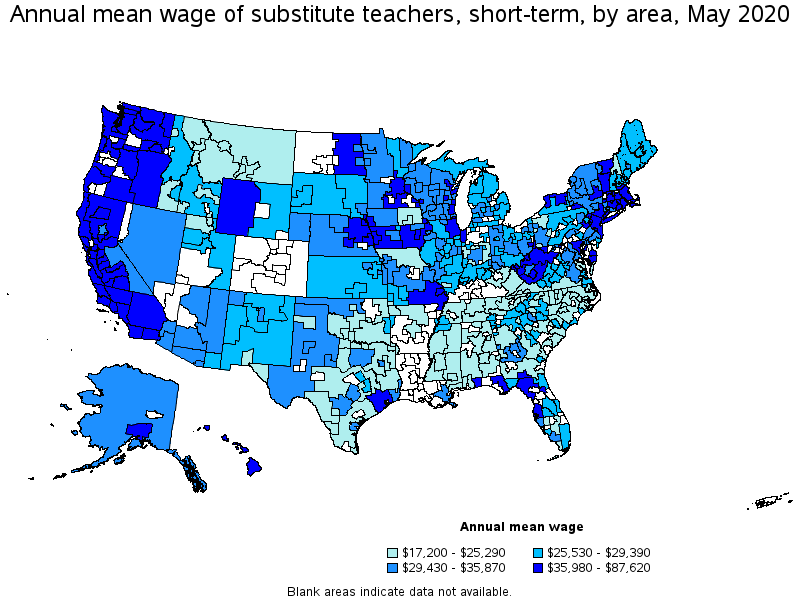
Top paying metropolitan areas for Substitute Teachers, Short-Term:
| Metropolitan area | Employment (1) | Employment per thousand jobs | Location quotient (9) | Hourly mean wage | Annual mean wage (2) |
|---|---|---|---|---|---|
| Salisbury, MD-DE | 350 | 2.35 | 0.64 | $ 42.13 | $ 87,620 |
| Santa Rosa, CA | 830 | 4.27 | 1.16 | $ 29.75 | $ 61,870 |
| San Jose-Sunnyvale-Santa Clara, CA | 1,670 | 1.51 | 0.41 | $ 29.28 | $ 60,900 |
| Vallejo-Fairfield, CA | (8) | (8) | (8) | $ 27.61 | $ 57,430 |
| Norwich-New London-Westerly, CT-RI | 340 | 3.08 | 0.84 | $ 25.67 | $ 53,390 |
| Salinas, CA | 1,320 | 7.71 | 2.09 | $ 25.29 | $ 52,610 |
| Springfield, MA-CT | 1,050 | 3.45 | 0.94 | $ 23.99 | $ 49,890 |
| Houston-The Woodlands-Sugar Land, TX | 16,870 | 5.68 | 1.54 | $ 23.82 | $ 49,540 |
| La Crosse-Onalaska, WI-MN | 310 | 4.32 | 1.17 | $ 23.82 | $ 49,530 |
| Iowa City, IA | (8) | (8) | (8) | $ 23.44 | $ 48,750 |
Nonmetropolitan areas with the highest employment in Substitute Teachers, Short-Term:
| Nonmetropolitan area | Employment (1) | Employment per thousand jobs | Location quotient (9) | Hourly mean wage | Annual mean wage (2) |
|---|---|---|---|---|---|
| Kansas nonmetropolitan area | 3,400 | 9.00 | 2.44 | $ 13.76 | $ 28,630 |
| North Texas Region of Texas nonmetropolitan area | 3,150 | 11.71 | 3.18 | $ 10.57 | $ 21,980 |
| Southeast Coastal North Carolina nonmetropolitan area | 2,010 | 8.37 | 2.27 | $ 10.51 | $ 21,850 |
| West Texas Region of Texas nonmetropolitan area | 1,910 | 9.95 | 2.70 | $ 14.25 | $ 29,640 |
| Hill Country Region of Texas nonmetropolitan area | 1,840 | 9.62 | 2.61 | $ 9.61 | $ 20,000 |
Nonmetropolitan areas with the highest concentration of jobs and location quotients in Substitute Teachers, Short-Term:
| Nonmetropolitan area | Employment (1) | Employment per thousand jobs | Location quotient (9) | Hourly mean wage | Annual mean wage (2) |
|---|---|---|---|---|---|
| Eastern Oregon nonmetropolitan area | 1,080 | 15.72 | 4.27 | $ 23.99 | $ 49,890 |
| North Texas Region of Texas nonmetropolitan area | 3,150 | 11.71 | 3.18 | $ 10.57 | $ 21,980 |
| Eastern Wyoming nonmetropolitan area | 930 | 11.30 | 3.07 | $ 14.13 | $ 29,390 |
| Big Thicket Region of Texas nonmetropolitan area | 1,090 | 10.51 | 2.86 | $ 9.62 | $ 20,000 |
| West Montana nonmetropolitan area | 770 | 10.31 | 2.80 | $ 11.18 | $ 23,260 |
Top paying nonmetropolitan areas for Substitute Teachers, Short-Term:
| Nonmetropolitan area | Employment (1) | Employment per thousand jobs | Location quotient (9) | Hourly mean wage | Annual mean wage (2) |
|---|---|---|---|---|---|
| Massachusetts nonmetropolitan area | 290 | 5.13 | 1.39 | $ 28.59 | $ 59,470 |
| North Florida nonmetropolitan area | 320 | 2.66 | 0.72 | $ 25.49 | $ 53,010 |
| Eastern Oregon nonmetropolitan area | 1,080 | 15.72 | 4.27 | $ 23.99 | $ 49,890 |
| Coast Oregon nonmetropolitan area | 190 | 1.80 | 0.49 | $ 22.35 | $ 46,480 |
| Hawaii / Kauai nonmetropolitan area | (8) | (8) | (8) | $ 21.96 | $ 45,680 |
These estimates are calculated with data collected from employers in all industry sectors, all metropolitan and nonmetropolitan areas, and all states and the District of Columbia. The top employment and wage figures are provided above. The complete list is available in the downloadable XLS files.
The percentile wage estimate is the value of a wage below which a certain percent of workers fall. The median wage is the 50th percentile wage estimate—50 percent of workers earn less than the median and 50 percent of workers earn more than the median. More about percentile wages.
(1) Estimates for detailed occupations do not sum to the totals because the totals include occupations not shown separately. Estimates do not include self-employed workers.
(2) Annual wages have been calculated by multiplying the hourly mean wage by a "year-round, full-time" hours figure of 2,080 hours; for those occupations where there is not an hourly wage published, the annual wage has been directly calculated from the reported survey data.
(3) The relative standard error (RSE) is a measure of the reliability of a survey statistic. The smaller the relative standard error, the more precise the estimate.
(8) Estimate not released.
(9) The location quotient is the ratio of the area concentration of occupational employment to the national average concentration. A location quotient greater than one indicates the occupation has a higher share of employment than average, and a location quotient less than one indicates the occupation is less prevalent in the area than average.
Other OEWS estimates and related information:
May 2020 National Occupational Employment and Wage Estimates
May 2020 State Occupational Employment and Wage Estimates
May 2020 Metropolitan and Nonmetropolitan Area Occupational Employment and Wage Estimates
May 2020 National Industry-Specific Occupational Employment and Wage Estimates
Last Modified Date: March 31, 2021