
An official website of the United States government
An official website of the United States government
The .gov means it's official.
Federal government websites often end in .gov or .mil. Before sharing sensitive information,
make sure you're on a federal government site.
The site is secure.
The
https:// ensures that you are connecting to the official website and that any
information you provide is encrypted and transmitted securely.
Officiate at competitive athletic or sporting events. Detect infractions of rules and decide penalties according to established regulations. Includes all sporting officials, referees, and competition judges.
Employment estimate and mean wage estimates for Umpires, Referees, and Other Sports Officials:
| Employment (1) | Employment RSE (3) |
Mean hourly wage |
Mean annual wage (2) |
Mean wage RSE (3) |
|---|---|---|---|---|
| 16,590 | 3.7 % | (4) | $ 40,140 | 5.1 % |
Percentile wage estimates for Umpires, Referees, and Other Sports Officials:
| Percentile | 10% | 25% | 50% (Median) |
75% | 90% |
|---|---|---|---|---|---|
| Annual Wage (2) | $ 18,750 | $ 22,560 | $ 28,940 | $ 45,590 | $ 63,480 |
Industries with the highest published employment and wages for Umpires, Referees, and Other Sports Officials are provided. For a list of all industries with employment in Umpires, Referees, and Other Sports Officials, see the Create Customized Tables function.
Industries with the highest levels of employment in Umpires, Referees, and Other Sports Officials:
| Industry | Employment (1) | Percent of industry employment | Hourly mean wage | Annual mean wage (2) |
|---|---|---|---|---|
| Local Government, excluding schools and hospitals (OEWS Designation) | 7,090 | 0.13 | (4) | $ 34,420 |
| Other Amusement and Recreation Industries | 2,540 | 0.25 | (4) | $ 32,880 |
| Spectator Sports | 1,770 | 1.61 | (4) | $ 54,000 |
| Civic and Social Organizations | 1,100 | 0.38 | (4) | $ 32,070 |
| Colleges, Universities, and Professional Schools | 830 | 0.03 | (4) | $ 37,180 |
Industries with the highest concentration of employment in Umpires, Referees, and Other Sports Officials:
| Industry | Employment (1) | Percent of industry employment | Hourly mean wage | Annual mean wage (2) |
|---|---|---|---|---|
| Spectator Sports | 1,770 | 1.61 | (4) | $ 54,000 |
| Promoters of Performing Arts, Sports, and Similar Events | 440 | 0.39 | (4) | $ 32,970 |
| Civic and Social Organizations | 1,100 | 0.38 | (4) | $ 32,070 |
| Other Amusement and Recreation Industries | 2,540 | 0.25 | (4) | $ 32,880 |
| Business, Professional, Labor, Political, and Similar Organizations | 720 | 0.17 | (8) | (8) |
Top paying industries for Umpires, Referees, and Other Sports Officials:
| Industry | Employment (1) | Percent of industry employment | Hourly mean wage | Annual mean wage (2) |
|---|---|---|---|---|
| Spectator Sports | 1,770 | 1.61 | (4) | $ 54,000 |
| State Government, excluding schools and hospitals (OEWS Designation) | 140 | 0.01 | (4) | $ 48,960 |
| Junior Colleges | 120 | 0.02 | (4) | $ 44,370 |
| Employment Services | (8) | (8) | (4) | $ 42,680 |
| Colleges, Universities, and Professional Schools | 830 | 0.03 | (4) | $ 37,180 |
States and areas with the highest published employment, location quotients, and wages for Umpires, Referees, and Other Sports Officials are provided. For a list of all areas with employment in Umpires, Referees, and Other Sports Officials, see the Create Customized Tables function.
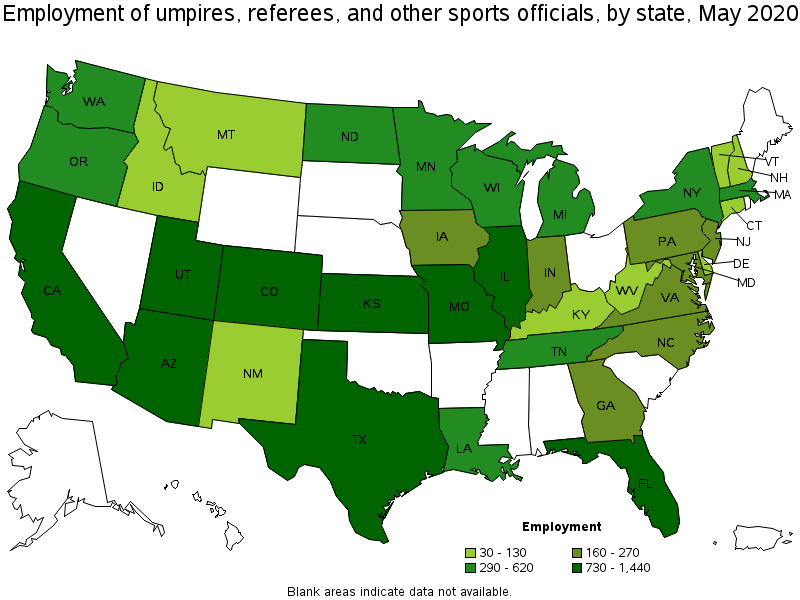
States with the highest employment level in Umpires, Referees, and Other Sports Officials:
| State | Employment (1) | Employment per thousand jobs | Location quotient (9) | Hourly mean wage | Annual mean wage (2) |
|---|---|---|---|---|---|
| California | 1,440 | 0.09 | 0.73 | (4) | $ 37,030 |
| Colorado | 1,350 | 0.52 | 4.38 | (4) | $ 34,230 |
| Utah | 1,050 | 0.71 | 5.93 | (4) | $ 23,030 |
| Missouri | 960 | 0.36 | 2.98 | (4) | $ 34,000 |
| Kansas | 880 | 0.66 | 5.54 | (4) | $ 32,300 |
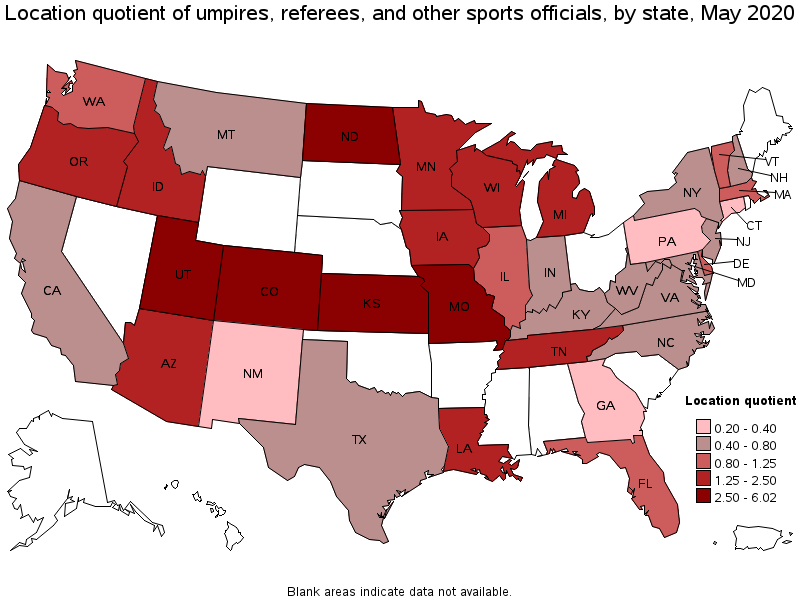
States with the highest concentration of jobs and location quotients in Umpires, Referees, and Other Sports Officials:
| State | Employment (1) | Employment per thousand jobs | Location quotient (9) | Hourly mean wage | Annual mean wage (2) |
|---|---|---|---|---|---|
| North Dakota | 290 | 0.72 | 6.02 | (4) | $ 35,540 |
| Utah | 1,050 | 0.71 | 5.93 | (4) | $ 23,030 |
| Kansas | 880 | 0.66 | 5.54 | (4) | $ 32,300 |
| Colorado | 1,350 | 0.52 | 4.38 | (4) | $ 34,230 |
| Missouri | 960 | 0.36 | 2.98 | (4) | $ 34,000 |
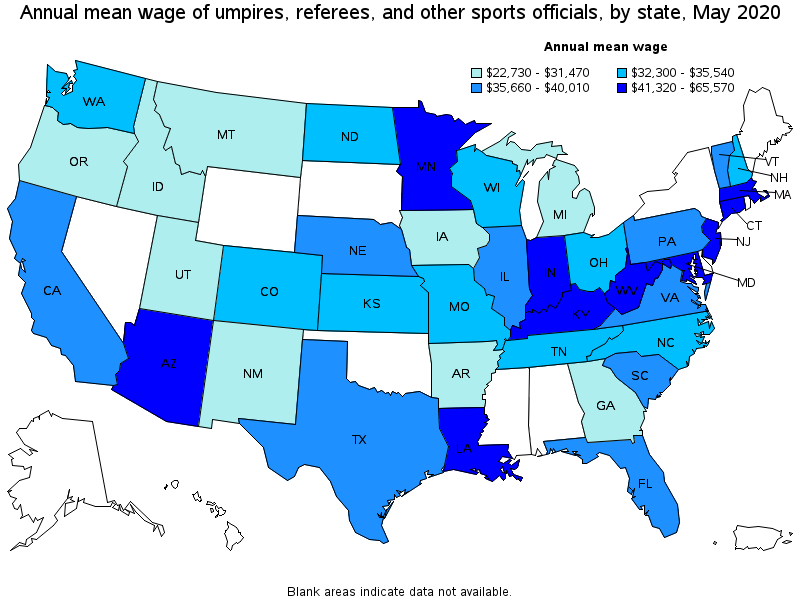
Top paying states for Umpires, Referees, and Other Sports Officials:
| State | Employment (1) | Employment per thousand jobs | Location quotient (9) | Hourly mean wage | Annual mean wage (2) |
|---|---|---|---|---|---|
| New Jersey | 190 | 0.05 | 0.43 | (4) | $ 65,570 |
| Louisiana | 440 | 0.24 | 2.05 | (4) | $ 59,130 |
| Massachusetts | 430 | 0.13 | 1.07 | (4) | $ 47,390 |
| Connecticut | 60 | 0.04 | 0.32 | (4) | $ 46,740 |
| Maryland | 200 | 0.08 | 0.67 | (4) | $ 44,700 |
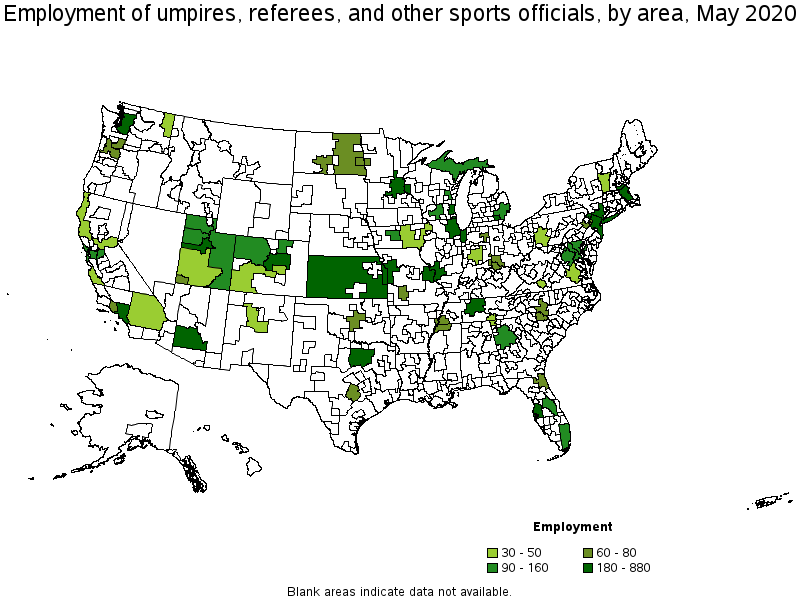
Metropolitan areas with the highest employment level in Umpires, Referees, and Other Sports Officials:
| Metropolitan area | Employment (1) | Employment per thousand jobs | Location quotient (9) | Hourly mean wage | Annual mean wage (2) |
|---|---|---|---|---|---|
| Denver-Aurora-Lakewood, CO | 880 | 0.61 | 5.09 | (4) | $ 34,750 |
| New York-Newark-Jersey City, NY-NJ-PA | 690 | 0.08 | 0.66 | (8) | (8) |
| Phoenix-Mesa-Scottsdale, AZ | 660 | 0.31 | 2.64 | (4) | $ 43,360 |
| Chicago-Naperville-Elgin, IL-IN-WI | 660 | 0.15 | 1.27 | (4) | $ 39,730 |
| Provo-Orem, UT | 550 | 2.17 | 18.19 | (4) | $ 19,630 |
| St. Louis, MO-IL | 500 | 0.39 | 3.24 | (4) | $ 34,830 |
| Kansas City, MO-KS | 420 | 0.41 | 3.41 | (4) | $ 35,960 |
| Los Angeles-Long Beach-Anaheim, CA | 390 | 0.07 | 0.56 | (4) | $ 36,650 |
| Nashville-Davidson--Murfreesboro--Franklin, TN | 370 | 0.38 | 3.21 | (4) | $ 33,650 |
| Boston-Cambridge-Nashua, MA-NH | 320 | 0.12 | 1.03 | (4) | $ 48,950 |
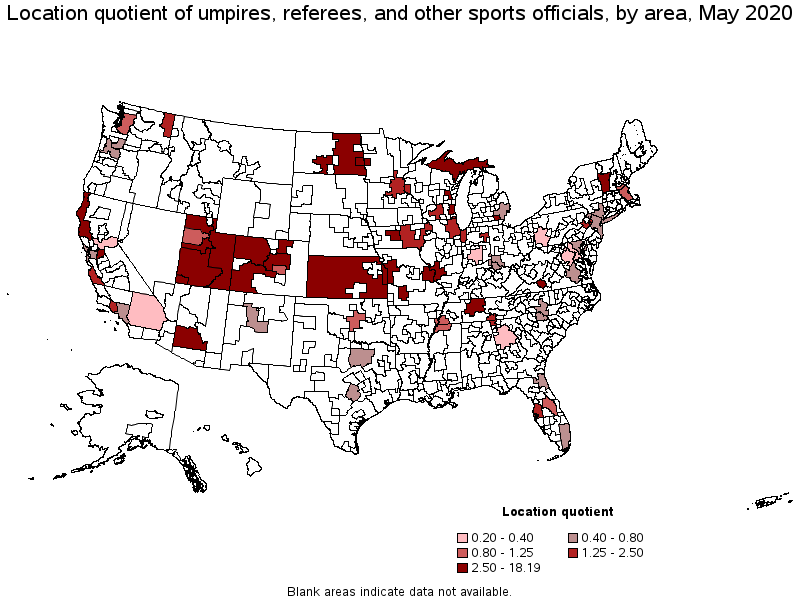
Metropolitan areas with the highest concentration of jobs and location quotients in Umpires, Referees, and Other Sports Officials:
| Metropolitan area | Employment (1) | Employment per thousand jobs | Location quotient (9) | Hourly mean wage | Annual mean wage (2) |
|---|---|---|---|---|---|
| Provo-Orem, UT | 550 | 2.17 | 18.19 | (4) | $ 19,630 |
| Greeley, CO | 130 | 1.25 | 10.49 | (4) | $ 30,110 |
| Bismarck, ND | 80 | 1.22 | 10.24 | (4) | $ 45,280 |
| St. George, UT | 80 | 1.16 | 9.72 | (4) | $ 27,900 |
| Ann Arbor, MI | 180 | 0.84 | 7.04 | (4) | $ 22,670 |
| Appleton, WI | 90 | 0.76 | 6.33 | (8) | (8) |
| Denver-Aurora-Lakewood, CO | 880 | 0.61 | 5.09 | (4) | $ 34,750 |
| Ogden-Clearfield, UT | 140 | 0.54 | 4.52 | (4) | $ 22,140 |
| Stockton-Lodi, CA | 130 | 0.51 | 4.30 | (4) | $ 33,240 |
| Fargo, ND-MN | 70 | 0.49 | 4.13 | (4) | $ 50,470 |
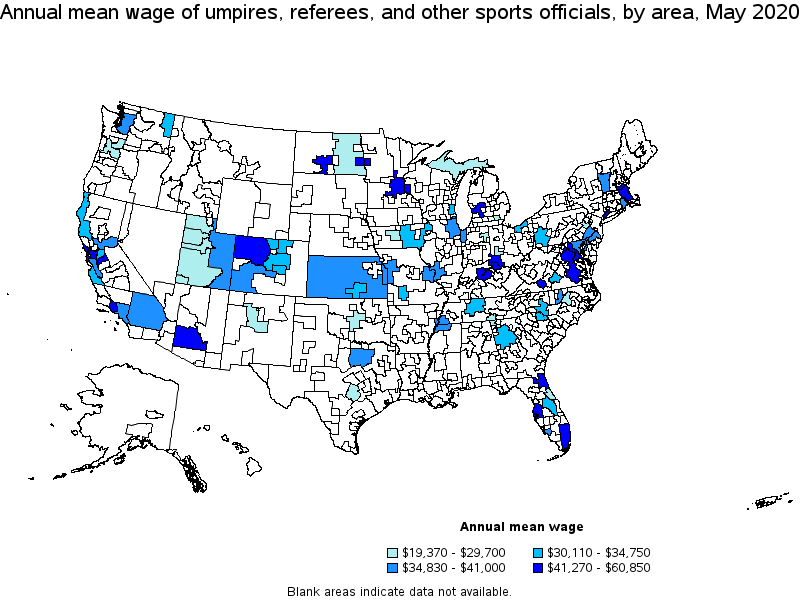
Top paying metropolitan areas for Umpires, Referees, and Other Sports Officials:
| Metropolitan area | Employment (1) | Employment per thousand jobs | Location quotient (9) | Hourly mean wage | Annual mean wage (2) |
|---|---|---|---|---|---|
| Washington-Arlington-Alexandria, DC-VA-MD-WV | 100 | 0.03 | 0.28 | (4) | $ 60,850 |
| Richmond, VA | 40 | 0.06 | 0.47 | (4) | $ 51,500 |
| Modesto, CA | (8) | (8) | (8) | (4) | $ 50,980 |
| Fargo, ND-MN | 70 | 0.49 | 4.13 | (4) | $ 50,470 |
| Boston-Cambridge-Nashua, MA-NH | 320 | 0.12 | 1.03 | (4) | $ 48,950 |
| Louisville/Jefferson County, KY-IN | (8) | (8) | (8) | (4) | $ 48,250 |
| Cincinnati, OH-KY-IN | 70 | 0.07 | 0.55 | (4) | $ 47,090 |
| Minneapolis-St. Paul-Bloomington, MN-WI | 280 | 0.15 | 1.28 | (4) | $ 46,810 |
| Jacksonville, FL | 60 | 0.09 | 0.76 | (4) | $ 46,300 |
| Blacksburg-Christiansburg-Radford, VA | 30 | 0.46 | 3.84 | (4) | $ 45,680 |
Nonmetropolitan areas with the highest employment in Umpires, Referees, and Other Sports Officials:
| Nonmetropolitan area | Employment (1) | Employment per thousand jobs | Location quotient (9) | Hourly mean wage | Annual mean wage (2) |
|---|---|---|---|---|---|
| Kansas nonmetropolitan area | 340 | 0.90 | 7.58 | (4) | $ 35,920 |
| Eastern Utah nonmetropolitan area | 130 | 1.69 | 14.13 | (4) | $ 37,980 |
| Northwest Colorado nonmetropolitan area | 100 | 0.84 | 7.07 | (4) | $ 42,300 |
| Upper Peninsula of Michigan nonmetropolitan area | 90 | 0.86 | 7.20 | (4) | $ 20,250 |
| East North Dakota nonmetropolitan area | 60 | 1.05 | 8.84 | (4) | $ 20,280 |
Nonmetropolitan areas with the highest concentration of jobs and location quotients in Umpires, Referees, and Other Sports Officials:
| Nonmetropolitan area | Employment (1) | Employment per thousand jobs | Location quotient (9) | Hourly mean wage | Annual mean wage (2) |
|---|---|---|---|---|---|
| Eastern Utah nonmetropolitan area | 130 | 1.69 | 14.13 | (4) | $ 37,980 |
| East North Dakota nonmetropolitan area | 60 | 1.05 | 8.84 | (4) | $ 20,280 |
| Kansas nonmetropolitan area | 340 | 0.90 | 7.58 | (4) | $ 35,920 |
| Upper Peninsula of Michigan nonmetropolitan area | 90 | 0.86 | 7.20 | (4) | $ 20,250 |
| Northwest Colorado nonmetropolitan area | 100 | 0.84 | 7.07 | (4) | $ 42,300 |
Top paying nonmetropolitan areas for Umpires, Referees, and Other Sports Officials:
| Nonmetropolitan area | Employment (1) | Employment per thousand jobs | Location quotient (9) | Hourly mean wage | Annual mean wage (2) |
|---|---|---|---|---|---|
| Northwest Colorado nonmetropolitan area | 100 | 0.84 | 7.07 | (4) | $ 42,300 |
| Eastern Utah nonmetropolitan area | 130 | 1.69 | 14.13 | (4) | $ 37,980 |
| Southern Vermont nonmetropolitan area | 30 | 0.32 | 2.64 | (4) | $ 37,010 |
| Southwest Colorado nonmetropolitan area | 30 | 0.34 | 2.89 | (4) | $ 36,340 |
| Kansas nonmetropolitan area | 340 | 0.90 | 7.58 | (4) | $ 35,920 |
These estimates are calculated with data collected from employers in all industry sectors, all metropolitan and nonmetropolitan areas, and all states and the District of Columbia. The top employment and wage figures are provided above. The complete list is available in the downloadable XLS files.
The percentile wage estimate is the value of a wage below which a certain percent of workers fall. The median wage is the 50th percentile wage estimate—50 percent of workers earn less than the median and 50 percent of workers earn more than the median. More about percentile wages.
(1) Estimates for detailed occupations do not sum to the totals because the totals include occupations not shown separately. Estimates do not include self-employed workers.
(2) Annual wages have been calculated by multiplying the hourly mean wage by a "year-round, full-time" hours figure of 2,080 hours; for those occupations where there is not an hourly wage published, the annual wage has been directly calculated from the reported survey data.
(3) The relative standard error (RSE) is a measure of the reliability of a survey statistic. The smaller the relative standard error, the more precise the estimate.
(4) Wages for some occupations that do not generally work year-round, full time, are reported either as hourly wages or annual salaries depending on how they are typically paid.
(8) Estimate not released.
(9) The location quotient is the ratio of the area concentration of occupational employment to the national average concentration. A location quotient greater than one indicates the occupation has a higher share of employment than average, and a location quotient less than one indicates the occupation is less prevalent in the area than average.
Other OEWS estimates and related information:
May 2020 National Occupational Employment and Wage Estimates
May 2020 State Occupational Employment and Wage Estimates
May 2020 Metropolitan and Nonmetropolitan Area Occupational Employment and Wage Estimates
May 2020 National Industry-Specific Occupational Employment and Wage Estimates
Last Modified Date: March 31, 2021