
An official website of the United States government
An official website of the United States government
The .gov means it's official.
Federal government websites often end in .gov or .mil. Before sharing sensitive information,
make sure you're on a federal government site.
The site is secure.
The
https:// ensures that you are connecting to the official website and that any
information you provide is encrypted and transmitted securely.
Diagnose, treat, and provide preventive care to individuals and families across the lifespan. May refer patients to specialists when needed for further diagnosis or treatment. Excludes "General Internal Medicine Physicians" (29-1216) and "Pediatricians, General" (29-1221).
Employment estimate and mean wage estimates for Family Medicine Physicians:
| Employment (1) | Employment RSE (3) |
Mean hourly wage |
Mean annual wage (2) |
Wage RSE (3) |
|---|---|---|---|---|
| 98,590 | 2.3 % | $ 103.06 | $ 214,370 | 1.3 % |
Percentile wage estimates for Family Medicine Physicians:
| Percentile | 10% | 25% | 50% (Median) |
75% | 90% |
|---|---|---|---|---|---|
| Hourly Wage | $ 38.28 | $ 71.31 | $ 99.70 | (5) | (5) |
| Annual Wage (2) | $ 79,610 | $ 148,320 | $ 207,380 | (5) | (5) |
Industries with the highest published employment and wages for Family Medicine Physicians are provided. For a list of all industries with employment in Family Medicine Physicians, see the Create Customized Tables function.
Industries with the highest levels of employment in Family Medicine Physicians:
| Industry | Employment (1) | Percent of industry employment | Hourly mean wage | Annual mean wage (2) |
|---|---|---|---|---|
| Offices of Physicians | 66,610 | 2.57 | $ 105.75 | $ 219,950 |
| General Medical and Surgical Hospitals | 19,210 | 0.34 | $ 92.79 | $ 193,000 |
| Outpatient Care Centers | 5,440 | 0.57 | $ 109.79 | $ 228,360 |
| Colleges, Universities, and Professional Schools | 1,510 | 0.05 | $ 84.19 | $ 175,120 |
| Local Government, excluding schools and hospitals (OEWS Designation) | 1,250 | 0.02 | $ 107.75 | $ 224,120 |
Industries with the highest concentration of employment in Family Medicine Physicians:
| Industry | Employment (1) | Percent of industry employment | Hourly mean wage | Annual mean wage (2) |
|---|---|---|---|---|
| Offices of Physicians | 66,610 | 2.57 | $ 105.75 | $ 219,950 |
| Outpatient Care Centers | 5,440 | 0.57 | $ 109.79 | $ 228,360 |
| General Medical and Surgical Hospitals | 19,210 | 0.34 | $ 92.79 | $ 193,000 |
| Psychiatric and Substance Abuse Hospitals | 420 | 0.17 | $ 113.67 | $ 236,430 |
| Offices of Other Health Practitioners | 560 | 0.06 | $ 86.57 | $ 180,070 |
Top paying industries for Family Medicine Physicians:
| Industry | Employment (1) | Percent of industry employment | Hourly mean wage | Annual mean wage (2) |
|---|---|---|---|---|
| Residential Intellectual and Developmental Disability, Mental Health, and Substance Abuse Facilities | 30 | 0.01 | $ 126.84 | $ 263,840 |
| Insurance Carriers | 40 | (7) | $ 122.23 | $ 254,240 |
| State Government, excluding schools and hospitals (OEWS Designation) | 960 | 0.04 | $ 121.77 | $ 253,290 |
| Medical and Diagnostic Laboratories | 110 | 0.04 | $ 117.04 | $ 243,450 |
| Psychiatric and Substance Abuse Hospitals | 420 | 0.17 | $ 113.67 | $ 236,430 |
States and areas with the highest published employment, location quotients, and wages for Family Medicine Physicians are provided. For a list of all areas with employment in Family Medicine Physicians, see the Create Customized Tables function.
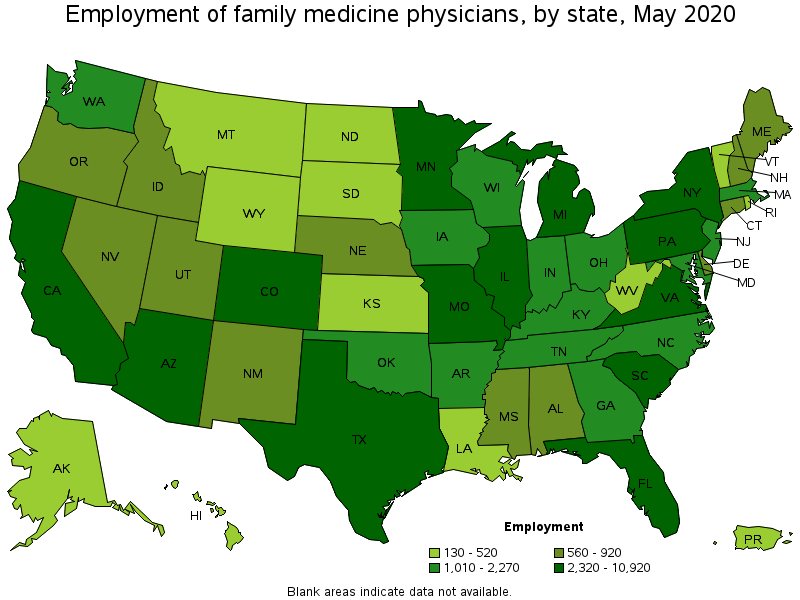
States with the highest employment level in Family Medicine Physicians:
| State | Employment (1) | Employment per thousand jobs | Location quotient (9) | Hourly mean wage | Annual mean wage (2) |
|---|---|---|---|---|---|
| California | 10,920 | 0.66 | 0.94 | $ 103.78 | $ 215,860 |
| Florida | 8,510 | 1.01 | 1.42 | $ 98.27 | $ 204,390 |
| Texas | 8,010 | 0.66 | 0.93 | $ 105.96 | $ 220,390 |
| Missouri | 7,520 | 2.80 | 3.94 | $ 93.33 | $ 194,120 |
| Illinois | 5,100 | 0.91 | 1.28 | $ 102.17 | $ 212,510 |
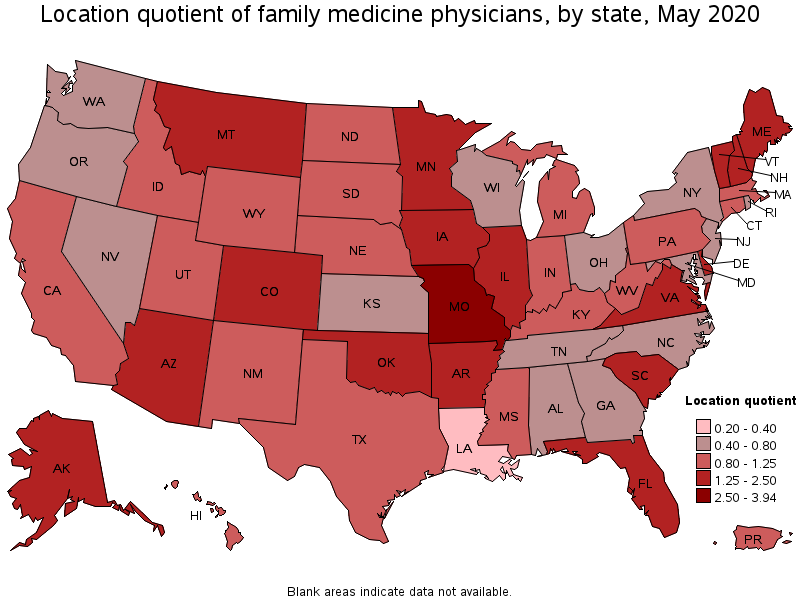
States with the highest concentration of jobs and location quotients in Family Medicine Physicians:
| State | Employment (1) | Employment per thousand jobs | Location quotient (9) | Hourly mean wage | Annual mean wage (2) |
|---|---|---|---|---|---|
| Missouri | 7,520 | 2.80 | 3.94 | $ 93.33 | $ 194,120 |
| Alaska | 420 | 1.41 | 1.99 | $ 126.93 | $ 264,010 |
| Vermont | 390 | 1.38 | 1.95 | $ 98.80 | $ 205,510 |
| Delaware | 560 | 1.31 | 1.84 | $ 107.18 | $ 222,930 |
| South Carolina | 2,420 | 1.20 | 1.69 | $ 104.13 | $ 216,590 |
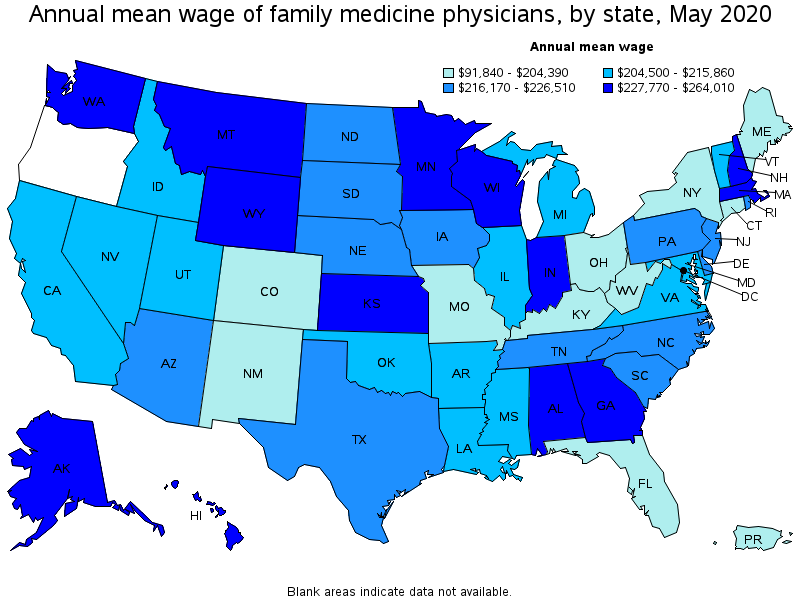
Top paying states for Family Medicine Physicians:
| State | Employment (1) | Employment per thousand jobs | Location quotient (9) | Hourly mean wage | Annual mean wage (2) |
|---|---|---|---|---|---|
| Alaska | 420 | 1.41 | 1.99 | $ 126.93 | $ 264,010 |
| New Hampshire | 690 | 1.11 | 1.57 | $ 122.64 | $ 255,090 |
| Wisconsin | 1,410 | 0.52 | 0.74 | $ 122.45 | $ 254,690 |
| Hawaii | 350 | 0.61 | 0.86 | $ 120.76 | $ 251,180 |
| Minnesota | 2,450 | 0.90 | 1.27 | $ 119.54 | $ 248,630 |
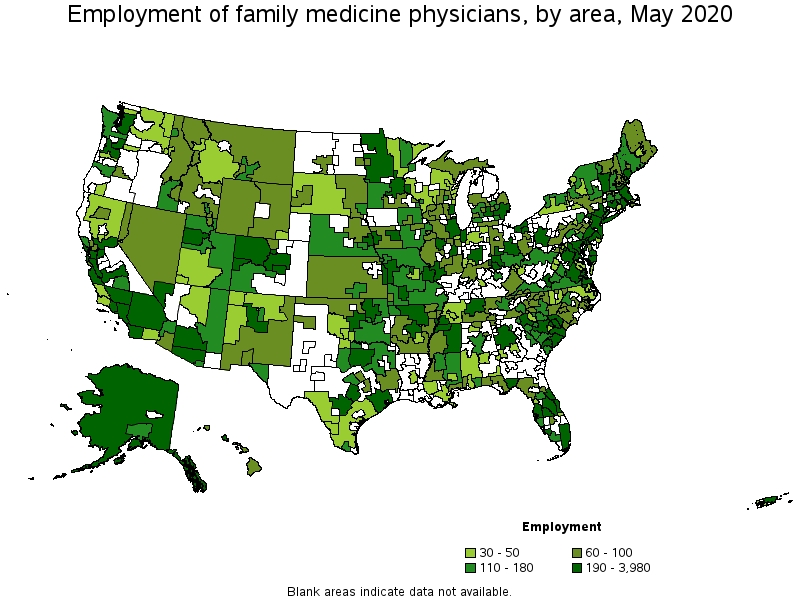
Metropolitan areas with the highest employment level in Family Medicine Physicians:
| Metropolitan area | Employment (1) | Employment per thousand jobs | Location quotient (9) | Hourly mean wage | Annual mean wage (2) |
|---|---|---|---|---|---|
| New York-Newark-Jersey City, NY-NJ-PA | 3,980 | 0.45 | 0.64 | $ 99.74 | $ 207,450 |
| Chicago-Naperville-Elgin, IL-IN-WI | 3,770 | 0.86 | 1.22 | $ 98.92 | $ 205,760 |
| St. Louis, MO-IL | 3,480 | 2.67 | 3.77 | $ 84.76 | $ 176,300 |
| Los Angeles-Long Beach-Anaheim, CA | 2,920 | 0.50 | 0.71 | $ 69.18 | $ 143,880 |
| Dallas-Fort Worth-Arlington, TX | 2,740 | 0.76 | 1.08 | $ 100.96 | $ 210,000 |
| Miami-Fort Lauderdale-West Palm Beach, FL | 2,630 | 1.05 | 1.48 | $ 82.88 | $ 172,390 |
| Kansas City, MO-KS | 2,480 | 2.40 | 3.39 | $ 108.71 | $ 226,120 |
| Philadelphia-Camden-Wilmington, PA-NJ-DE-MD | 2,130 | 0.79 | 1.11 | $ 102.90 | $ 214,040 |
| Washington-Arlington-Alexandria, DC-VA-MD-WV | 2,020 | 0.67 | 0.94 | $ 105.74 | $ 219,930 |
| Phoenix-Mesa-Scottsdale, AZ | 1,990 | 0.94 | 1.33 | $ 105.79 | $ 220,040 |
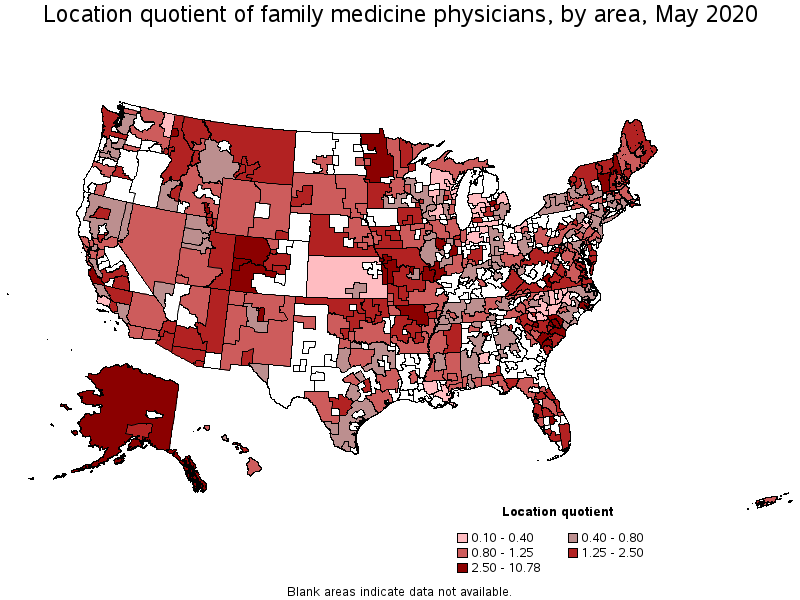
Metropolitan areas with the highest concentration of jobs and location quotients in Family Medicine Physicians:
| Metropolitan area | Employment (1) | Employment per thousand jobs | Location quotient (9) | Hourly mean wage | Annual mean wage (2) |
|---|---|---|---|---|---|
| Columbia, MO | 670 | 7.64 | 10.78 | $ 58.78 | $ 122,260 |
| Grand Junction, CO | 220 | 3.71 | 5.24 | $ 94.34 | $ 196,240 |
| Pocatello, ID | 120 | 3.57 | 5.03 | $ 82.98 | $ 172,600 |
| Sebring, FL | 90 | 3.48 | 4.90 | (8) | (8) |
| St. Joseph, MO-KS | 170 | 3.23 | 4.56 | $ 123.31 | $ 256,490 |
| St. Louis, MO-IL | 3,480 | 2.67 | 3.77 | $ 84.76 | $ 176,300 |
| Florence, SC | 210 | 2.54 | 3.59 | $ 130.85 | $ 272,170 |
| Kansas City, MO-KS | 2,480 | 2.40 | 3.39 | $ 108.71 | $ 226,120 |
| Champaign-Urbana, IL | 220 | 2.26 | 3.19 | $ 104.64 | $ 217,650 |
| Santa Fe, NM | 120 | 2.11 | 2.98 | $ 86.49 | $ 179,900 |
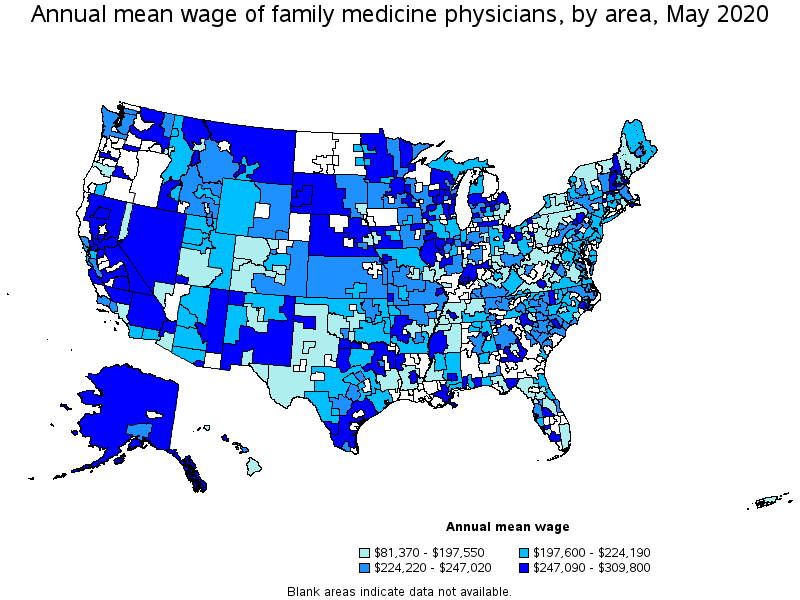
Top paying metropolitan areas for Family Medicine Physicians:
| Metropolitan area | Employment (1) | Employment per thousand jobs | Location quotient (9) | Hourly mean wage | Annual mean wage (2) |
|---|---|---|---|---|---|
| San Luis Obispo-Paso Robles-Arroyo Grande, CA | 40 | 0.41 | 0.58 | (5) | (5) |
| Leominster-Gardner, MA | (8) | (8) | (8) | (5) | (5) |
| Bloomsburg-Berwick, PA | 30 | 0.89 | 1.25 | $ 148.94 | $ 309,800 |
| Napa, CA | 60 | 0.86 | 1.21 | $ 145.21 | $ 302,040 |
| Gadsden, AL | 60 | 1.87 | 2.64 | $ 140.44 | $ 292,110 |
| Vallejo-Fairfield, CA | 60 | 0.46 | 0.65 | $ 140.20 | $ 291,610 |
| Lebanon, PA | 30 | 0.66 | 0.93 | $ 139.43 | $ 290,010 |
| Salinas, CA | 340 | 1.99 | 2.81 | $ 138.09 | $ 287,220 |
| Appleton, WI | 80 | 0.66 | 0.93 | $ 137.91 | $ 286,860 |
| Milwaukee-Waukesha-West Allis, WI | 500 | 0.62 | 0.87 | $ 136.93 | $ 284,810 |
Nonmetropolitan areas with the highest employment in Family Medicine Physicians:
| Nonmetropolitan area | Employment (1) | Employment per thousand jobs | Location quotient (9) | Hourly mean wage | Annual mean wage (2) |
|---|---|---|---|---|---|
| Northwest Minnesota nonmetropolitan area | 370 | 2.06 | 2.91 | $ 125.91 | $ 261,900 |
| North Arkansas nonmetropolitan area | 280 | 2.45 | 3.45 | $ 110.78 | $ 230,420 |
| Northeast Mississippi nonmetropolitan area | 280 | 1.23 | 1.74 | $ 91.28 | $ 189,860 |
| Alaska nonmetropolitan area | 230 | 2.35 | 3.31 | $ 135.42 | $ 281,670 |
| Northwest Colorado nonmetropolitan area | 230 | 1.99 | 2.80 | $ 94.51 | $ 196,580 |
Nonmetropolitan areas with the highest concentration of jobs and location quotients in Family Medicine Physicians:
| Nonmetropolitan area | Employment (1) | Employment per thousand jobs | Location quotient (9) | Hourly mean wage | Annual mean wage (2) |
|---|---|---|---|---|---|
| Lower Savannah South Carolina nonmetropolitan area | 130 | 2.49 | 3.51 | $ 118.49 | $ 246,450 |
| North Arkansas nonmetropolitan area | 280 | 2.45 | 3.45 | $ 110.78 | $ 230,420 |
| Alaska nonmetropolitan area | 230 | 2.35 | 3.31 | $ 135.42 | $ 281,670 |
| Northern New Hampshire nonmetropolitan area | 70 | 2.18 | 3.08 | $ 119.70 | $ 248,980 |
| Northeast South Carolina nonmetropolitan area | 200 | 2.07 | 2.92 | $ 109.34 | $ 227,430 |
Top paying nonmetropolitan areas for Family Medicine Physicians:
| Nonmetropolitan area | Employment (1) | Employment per thousand jobs | Location quotient (9) | Hourly mean wage | Annual mean wage (2) |
|---|---|---|---|---|---|
| Massachusetts nonmetropolitan area | 60 | 1.07 | 1.51 | $ 140.66 | $ 292,570 |
| Northwest Mississippi nonmetropolitan area | 80 | 0.86 | 1.21 | $ 137.43 | $ 285,860 |
| Northeast Nebraska nonmetropolitan area | 80 | 0.85 | 1.20 | $ 136.66 | $ 284,250 |
| Alaska nonmetropolitan area | 230 | 2.35 | 3.31 | $ 135.42 | $ 281,670 |
| Eastern Sierra-Mother Lode Region of California nonmetropolitan area | (8) | (8) | (8) | $ 130.65 | $ 271,750 |
These estimates are calculated with data collected from employers in all industry sectors, all metropolitan and nonmetropolitan areas, and all states and the District of Columbia. The top employment and wage figures are provided above. The complete list is available in the downloadable XLS files.
The percentile wage estimate is the value of a wage below which a certain percent of workers fall. The median wage is the 50th percentile wage estimate—50 percent of workers earn less than the median and 50 percent of workers earn more than the median. More about percentile wages.
(1) Estimates for detailed occupations do not sum to the totals because the totals include occupations not shown separately. Estimates do not include self-employed workers.
(2) Annual wages have been calculated by multiplying the hourly mean wage by a "year-round, full-time" hours figure of 2,080 hours; for those occupations where there is not an hourly wage published, the annual wage has been directly calculated from the reported survey data.
(3) The relative standard error (RSE) is a measure of the reliability of a survey statistic. The smaller the relative standard error, the more precise the estimate.
(5) This wage is equal to or greater than $100.00 per hour or $208,000 per year.
(7) The value is less than .005 percent of industry employment.
(8) Estimate not released.
(9) The location quotient is the ratio of the area concentration of occupational employment to the national average concentration. A location quotient greater than one indicates the occupation has a higher share of employment than average, and a location quotient less than one indicates the occupation is less prevalent in the area than average.
Other OEWS estimates and related information:
May 2020 National Occupational Employment and Wage Estimates
May 2020 State Occupational Employment and Wage Estimates
May 2020 Metropolitan and Nonmetropolitan Area Occupational Employment and Wage Estimates
May 2020 National Industry-Specific Occupational Employment and Wage Estimates
Last Modified Date: March 31, 2021