
An official website of the United States government
An official website of the United States government
The .gov means it's official.
Federal government websites often end in .gov or .mil. Before sharing sensitive information,
make sure you're on a federal government site.
The site is secure.
The
https:// ensures that you are connecting to the official website and that any
information you provide is encrypted and transmitted securely.
Assist mentally impaired or emotionally disturbed patients, working under direction of nursing and medical staff. May assist with daily living activities, lead patients in educational and recreational activities, or accompany patients to and from examinations and treatments. May restrain violent patients. Includes psychiatric orderlies.
Employment estimate and mean wage estimates for Psychiatric Aides:
| Employment (1) | Employment RSE (3) |
Mean hourly wage |
Mean annual wage (2) |
Wage RSE (3) |
|---|---|---|---|---|
| 51,550 | 2.3 % | $ 16.01 | $ 33,300 | 0.9 % |
Percentile wage estimates for Psychiatric Aides:
| Percentile | 10% | 25% | 50% (Median) |
75% | 90% |
|---|---|---|---|---|---|
| Hourly Wage | $ 10.50 | $ 12.32 | $ 15.18 | $ 18.88 | $ 23.50 |
| Annual Wage (2) | $ 21,840 | $ 25,630 | $ 31,570 | $ 39,270 | $ 48,880 |
Industries with the highest published employment and wages for Psychiatric Aides are provided. For a list of all industries with employment in Psychiatric Aides, see the Create Customized Tables function.
Industries with the highest levels of employment in Psychiatric Aides:
| Industry | Employment (1) | Percent of industry employment | Hourly mean wage | Annual mean wage (2) |
|---|---|---|---|---|
| Psychiatric and Substance Abuse Hospitals | 23,250 | 9.61 | $ 16.97 | $ 35,290 |
| State Government, excluding schools and hospitals (OEWS Designation) | 11,120 | 0.51 | $ 15.67 | $ 32,580 |
| Residential Intellectual and Developmental Disability, Mental Health, and Substance Abuse Facilities | 6,040 | 0.96 | $ 13.23 | $ 27,520 |
| General Medical and Surgical Hospitals | 3,520 | 0.06 | $ 18.54 | $ 38,560 |
| Outpatient Care Centers | 2,380 | 0.25 | $ 14.66 | $ 30,500 |
Industries with the highest concentration of employment in Psychiatric Aides:
| Industry | Employment (1) | Percent of industry employment | Hourly mean wage | Annual mean wage (2) |
|---|---|---|---|---|
| Psychiatric and Substance Abuse Hospitals | 23,250 | 9.61 | $ 16.97 | $ 35,290 |
| Residential Intellectual and Developmental Disability, Mental Health, and Substance Abuse Facilities | 6,040 | 0.96 | $ 13.23 | $ 27,520 |
| State Government, excluding schools and hospitals (OEWS Designation) | 11,120 | 0.51 | $ 15.67 | $ 32,580 |
| Specialty (except Psychiatric and Substance Abuse) Hospitals | 770 | 0.29 | $ 13.63 | $ 28,360 |
| Outpatient Care Centers | 2,380 | 0.25 | $ 14.66 | $ 30,500 |
Top paying industries for Psychiatric Aides:
| Industry | Employment (1) | Percent of industry employment | Hourly mean wage | Annual mean wage (2) |
|---|---|---|---|---|
| Elementary and Secondary Schools | 70 | (7) | $ 20.38 | $ 42,390 |
| Employment Services | 220 | 0.01 | $ 18.94 | $ 39,400 |
| General Medical and Surgical Hospitals | 3,520 | 0.06 | $ 18.54 | $ 38,560 |
| Vocational Rehabilitation Services | (8) | (8) | $ 17.23 | $ 35,840 |
| Psychiatric and Substance Abuse Hospitals | 23,250 | 9.61 | $ 16.97 | $ 35,290 |
States and areas with the highest published employment, location quotients, and wages for Psychiatric Aides are provided. For a list of all areas with employment in Psychiatric Aides, see the Create Customized Tables function.
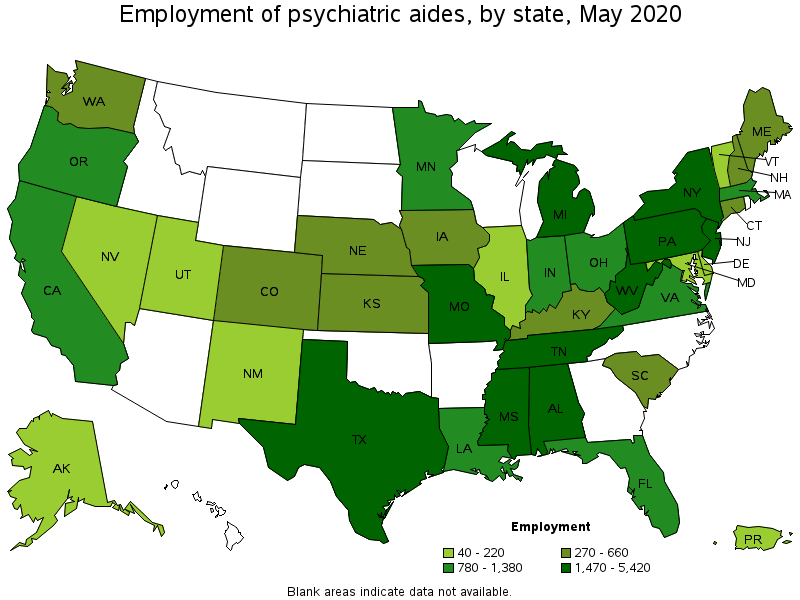
States with the highest employment level in Psychiatric Aides:
| State | Employment (1) | Employment per thousand jobs | Location quotient (9) | Hourly mean wage | Annual mean wage (2) |
|---|---|---|---|---|---|
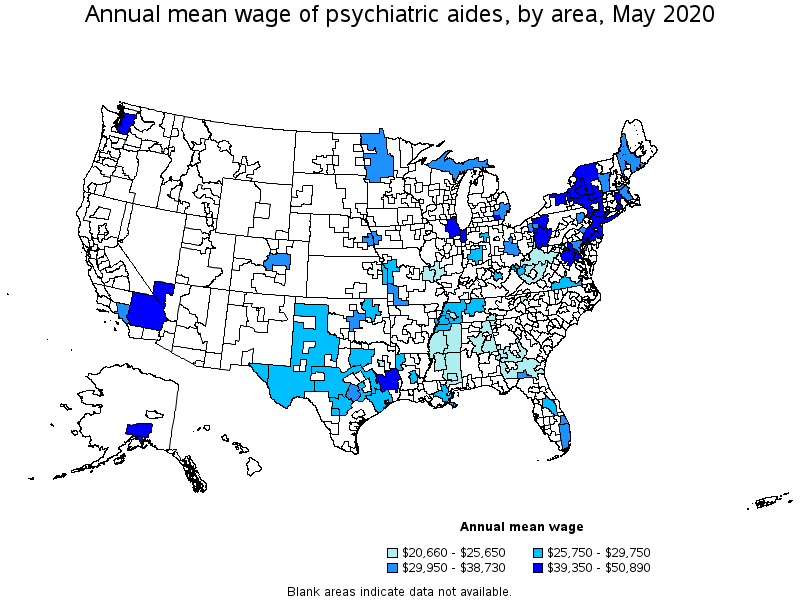
| New York | 5,420 | 0.62 | 1.68 | $ 21.82 | $ 45,390 |
| Texas | 5,110 | 0.42 | 1.14 | $ 13.43 | $ 27,940 |
| Mississippi | 3,020 | 2.81 | 7.57 | $ 10.89 | $ 22,650 |
| Tennessee | 2,440 | 0.84 | 2.26 | $ 12.83 | $ 26,690 |
| New Jersey | 2,180 | 0.58 | 1.55 | $ 20.17 | $ 41,960 |
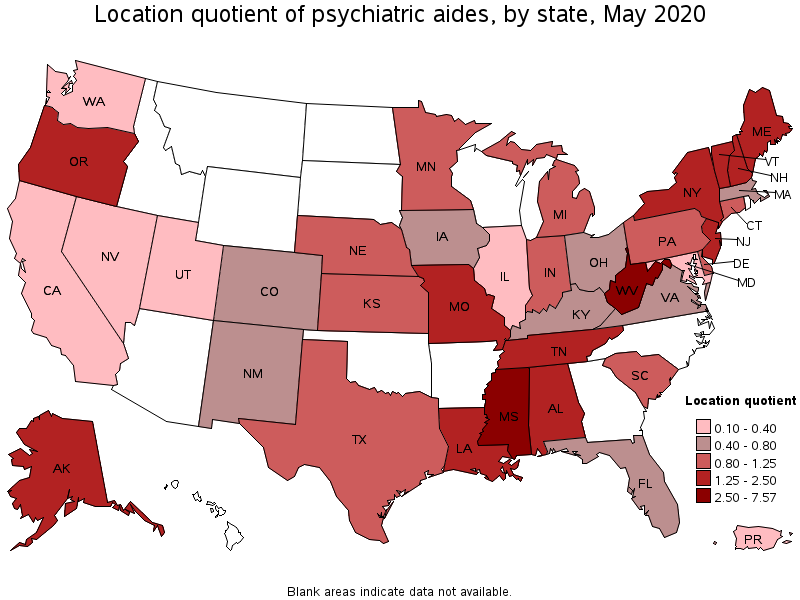
States with the highest concentration of jobs and location quotients in Psychiatric Aides:
| State | Employment (1) | Employment per thousand jobs | Location quotient (9) | Hourly mean wage | Annual mean wage (2) |
|---|---|---|---|---|---|
| Mississippi | 3,020 | 2.81 | 7.57 | $ 10.89 | $ 22,650 |
| West Virginia | 1,470 | 2.26 | 6.11 | $ 11.66 | $ 24,240 |
| Tennessee | 2,440 | 0.84 | 2.26 | $ 12.83 | $ 26,690 |
| Alabama | 1,580 | 0.83 | 2.24 | $ 11.97 | $ 24,910 |
| New Hampshire | 400 | 0.65 | 1.76 | $ 18.92 | $ 39,360 |
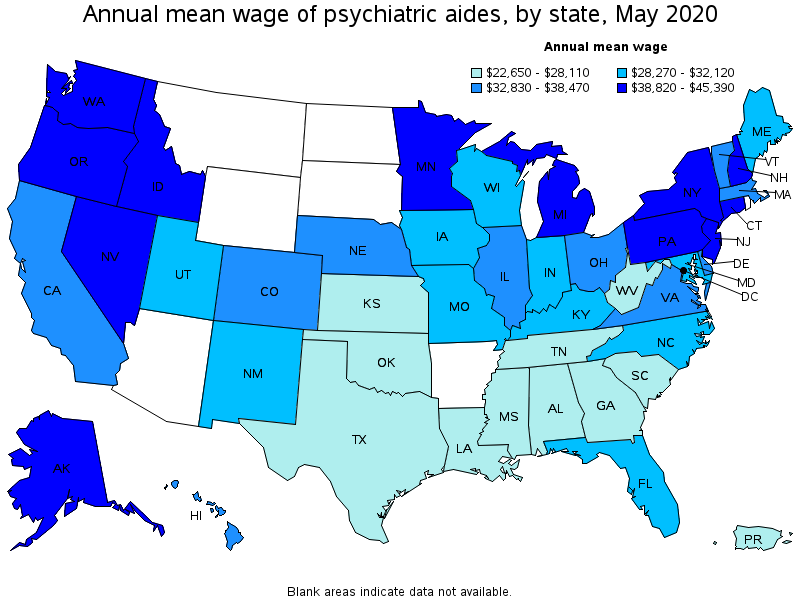
Top paying states for Psychiatric Aides:
| State | Employment (1) | Employment per thousand jobs | Location quotient (9) | Hourly mean wage | Annual mean wage (2) |
|---|---|---|---|---|---|
| New York | 5,420 | 0.62 | 1.68 | $ 21.82 | $ 45,390 |
| Washington | 370 | 0.12 | 0.32 | $ 21.41 | $ 44,540 |
| Connecticut | 660 | 0.43 | 1.16 | $ 21.03 | $ 43,740 |
| Oregon | 1,080 | 0.60 | 1.62 | $ 20.82 | $ 43,300 |
| Minnesota | 840 | 0.31 | 0.83 | $ 20.59 | $ 42,830 |
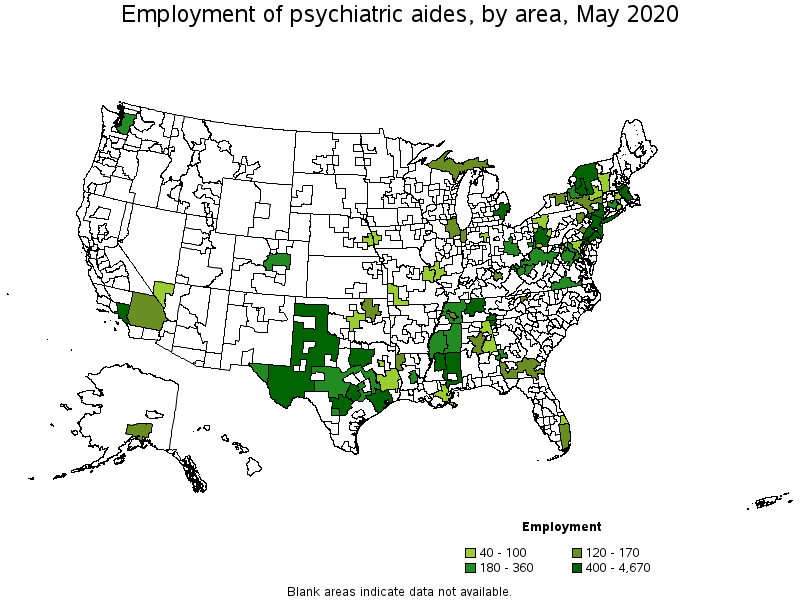
Metropolitan areas with the highest employment level in Psychiatric Aides:
| Metropolitan area | Employment (1) | Employment per thousand jobs | Location quotient (9) | Hourly mean wage | Annual mean wage (2) |
|---|---|---|---|---|---|
| New York-Newark-Jersey City, NY-NJ-PA | 4,670 | 0.53 | 1.43 | $ 20.81 | $ 43,270 |
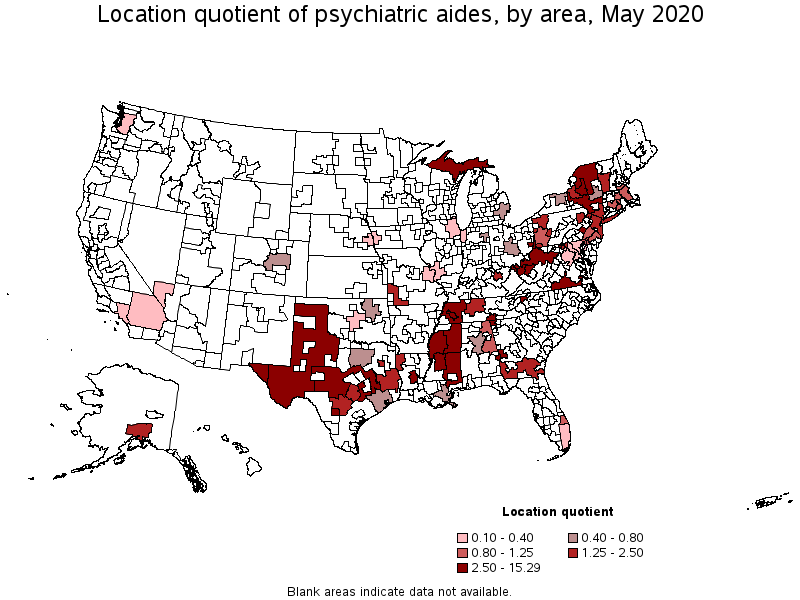
| Jackson, MS | 1,430 | 5.67 | 15.29 | $ 10.88 | $ 22,620 |
| Philadelphia-Camden-Wilmington, PA-NJ-DE-MD | 1,200 | 0.45 | 1.20 | $ 18.98 | $ 39,480 |
| San Antonio-New Braunfels, TX | 900 | 0.90 | 2.43 | $ 13.93 | $ 28,980 |
| Boston-Cambridge-Nashua, MA-NH | 790 | 0.30 | 0.82 | $ 18.01 | $ 37,470 |
| Nashville-Davidson--Murfreesboro--Franklin, TN | 690 | 0.72 | 1.94 | $ 13.46 | $ 28,000 |
| Austin-Round Rock, TX | 590 | 0.56 | 1.50 | $ 14.52 | $ 30,200 |
| Dallas-Fort Worth-Arlington, TX | 570 | 0.16 | 0.43 | $ 13.38 | $ 27,830 |
| Los Angeles-Long Beach-Anaheim, CA | 490 | 0.08 | 0.23 | $ 16.45 | $ 34,220 |
| Detroit-Warren-Dearborn, MI | 490 | 0.27 | 0.74 | $ 16.18 | $ 33,650 |
Metropolitan areas with the highest concentration of jobs and location quotients in Psychiatric Aides:
| Metropolitan area | Employment (1) | Employment per thousand jobs | Location quotient (9) | Hourly mean wage | Annual mean wage (2) |
|---|---|---|---|---|---|
| Jackson, MS | 1,430 | 5.67 | 15.29 | $ 10.88 | $ 22,620 |
| Wheeling, WV-OH | 250 | 4.37 | 11.79 | $ 11.06 | $ 23,000 |
| Alexandria, LA | 240 | 4.17 | 11.25 | $ 13.50 | $ 28,070 |
| Utica-Rome, NY | 410 | 3.56 | 9.59 | $ 24.47 | $ 50,890 |
| Huntington-Ashland, WV-KY-OH | 340 | 2.75 | 7.41 | $ 13.57 | $ 28,220 |
| Columbus, GA-AL | 260 | 2.32 | 6.27 | $ 11.91 | $ 24,770 |
| Jackson, TN | 130 | 2.02 | 5.44 | $ 10.31 | $ 21,440 |
| Johnson City, TN | 140 | 1.90 | 5.13 | $ 11.67 | $ 24,260 |
| Charleston, WV | 190 | 1.86 | 5.01 | $ 10.73 | $ 22,320 |
| Chattanooga, TN-GA | 400 | 1.64 | 4.42 | $ 12.33 | $ 25,650 |
Top paying metropolitan areas for Psychiatric Aides:
| Metropolitan area | Employment (1) | Employment per thousand jobs | Location quotient (9) | Hourly mean wage | Annual mean wage (2) |
|---|---|---|---|---|---|
| Utica-Rome, NY | 410 | 3.56 | 9.59 | $ 24.47 | $ 50,890 |
| Riverside-San Bernardino-Ontario, CA | 170 | 0.12 | 0.32 | $ 23.85 | $ 49,610 |
| Rochester, NY | 120 | 0.25 | 0.68 | $ 23.22 | $ 48,300 |
| Seattle-Tacoma-Bellevue, WA | 280 | 0.14 | 0.39 | $ 22.74 | $ 47,300 |
| Norwich-New London-Westerly, CT-RI | 40 | 0.35 | 0.94 | $ 22.64 | $ 47,090 |
| Las Vegas-Henderson-Paradise, NV | 100 | 0.11 | 0.28 | $ 21.69 | $ 45,120 |
| Washington-Arlington-Alexandria, DC-VA-MD-WV | 360 | 0.12 | 0.32 | $ 21.67 | $ 45,070 |
| New York-Newark-Jersey City, NY-NJ-PA | 4,670 | 0.53 | 1.43 | $ 20.81 | $ 43,270 |
| Bridgeport-Stamford-Norwalk, CT | (8) | (8) | (8) | $ 20.80 | $ 43,250 |
| Albany-Schenectady-Troy, NY | 90 | 0.21 | 0.57 | $ 20.68 | $ 43,000 |
Nonmetropolitan areas with the highest employment in Psychiatric Aides:
| Nonmetropolitan area | Employment (1) | Employment per thousand jobs | Location quotient (9) | Hourly mean wage | Annual mean wage (2) |
|---|---|---|---|---|---|
| West Texas Region of Texas nonmetropolitan area | 750 | 3.92 | 10.58 | $ 13.11 | $ 27,270 |
| Southeast Mississippi nonmetropolitan area | 740 | 5.05 | 13.63 | $ 11.06 | $ 23,000 |
| Capital/Northern New York nonmetropolitan area | 520 | 3.89 | 10.50 | $ 23.03 | $ 47,900 |
| Northeast Mississippi nonmetropolitan area | 320 | 1.45 | 3.90 | $ 10.78 | $ 22,420 |
| West Tennessee nonmetropolitan area | 220 | 1.79 | 4.84 | $ 13.32 | $ 27,700 |
Nonmetropolitan areas with the highest concentration of jobs and location quotients in Psychiatric Aides:
| Nonmetropolitan area | Employment (1) | Employment per thousand jobs | Location quotient (9) | Hourly mean wage | Annual mean wage (2) |
|---|---|---|---|---|---|
| Southeast Mississippi nonmetropolitan area | 740 | 5.05 | 13.63 | $ 11.06 | $ 23,000 |
| West Texas Region of Texas nonmetropolitan area | 750 | 3.92 | 10.58 | $ 13.11 | $ 27,270 |
| Capital/Northern New York nonmetropolitan area | 520 | 3.89 | 10.50 | $ 23.03 | $ 47,900 |
| Northwest Mississippi nonmetropolitan area | 180 | 1.98 | 5.34 | $ 10.53 | $ 21,900 |
| Southside Virginia nonmetropolitan area | 180 | 1.81 | 4.88 | $ 14.25 | $ 29,640 |
Top paying nonmetropolitan areas for Psychiatric Aides:
| Nonmetropolitan area | Employment (1) | Employment per thousand jobs | Location quotient (9) | Hourly mean wage | Annual mean wage (2) |
|---|---|---|---|---|---|
| Capital/Northern New York nonmetropolitan area | 520 | 3.89 | 10.50 | $ 23.03 | $ 47,900 |
| Central East New York nonmetropolitan area | 160 | 1.08 | 2.92 | $ 21.20 | $ 44,090 |
| Big Thicket Region of Texas nonmetropolitan area | 50 | 0.52 | 1.40 | $ 19.93 | $ 41,450 |
| Western Pennsylvania nonmetropolitan area | 100 | 0.73 | 1.98 | $ 19.33 | $ 40,200 |
| Upper Peninsula of Michigan nonmetropolitan area | 170 | 1.71 | 4.61 | $ 17.14 | $ 35,640 |
These estimates are calculated with data collected from employers in all industry sectors, all metropolitan and nonmetropolitan areas, and all states and the District of Columbia. The top employment and wage figures are provided above. The complete list is available in the downloadable XLS files.
The percentile wage estimate is the value of a wage below which a certain percent of workers fall. The median wage is the 50th percentile wage estimate—50 percent of workers earn less than the median and 50 percent of workers earn more than the median. More about percentile wages.
(1) Estimates for detailed occupations do not sum to the totals because the totals include occupations not shown separately. Estimates do not include self-employed workers.
(2) Annual wages have been calculated by multiplying the hourly mean wage by a "year-round, full-time" hours figure of 2,080 hours; for those occupations where there is not an hourly wage published, the annual wage has been directly calculated from the reported survey data.
(3) The relative standard error (RSE) is a measure of the reliability of a survey statistic. The smaller the relative standard error, the more precise the estimate.
(7) The value is less than .005 percent of industry employment.
(8) Estimate not released.
(9) The location quotient is the ratio of the area concentration of occupational employment to the national average concentration. A location quotient greater than one indicates the occupation has a higher share of employment than average, and a location quotient less than one indicates the occupation is less prevalent in the area than average.
Other OEWS estimates and related information:
May 2020 National Occupational Employment and Wage Estimates
May 2020 State Occupational Employment and Wage Estimates
May 2020 Metropolitan and Nonmetropolitan Area Occupational Employment and Wage Estimates
May 2020 National Industry-Specific Occupational Employment and Wage Estimates
Last Modified Date: March 31, 2021