
An official website of the United States government
An official website of the United States government
The .gov means it's official.
Federal government websites often end in .gov or .mil. Before sharing sensitive information,
make sure you're on a federal government site.
The site is secure.
The
https:// ensures that you are connecting to the official website and that any
information you provide is encrypted and transmitted securely.
Train animals for riding, harness, security, performance, or obedience, or for assisting persons with disabilities. Accustom animals to human voice and contact, and condition animals to respond to commands. Train animals according to prescribed standards for show or competition. May train animals to carry pack loads or work as part of pack team.
Employment estimate and mean wage estimates for Animal Trainers:
| Employment (1) | Employment RSE (3) |
Mean hourly wage |
Mean annual wage (2) |
Wage RSE (3) |
|---|---|---|---|---|
| 14,880 | 5.7 % | $ 18.25 | $ 37,950 | 2.1 % |
Percentile wage estimates for Animal Trainers:
| Percentile | 10% | 25% | 50% (Median) |
75% | 90% |
|---|---|---|---|---|---|
| Hourly Wage | $ 10.36 | $ 12.09 | $ 15.16 | $ 20.85 | $ 29.83 |
| Annual Wage (2) | $ 21,550 | $ 25,160 | $ 31,520 | $ 43,370 | $ 62,040 |
Industries with the highest published employment and wages for Animal Trainers are provided. For a list of all industries with employment in Animal Trainers, see the Create Customized Tables function.
Industries with the highest levels of employment in Animal Trainers:
| Industry | Employment (1) | Percent of industry employment | Hourly mean wage | Annual mean wage (2) |
|---|---|---|---|---|
| Other Personal Services | 4,790 | 1.62 | $ 18.97 | $ 39,460 |
| Other Miscellaneous Store Retailers | 2,970 | 0.89 | $ 13.32 | $ 27,710 |
| Spectator Sports | 1,810 | 1.65 | $ 21.47 | $ 44,670 |
| Support Activities for Animal Production | 1,780 | 5.60 | $ 21.34 | $ 44,380 |
| Museums, Historical Sites, and Similar Institutions | 750 | 0.52 | $ 19.34 | $ 40,240 |
Industries with the highest concentration of employment in Animal Trainers:
| Industry | Employment (1) | Percent of industry employment | Hourly mean wage | Annual mean wage (2) |
|---|---|---|---|---|
| Support Activities for Animal Production | 1,780 | 5.60 | $ 21.34 | $ 44,380 |
| Spectator Sports | 1,810 | 1.65 | $ 21.47 | $ 44,670 |
| Other Personal Services | 4,790 | 1.62 | $ 18.97 | $ 39,460 |
| Other Miscellaneous Store Retailers | 2,970 | 0.89 | $ 13.32 | $ 27,710 |
| Museums, Historical Sites, and Similar Institutions | 750 | 0.52 | $ 19.34 | $ 40,240 |
Top paying industries for Animal Trainers:
| Industry | Employment (1) | Percent of industry employment | Hourly mean wage | Annual mean wage (2) |
|---|---|---|---|---|
| Civic and Social Organizations | (8) | (8) | $ 29.96 | $ 62,330 |
| Local Government, excluding schools and hospitals (OEWS Designation) | 50 | (7) | $ 23.11 | $ 48,070 |
| Scientific Research and Development Services | 100 | 0.01 | $ 21.78 | $ 45,300 |
| Social Advocacy Organizations | 400 | 0.18 | $ 21.52 | $ 44,750 |
| Spectator Sports | 1,810 | 1.65 | $ 21.47 | $ 44,670 |
States and areas with the highest published employment, location quotients, and wages for Animal Trainers are provided. For a list of all areas with employment in Animal Trainers, see the Create Customized Tables function.
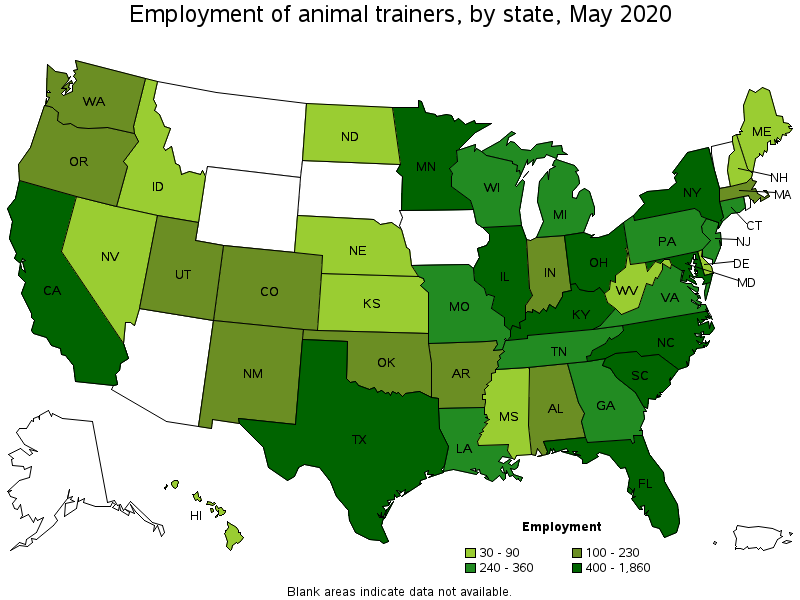
States with the highest employment level in Animal Trainers:
| State | Employment (1) | Employment per thousand jobs | Location quotient (9) | Hourly mean wage | Annual mean wage (2) |
|---|---|---|---|---|---|
| California | 1,860 | 0.11 | 1.06 | $ 21.92 | $ 45,590 |
| Florida | 1,350 | 0.16 | 1.49 | $ 19.12 | $ 39,770 |
| Texas | 950 | 0.08 | 0.73 | $ 15.66 | $ 32,570 |
| Illinois | 910 | 0.16 | 1.51 | $ 16.80 | $ 34,940 |
| New York | 770 | 0.09 | 0.82 | $ 28.83 | $ 59,970 |
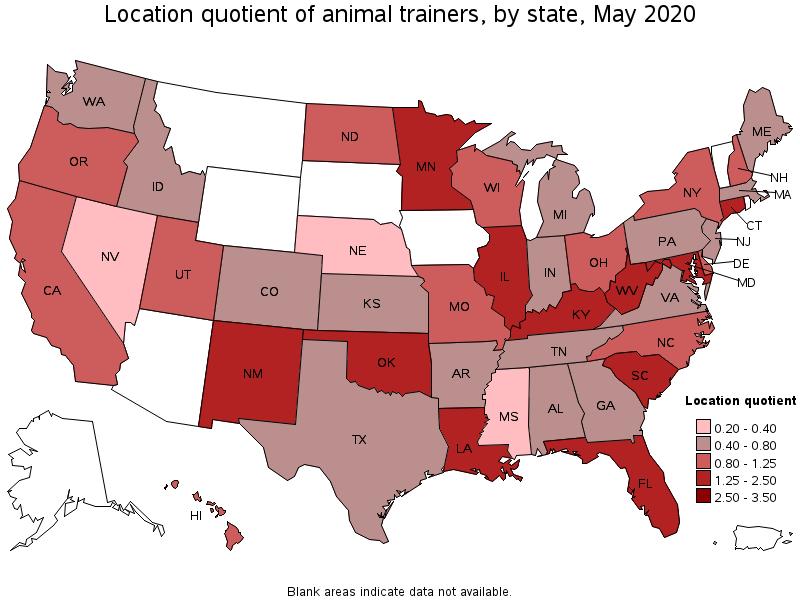
States with the highest concentration of jobs and location quotients in Animal Trainers:
| State | Employment (1) | Employment per thousand jobs | Location quotient (9) | Hourly mean wage | Annual mean wage (2) |
|---|---|---|---|---|---|
| Kentucky | 450 | 0.25 | 2.34 | $ 24.96 | $ 51,930 |
| South Carolina | 400 | 0.20 | 1.85 | $ 17.84 | $ 37,110 |
| Maryland | 470 | 0.19 | 1.74 | $ 16.53 | $ 34,390 |
| Connecticut | 270 | 0.17 | 1.64 | $ 18.24 | $ 37,940 |
| Louisiana | 300 | 0.17 | 1.57 | $ 14.47 | $ 30,110 |
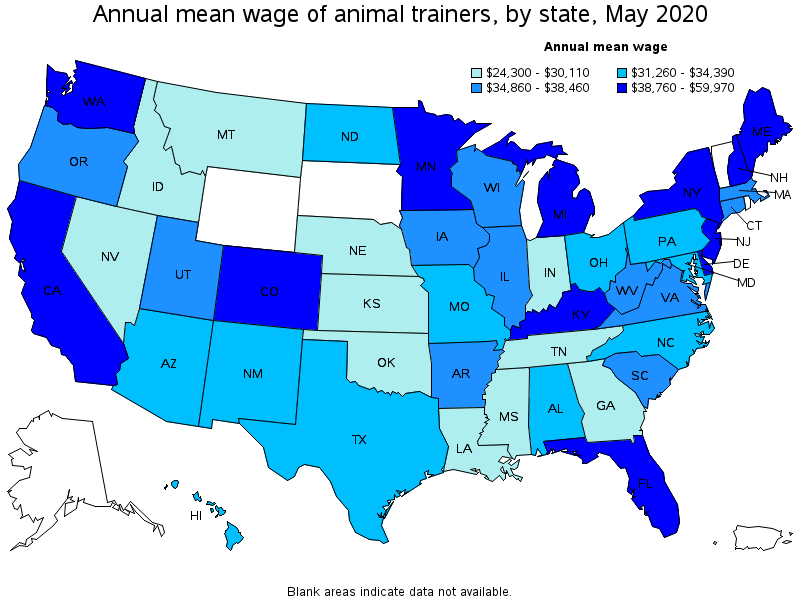
Top paying states for Animal Trainers:
| State | Employment (1) | Employment per thousand jobs | Location quotient (9) | Hourly mean wage | Annual mean wage (2) |
|---|---|---|---|---|---|
| New York | 770 | 0.09 | 0.82 | $ 28.83 | $ 59,970 |
| Kentucky | 450 | 0.25 | 2.34 | $ 24.96 | $ 51,930 |
| California | 1,860 | 0.11 | 1.06 | $ 21.92 | $ 45,590 |
| Washington | 230 | 0.07 | 0.68 | $ 21.05 | $ 43,790 |
| Maine | 40 | 0.08 | 0.71 | $ 19.85 | $ 41,290 |
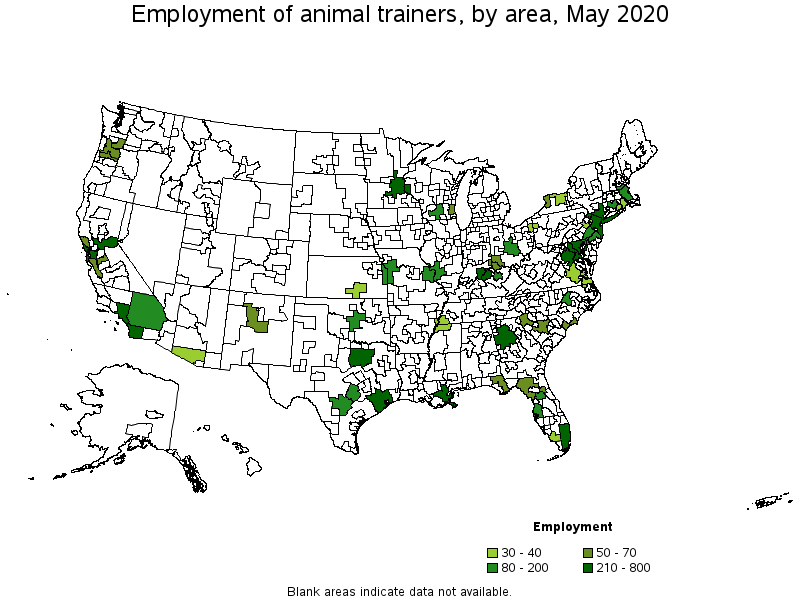
Metropolitan areas with the highest employment level in Animal Trainers:
| Metropolitan area | Employment (1) | Employment per thousand jobs | Location quotient (9) | Hourly mean wage | Annual mean wage (2) |
|---|---|---|---|---|---|
| New York-Newark-Jersey City, NY-NJ-PA | 800 | 0.09 | 0.85 | $ 27.59 | $ 57,390 |
| San Diego-Carlsbad, CA | 490 | 0.35 | 3.27 | $ 21.91 | $ 45,580 |
| Miami-Fort Lauderdale-West Palm Beach, FL | 420 | 0.17 | 1.57 | $ 23.85 | $ 49,610 |
| Los Angeles-Long Beach-Anaheim, CA | 390 | 0.07 | 0.63 | $ 26.27 | $ 54,640 |
| Baltimore-Columbia-Towson, MD | 310 | 0.24 | 2.25 | $ 15.30 | $ 31,830 |
| Dallas-Fort Worth-Arlington, TX | 300 | 0.08 | 0.79 | $ 15.67 | $ 32,600 |
| Atlanta-Sandy Springs-Roswell, GA | 290 | 0.11 | 1.03 | $ 12.20 | $ 25,380 |
| Minneapolis-St. Paul-Bloomington, MN-WI | 270 | 0.14 | 1.34 | $ 20.43 | $ 42,500 |
| Houston-The Woodlands-Sugar Land, TX | 250 | 0.08 | 0.78 | $ 15.55 | $ 32,350 |
| Sacramento--Roseville--Arden-Arcade, CA | 230 | 0.24 | 2.24 | $ 19.99 | $ 41,570 |
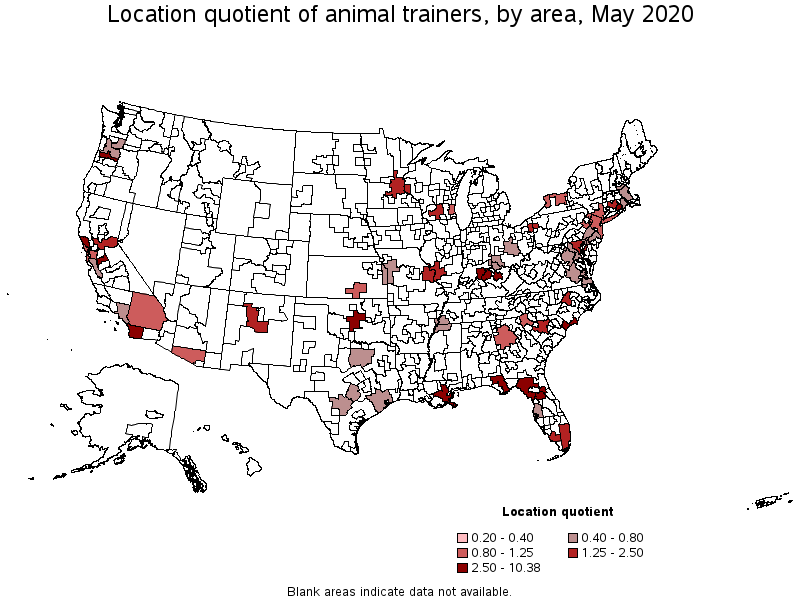
Metropolitan areas with the highest concentration of jobs and location quotients in Animal Trainers:
| Metropolitan area | Employment (1) | Employment per thousand jobs | Location quotient (9) | Hourly mean wage | Annual mean wage (2) |
|---|---|---|---|---|---|
| Ocala, FL | 110 | 1.11 | 10.38 | $ 20.40 | $ 42,440 |
| Lexington-Fayette, KY | 180 | 0.70 | 6.59 | $ 20.41 | $ 42,460 |
| New Orleans-Metairie, LA | 220 | 0.43 | 4.00 | $ 13.85 | $ 28,810 |
| Salem, OR | 60 | 0.38 | 3.53 | $ 14.08 | $ 29,280 |
| Louisville/Jefferson County, KY-IN | 220 | 0.37 | 3.42 | $ 29.85 | $ 62,090 |
| Norwich-New London-Westerly, CT-RI | 40 | 0.35 | 3.29 | $ 15.40 | $ 32,040 |
| San Diego-Carlsbad, CA | 490 | 0.35 | 3.27 | $ 21.91 | $ 45,580 |
| Modesto, CA | 60 | 0.33 | 3.06 | $ 21.49 | $ 44,710 |
| Myrtle Beach-Conway-North Myrtle Beach, SC-NC | 50 | 0.31 | 2.90 | $ 13.96 | $ 29,040 |
| Santa Rosa, CA | 60 | 0.31 | 2.86 | $ 21.21 | $ 44,120 |
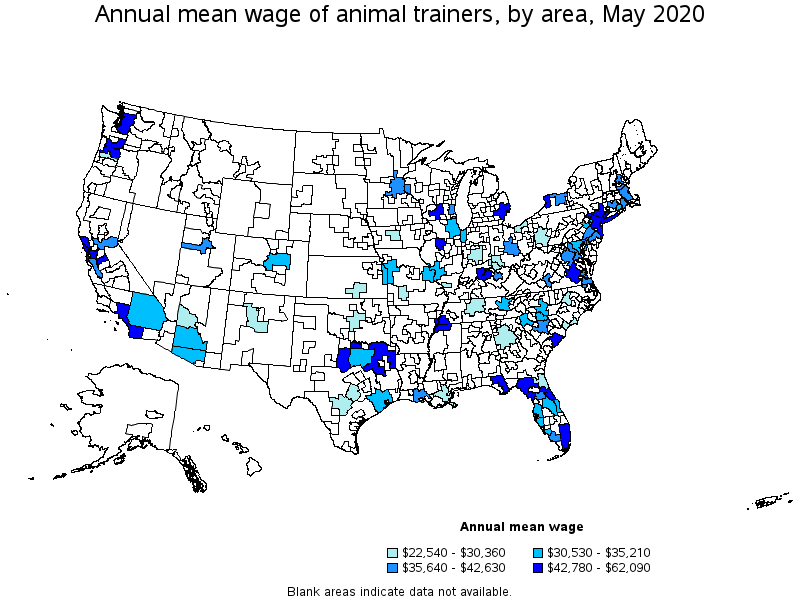
Top paying metropolitan areas for Animal Trainers:
| Metropolitan area | Employment (1) | Employment per thousand jobs | Location quotient (9) | Hourly mean wage | Annual mean wage (2) |
|---|---|---|---|---|---|
| Louisville/Jefferson County, KY-IN | 220 | 0.37 | 3.42 | $ 29.85 | $ 62,090 |
| New York-Newark-Jersey City, NY-NJ-PA | 800 | 0.09 | 0.85 | $ 27.59 | $ 57,390 |
| Los Angeles-Long Beach-Anaheim, CA | 390 | 0.07 | 0.63 | $ 26.27 | $ 54,640 |
| Memphis, TN-MS-AR | 40 | 0.06 | 0.55 | $ 25.73 | $ 53,520 |
| Peoria, IL | (8) | (8) | (8) | $ 24.95 | $ 51,900 |
| Portland-Vancouver-Hillsboro, OR-WA | 60 | 0.05 | 0.47 | $ 24.94 | $ 51,870 |
| Buffalo-Cheektowaga-Niagara Falls, NY | 60 | 0.12 | 1.09 | $ 24.49 | $ 50,940 |
| Miami-Fort Lauderdale-West Palm Beach, FL | 420 | 0.17 | 1.57 | $ 23.85 | $ 49,610 |
| San Francisco-Oakland-Hayward, CA | 210 | 0.09 | 0.84 | $ 23.31 | $ 48,480 |
| Detroit-Warren-Dearborn, MI | (8) | (8) | (8) | $ 23.13 | $ 48,110 |
Nonmetropolitan areas with the highest employment in Animal Trainers:
| Nonmetropolitan area | Employment (1) | Employment per thousand jobs | Location quotient (9) | Hourly mean wage | Annual mean wage (2) |
|---|---|---|---|---|---|
| North Florida nonmetropolitan area | 60 | 0.47 | 4.35 | $ 20.89 | $ 43,450 |
Nonmetropolitan areas with the highest concentration of jobs and location quotients in Animal Trainers:
| Nonmetropolitan area | Employment (1) | Employment per thousand jobs | Location quotient (9) | Hourly mean wage | Annual mean wage (2) |
|---|---|---|---|---|---|
| North Florida nonmetropolitan area | 60 | 0.47 | 4.35 | $ 20.89 | $ 43,450 |
Top paying nonmetropolitan areas for Animal Trainers:
| Nonmetropolitan area | Employment (1) | Employment per thousand jobs | Location quotient (9) | Hourly mean wage | Annual mean wage (2) |
|---|---|---|---|---|---|
| North Texas Region of Texas nonmetropolitan area | (8) | (8) | (8) | $ 25.92 | $ 53,920 |
| North Florida nonmetropolitan area | 60 | 0.47 | 4.35 | $ 20.89 | $ 43,450 |
| Central New Hampshire nonmetropolitan area | (8) | (8) | (8) | $ 17.55 | $ 36,510 |
These estimates are calculated with data collected from employers in all industry sectors, all metropolitan and nonmetropolitan areas, and all states and the District of Columbia. The top employment and wage figures are provided above. The complete list is available in the downloadable XLS files.
The percentile wage estimate is the value of a wage below which a certain percent of workers fall. The median wage is the 50th percentile wage estimate—50 percent of workers earn less than the median and 50 percent of workers earn more than the median. More about percentile wages.
(1) Estimates for detailed occupations do not sum to the totals because the totals include occupations not shown separately. Estimates do not include self-employed workers.
(2) Annual wages have been calculated by multiplying the hourly mean wage by a "year-round, full-time" hours figure of 2,080 hours; for those occupations where there is not an hourly wage published, the annual wage has been directly calculated from the reported survey data.
(3) The relative standard error (RSE) is a measure of the reliability of a survey statistic. The smaller the relative standard error, the more precise the estimate.
(7) The value is less than .005 percent of industry employment.
(8) Estimate not released.
(9) The location quotient is the ratio of the area concentration of occupational employment to the national average concentration. A location quotient greater than one indicates the occupation has a higher share of employment than average, and a location quotient less than one indicates the occupation is less prevalent in the area than average.
Other OEWS estimates and related information:
May 2020 National Occupational Employment and Wage Estimates
May 2020 State Occupational Employment and Wage Estimates
May 2020 Metropolitan and Nonmetropolitan Area Occupational Employment and Wage Estimates
May 2020 National Industry-Specific Occupational Employment and Wage Estimates
Last Modified Date: March 31, 2021