
An official website of the United States government
An official website of the United States government
The .gov means it's official.
Federal government websites often end in .gov or .mil. Before sharing sensitive information,
make sure you're on a federal government site.
The site is secure.
The
https:// ensures that you are connecting to the official website and that any
information you provide is encrypted and transmitted securely.
Receive and pay out money. Keep records of money and negotiable instruments involved in a financial institution's various transactions.
Employment estimate and mean wage estimates for Tellers:
| Employment (1) | Employment RSE (3) |
Mean hourly wage |
Mean annual wage (2) |
Wage RSE (3) |
|---|---|---|---|---|
| 423,570 | 0.9 % | $ 15.85 | $ 32,960 | 0.3 % |
Percentile wage estimates for Tellers:
| Percentile | 10% | 25% | 50% (Median) |
75% | 90% |
|---|---|---|---|---|---|
| Hourly Wage | $ 11.86 | $ 13.50 | $ 15.68 | $ 18.17 | $ 19.82 |
| Annual Wage (2) | $ 24,660 | $ 28,080 | $ 32,620 | $ 37,780 | $ 41,220 |
Industries with the highest published employment and wages for Tellers are provided. For a list of all industries with employment in Tellers, see the Create Customized Tables function.
Industries with the highest levels of employment in Tellers:
| Industry | Employment (1) | Percent of industry employment | Hourly mean wage | Annual mean wage (2) |
|---|---|---|---|---|
| Credit Intermediation and Related Activities (5221 and 5223 only) | 401,800 | 19.80 | $ 15.83 | $ 32,930 |
| Nondepository Credit Intermediation | 7,780 | 1.35 | $ 14.84 | $ 30,870 |
| Management of Companies and Enterprises | 4,760 | 0.20 | $ 16.84 | $ 35,020 |
| Securities, Commodity Contracts, and Other Financial Investments and Related Activities | 4,490 | 0.48 | $ 17.24 | $ 35,870 |
| Investigation and Security Services | 1,670 | 0.18 | $ 15.56 | $ 32,370 |
Industries with the highest concentration of employment in Tellers:
| Industry | Employment (1) | Percent of industry employment | Hourly mean wage | Annual mean wage (2) |
|---|---|---|---|---|
| Credit Intermediation and Related Activities (5221 and 5223 only) | 401,800 | 19.80 | $ 15.83 | $ 32,930 |
| Monetary Authorities-Central Bank | 350 | 1.77 | $ 18.54 | $ 38,560 |
| Nondepository Credit Intermediation | 7,780 | 1.35 | $ 14.84 | $ 30,870 |
| Securities, Commodity Contracts, and Other Financial Investments and Related Activities | 4,490 | 0.48 | $ 17.24 | $ 35,870 |
| Spectator Sports | 430 | 0.39 | $ 17.62 | $ 36,640 |
Top paying industries for Tellers:
| Industry | Employment (1) | Percent of industry employment | Hourly mean wage | Annual mean wage (2) |
|---|---|---|---|---|
| Local Government, excluding schools and hospitals (OEWS Designation) | 180 | (7) | $ 18.62 | $ 38,720 |
| Monetary Authorities-Central Bank | 350 | 1.77 | $ 18.54 | $ 38,560 |
| Spectator Sports | 430 | 0.39 | $ 17.62 | $ 36,640 |
| Agencies, Brokerages, and Other Insurance Related Activities | 230 | 0.02 | $ 17.58 | $ 36,560 |
| Securities, Commodity Contracts, and Other Financial Investments and Related Activities | 4,490 | 0.48 | $ 17.24 | $ 35,870 |
States and areas with the highest published employment, location quotients, and wages for Tellers are provided. For a list of all areas with employment in Tellers, see the Create Customized Tables function.
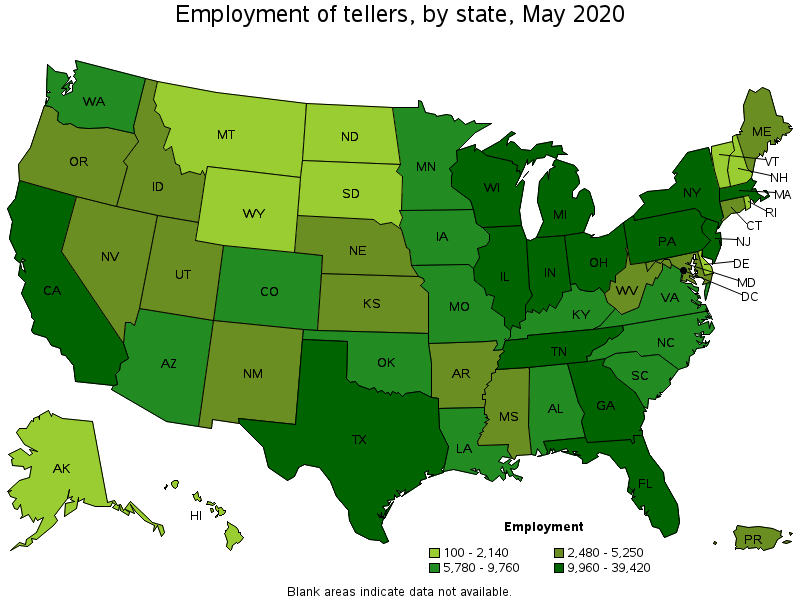
States with the highest employment level in Tellers:
| State | Employment (1) | Employment per thousand jobs | Location quotient (9) | Hourly mean wage | Annual mean wage (2) |
|---|---|---|---|---|---|
| California | 39,420 | 2.40 | 0.79 | $ 17.44 | $ 36,280 |
| Texas | 36,460 | 3.01 | 0.99 | $ 14.90 | $ 30,980 |
| Florida | 24,010 | 2.84 | 0.93 | $ 16.83 | $ 35,000 |
| New York | 22,850 | 2.63 | 0.86 | $ 16.79 | $ 34,920 |
| Pennsylvania | 19,340 | 3.51 | 1.15 | $ 15.40 | $ 32,030 |
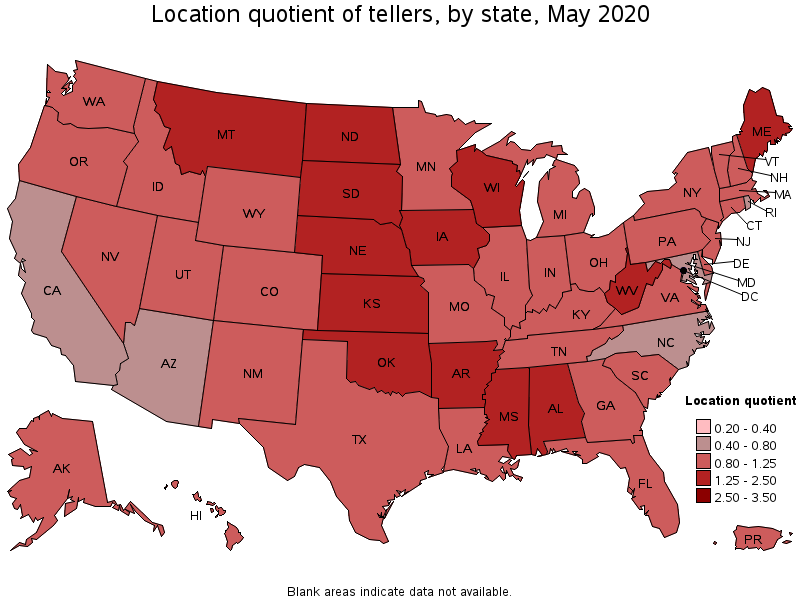
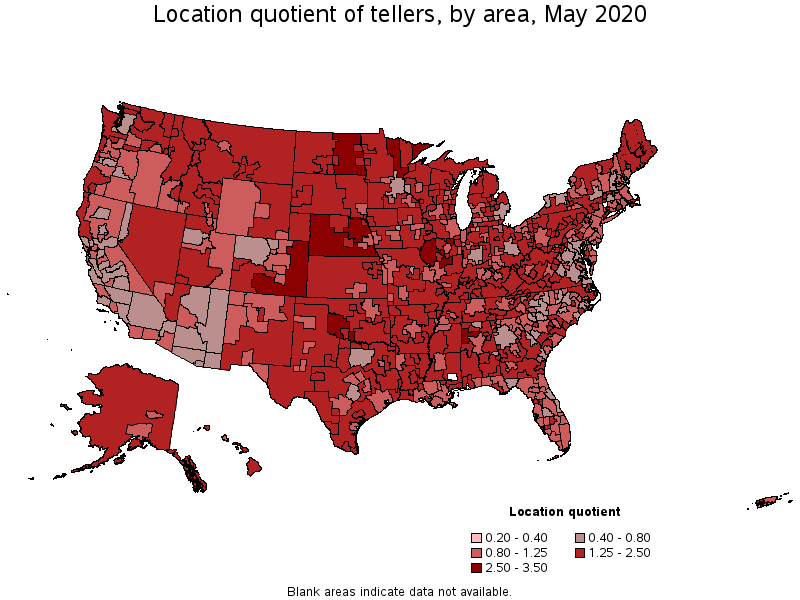
States with the highest concentration of jobs and location quotients in Tellers:
| State | Employment (1) | Employment per thousand jobs | Location quotient (9) | Hourly mean wage | Annual mean wage (2) |
|---|---|---|---|---|---|
| North Dakota | 2,140 | 5.36 | 1.76 | $ 16.19 | $ 33,680 |
| West Virginia | 3,280 | 5.04 | 1.65 | $ 13.86 | $ 28,820 |
| Oklahoma | 7,210 | 4.61 | 1.51 | $ 12.97 | $ 26,970 |
| Montana | 2,040 | 4.49 | 1.47 | $ 15.02 | $ 31,250 |
| Nebraska | 4,170 | 4.43 | 1.45 | $ 14.87 | $ 30,940 |
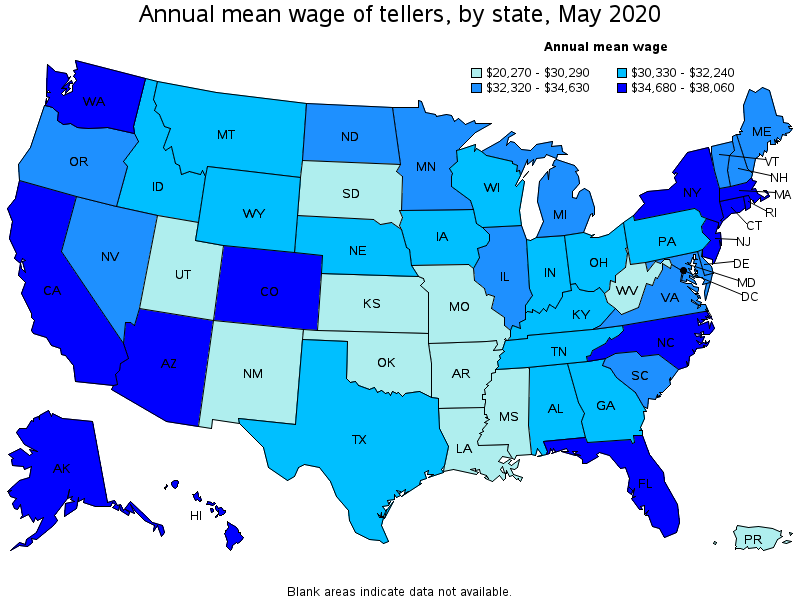
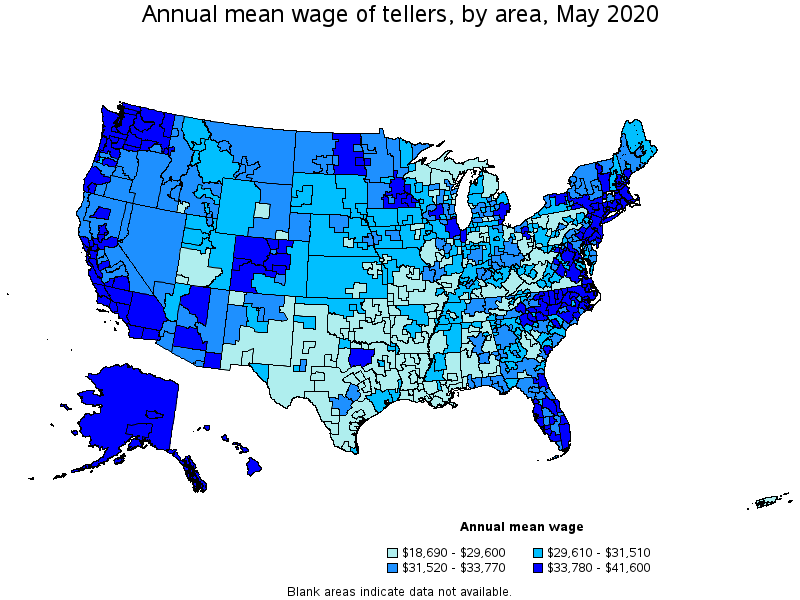
Top paying states for Tellers:
| State | Employment (1) | Employment per thousand jobs | Location quotient (9) | Hourly mean wage | Annual mean wage (2) |
|---|---|---|---|---|---|
| District of Columbia | 840 | 1.22 | 0.40 | $ 18.30 | $ 38,060 |
| Rhode Island | 1,000 | 2.25 | 0.74 | $ 18.24 | $ 37,940 |
| Washington | 9,280 | 2.91 | 0.95 | $ 17.66 | $ 36,740 |
| Massachusetts | 9,960 | 2.97 | 0.98 | $ 17.51 | $ 36,420 |
| Hawaii | 2,010 | 3.51 | 1.15 | $ 17.49 | $ 36,380 |
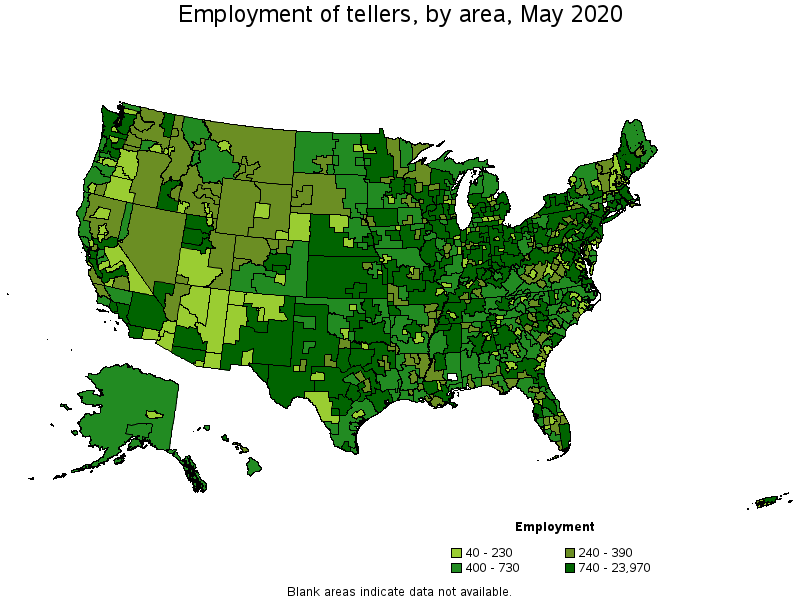
Metropolitan areas with the highest employment level in Tellers:
| Metropolitan area | Employment (1) | Employment per thousand jobs | Location quotient (9) | Hourly mean wage | Annual mean wage (2) |
|---|---|---|---|---|---|
| New York-Newark-Jersey City, NY-NJ-PA | 23,970 | 2.71 | 0.89 | $ 17.19 | $ 35,750 |
| Los Angeles-Long Beach-Anaheim, CA | 13,560 | 2.33 | 0.76 | $ 16.97 | $ 35,300 |
| Chicago-Naperville-Elgin, IL-IN-WI | 12,040 | 2.76 | 0.91 | $ 16.84 | $ 35,020 |
| Houston-The Woodlands-Sugar Land, TX | 8,360 | 2.81 | 0.92 | $ 15.03 | $ 31,260 |
| Philadelphia-Camden-Wilmington, PA-NJ-DE-MD | 8,280 | 3.07 | 1.01 | $ 16.28 | $ 33,870 |
| Dallas-Fort Worth-Arlington, TX | 8,180 | 2.28 | 0.75 | $ 16.32 | $ 33,950 |
| Miami-Fort Lauderdale-West Palm Beach, FL | 7,530 | 3.00 | 0.99 | $ 16.34 | $ 34,000 |
| Boston-Cambridge-Nashua, MA-NH | 7,520 | 2.89 | 0.95 | $ 17.42 | $ 36,230 |
| San Francisco-Oakland-Hayward, CA | 6,940 | 2.98 | 0.98 | $ 17.90 | $ 37,230 |
| Atlanta-Sandy Springs-Roswell, GA | 6,040 | 2.29 | 0.75 | $ 16.04 | $ 33,350 |
Metropolitan areas with the highest concentration of jobs and location quotients in Tellers:
| Metropolitan area | Employment (1) | Employment per thousand jobs | Location quotient (9) | Hourly mean wage | Annual mean wage (2) |
|---|---|---|---|---|---|
| Niles-Benton Harbor, MI | 430 | 7.89 | 2.59 | $ 14.63 | $ 30,430 |
| Bloomsburg-Berwick, PA | 290 | 7.50 | 2.46 | $ 15.13 | $ 31,460 |
| Parkersburg-Vienna, WV | 250 | 7.30 | 2.40 | $ 12.71 | $ 26,430 |
| Texarkana, TX-AR | 390 | 7.12 | 2.34 | $ 14.62 | $ 30,410 |
| Johnstown, PA | 330 | 7.05 | 2.32 | $ 15.03 | $ 31,270 |
| Wichita Falls, TX | 380 | 7.03 | 2.31 | $ 15.08 | $ 31,370 |
| Sheboygan, WI | 380 | 6.66 | 2.19 | $ 13.99 | $ 29,090 |
| Manhattan, KS | 240 | 6.58 | 2.16 | $ 13.01 | $ 27,060 |
| Ocean City, NJ | 230 | 6.58 | 2.16 | $ 16.31 | $ 33,920 |
| Victoria, TX | 230 | 6.36 | 2.09 | $ 13.45 | $ 27,980 |
Top paying metropolitan areas for Tellers:
| Metropolitan area | Employment (1) | Employment per thousand jobs | Location quotient (9) | Hourly mean wage | Annual mean wage (2) |
|---|---|---|---|---|---|
| San Jose-Sunnyvale-Santa Clara, CA | 1,650 | 1.50 | 0.49 | $ 20.00 | $ 41,600 |
| Tampa-St. Petersburg-Clearwater, FL | 3,310 | 2.54 | 0.83 | $ 18.64 | $ 38,770 |
| Redding, CA | 140 | 2.22 | 0.73 | $ 18.52 | $ 38,530 |
| Vallejo-Fairfield, CA | 380 | 2.90 | 0.95 | $ 18.45 | $ 38,380 |
| Seattle-Tacoma-Bellevue, WA | 3,790 | 1.94 | 0.64 | $ 18.43 | $ 38,320 |
| Santa Maria-Santa Barbara, CA | 430 | 2.37 | 0.78 | $ 18.39 | $ 38,240 |
| Longview, WA | 180 | 5.01 | 1.64 | $ 18.37 | $ 38,210 |
| Bremerton-Silverdale, WA | 320 | 3.65 | 1.20 | $ 18.10 | $ 37,640 |
| Washington-Arlington-Alexandria, DC-VA-MD-WV | 5,680 | 1.88 | 0.62 | $ 18.02 | $ 37,470 |
| San Luis Obispo-Paso Robles-Arroyo Grande, CA | 350 | 3.27 | 1.07 | $ 18.00 | $ 37,440 |
Nonmetropolitan areas with the highest employment in Tellers:
| Nonmetropolitan area | Employment (1) | Employment per thousand jobs | Location quotient (9) | Hourly mean wage | Annual mean wage (2) |
|---|---|---|---|---|---|
| Kansas nonmetropolitan area | 2,100 | 5.55 | 1.82 | $ 14.73 | $ 30,630 |
| North Northeastern Ohio nonmetropolitan area (noncontiguous) | 1,470 | 4.71 | 1.55 | $ 14.17 | $ 29,470 |
| North Texas Region of Texas nonmetropolitan area | 1,420 | 5.29 | 1.74 | $ 13.63 | $ 28,350 |
| West Central Illinois nonmetropolitan area | 1,340 | 8.17 | 2.68 | $ 13.93 | $ 28,970 |
| Southern Pennsylvania nonmetropolitan area | 1,220 | 6.79 | 2.23 | $ 13.87 | $ 28,850 |
Nonmetropolitan areas with the highest concentration of jobs and location quotients in Tellers:
| Nonmetropolitan area | Employment (1) | Employment per thousand jobs | Location quotient (9) | Hourly mean wage | Annual mean wage (2) |
|---|---|---|---|---|---|
| Southwest Oklahoma nonmetropolitan area | 570 | 9.54 | 3.13 | $ 12.28 | $ 25,540 |
| Eastern and Southern Colorado nonmetropolitan area | 580 | 8.78 | 2.88 | $ 14.24 | $ 29,620 |
| East North Dakota nonmetropolitan area | 530 | 8.71 | 2.86 | $ 16.34 | $ 33,990 |
| West Central Illinois nonmetropolitan area | 1,340 | 8.17 | 2.68 | $ 13.93 | $ 28,970 |
| Northeast Minnesota nonmetropolitan area | 320 | 8.11 | 2.66 | $ 15.77 | $ 32,810 |
Top paying nonmetropolitan areas for Tellers:
| Nonmetropolitan area | Employment (1) | Employment per thousand jobs | Location quotient (9) | Hourly mean wage | Annual mean wage (2) |
|---|---|---|---|---|---|
| Alaska nonmetropolitan area | 410 | 4.13 | 1.36 | $ 17.98 | $ 37,390 |
| Connecticut nonmetropolitan area | (8) | (8) | (8) | $ 17.21 | $ 35,800 |
| Hawaii / Kauai nonmetropolitan area | 440 | 4.71 | 1.55 | $ 17.14 | $ 35,650 |
| Coast Oregon nonmetropolitan area | 420 | 3.95 | 1.30 | $ 17.09 | $ 35,550 |
| Southeast Minnesota nonmetropolitan area | 660 | 4.47 | 1.47 | $ 16.82 | $ 34,980 |
These estimates are calculated with data collected from employers in all industry sectors, all metropolitan and nonmetropolitan areas, and all states and the District of Columbia. The top employment and wage figures are provided above. The complete list is available in the downloadable XLS files.
The percentile wage estimate is the value of a wage below which a certain percent of workers fall. The median wage is the 50th percentile wage estimate—50 percent of workers earn less than the median and 50 percent of workers earn more than the median. More about percentile wages.
(1) Estimates for detailed occupations do not sum to the totals because the totals include occupations not shown separately. Estimates do not include self-employed workers.
(2) Annual wages have been calculated by multiplying the hourly mean wage by a "year-round, full-time" hours figure of 2,080 hours; for those occupations where there is not an hourly wage published, the annual wage has been directly calculated from the reported survey data.
(3) The relative standard error (RSE) is a measure of the reliability of a survey statistic. The smaller the relative standard error, the more precise the estimate.
(7) The value is less than .005 percent of industry employment.
(8) Estimate not released.
(9) The location quotient is the ratio of the area concentration of occupational employment to the national average concentration. A location quotient greater than one indicates the occupation has a higher share of employment than average, and a location quotient less than one indicates the occupation is less prevalent in the area than average.
Other OEWS estimates and related information:
May 2020 National Occupational Employment and Wage Estimates
May 2020 State Occupational Employment and Wage Estimates
May 2020 Metropolitan and Nonmetropolitan Area Occupational Employment and Wage Estimates
May 2020 National Industry-Specific Occupational Employment and Wage Estimates
Last Modified Date: March 31, 2021