
An official website of the United States government
An official website of the United States government
The .gov means it's official.
Federal government websites often end in .gov or .mil. Before sharing sensitive information,
make sure you're on a federal government site.
The site is secure.
The
https:// ensures that you are connecting to the official website and that any
information you provide is encrypted and transmitted securely.
All information and record clerks not listed separately.
Employment estimate and mean wage estimates for Information and Record Clerks, All Other:
| Employment (1) | Employment RSE (3) |
Mean hourly wage |
Mean annual wage (2) |
Wage RSE (3) |
|---|---|---|---|---|
| 148,870 | 1.0 % | $ 21.10 | $ 43,880 | 0.4 % |
Percentile wage estimates for Information and Record Clerks, All Other:
| Percentile | 10% | 25% | 50% (Median) |
75% | 90% |
|---|---|---|---|---|---|
| Hourly Wage | $ 13.06 | $ 16.13 | $ 20.59 | $ 25.06 | $ 29.93 |
| Annual Wage (2) | $ 27,170 | $ 33,550 | $ 42,820 | $ 52,120 | $ 62,260 |
Industries with the highest published employment and wages for Information and Record Clerks, All Other are provided. For a list of all industries with employment in Information and Record Clerks, All Other, see the Create Customized Tables function.
Industries with the highest levels of employment in Information and Record Clerks, All Other:
| Industry | Employment (1) | Percent of industry employment | Hourly mean wage | Annual mean wage (2) |
|---|---|---|---|---|
| Federal Executive Branch (OEWS Designation) | 54,200 | 2.60 | $ 22.33 | $ 46,450 |
| Local Government, excluding schools and hospitals (OEWS Designation) | 20,060 | 0.37 | $ 18.25 | $ 37,970 |
| Elementary and Secondary Schools | 12,260 | 0.15 | $ 19.45 | $ 40,450 |
| Colleges, Universities, and Professional Schools | 7,150 | 0.24 | $ 22.26 | $ 46,310 |
| State Government, excluding schools and hospitals (OEWS Designation) | 4,280 | 0.19 | $ 23.45 | $ 48,770 |
Industries with the highest concentration of employment in Information and Record Clerks, All Other:
| Industry | Employment (1) | Percent of industry employment | Hourly mean wage | Annual mean wage (2) |
|---|---|---|---|---|
| Federal Executive Branch (OEWS Designation) | 54,200 | 2.60 | $ 22.33 | $ 46,450 |
| Technical and Trade Schools | 860 | 0.69 | $ 23.26 | $ 48,380 |
| Junior Colleges | 3,470 | 0.51 | $ 19.74 | $ 41,060 |
| Business Schools and Computer and Management Training | 260 | 0.37 | $ 24.15 | $ 50,240 |
| Educational Support Services | 690 | 0.37 | $ 21.17 | $ 44,040 |
Top paying industries for Information and Record Clerks, All Other:
| Industry | Employment (1) | Percent of industry employment | Hourly mean wage | Annual mean wage (2) |
|---|---|---|---|---|
| Postal Service (federal government) | 100 | 0.02 | $ 30.71 | $ 63,880 |
| Deep Sea, Coastal, and Great Lakes Water Transportation | 110 | 0.31 | $ 28.31 | $ 58,890 |
| Telecommunications | 310 | 0.04 | $ 27.85 | $ 57,920 |
| Electric Power Generation, Transmission and Distribution | 250 | 0.06 | $ 26.71 | $ 55,550 |
| Cable and Other Subscription Programming | 30 | 0.06 | $ 26.32 | $ 54,740 |
States and areas with the highest published employment, location quotients, and wages for Information and Record Clerks, All Other are provided. For a list of all areas with employment in Information and Record Clerks, All Other, see the Create Customized Tables function.
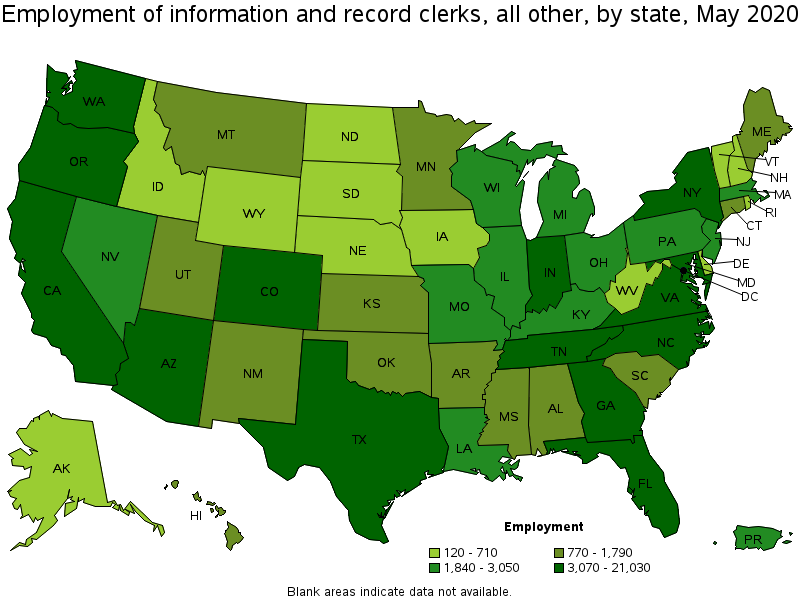
States with the highest employment level in Information and Record Clerks, All Other:
| State | Employment (1) | Employment per thousand jobs | Location quotient (9) | Hourly mean wage | Annual mean wage (2) |
|---|---|---|---|---|---|
| California | 21,030 | 1.28 | 1.20 | $ 23.71 | $ 49,320 |
| Texas | 17,200 | 1.42 | 1.33 | $ 18.02 | $ 37,480 |
| Colorado | 11,620 | 4.51 | 4.21 | $ 22.71 | $ 47,240 |
| Florida | 7,640 | 0.91 | 0.85 | $ 20.37 | $ 42,360 |
| Oregon | 5,420 | 3.00 | 2.80 | $ 18.11 | $ 37,660 |
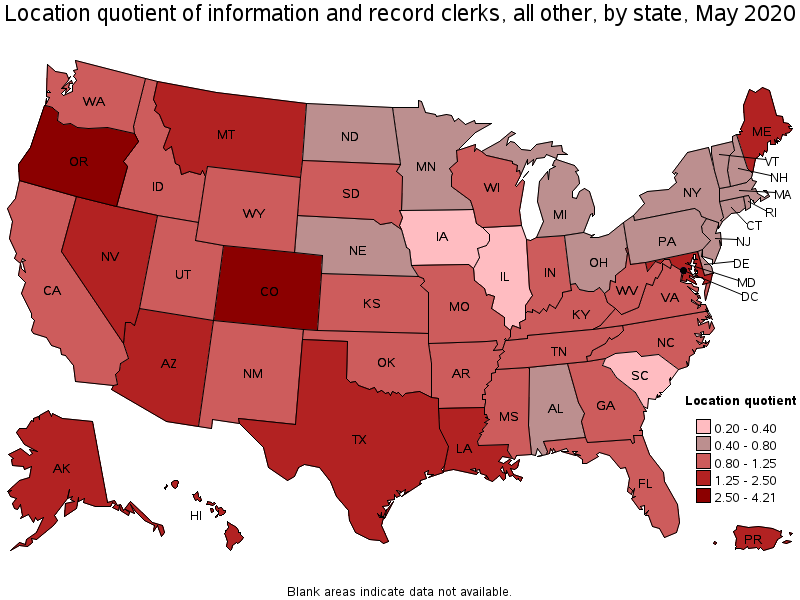
States with the highest concentration of jobs and location quotients in Information and Record Clerks, All Other:
| State | Employment (1) | Employment per thousand jobs | Location quotient (9) | Hourly mean wage | Annual mean wage (2) |
|---|---|---|---|---|---|
| Colorado | 11,620 | 4.51 | 4.21 | $ 22.71 | $ 47,240 |
| Oregon | 5,420 | 3.00 | 2.80 | $ 18.11 | $ 37,660 |
| District of Columbia | 1,850 | 2.69 | 2.52 | $ 29.61 | $ 61,590 |
| Montana | 1,120 | 2.46 | 2.30 | $ 18.80 | $ 39,110 |
| Nevada | 3,010 | 2.40 | 2.25 | $ 17.08 | $ 35,530 |
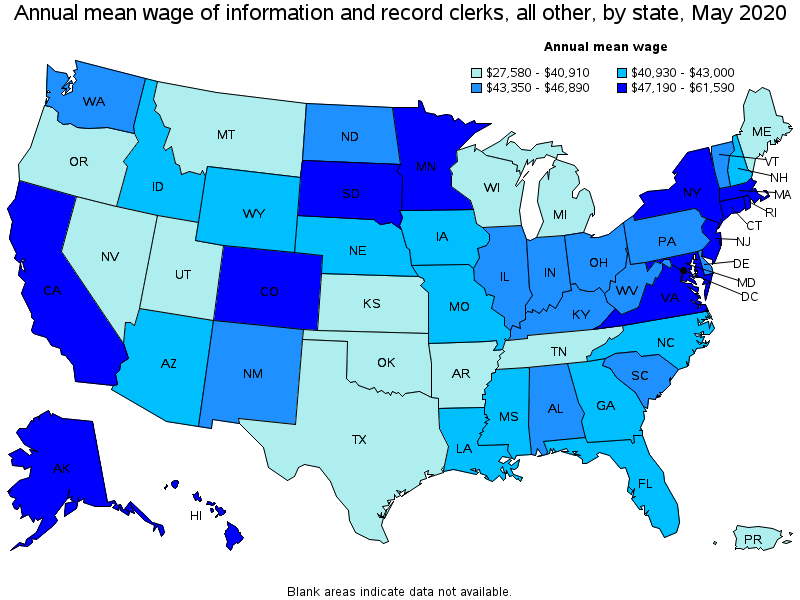
Top paying states for Information and Record Clerks, All Other:
| State | Employment (1) | Employment per thousand jobs | Location quotient (9) | Hourly mean wage | Annual mean wage (2) |
|---|---|---|---|---|---|
| District of Columbia | 1,850 | 2.69 | 2.52 | $ 29.61 | $ 61,590 |
| Maryland | 3,430 | 1.36 | 1.27 | $ 25.61 | $ 53,260 |
| New Jersey | 3,050 | 0.81 | 0.75 | $ 24.09 | $ 50,110 |
| Connecticut | 1,000 | 0.65 | 0.60 | $ 23.97 | $ 49,870 |
| South Dakota | 370 | 0.89 | 0.84 | $ 23.98 | $ 49,870 |
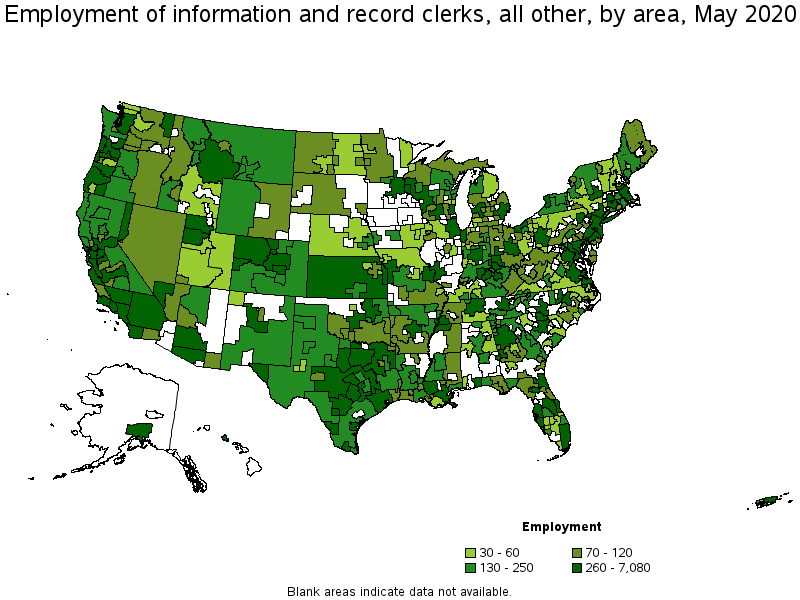
Metropolitan areas with the highest employment level in Information and Record Clerks, All Other:
| Metropolitan area | Employment (1) | Employment per thousand jobs | Location quotient (9) | Hourly mean wage | Annual mean wage (2) |
|---|---|---|---|---|---|
| Denver-Aurora-Lakewood, CO | 7,080 | 4.86 | 4.54 | $ 23.72 | $ 49,330 |
| Los Angeles-Long Beach-Anaheim, CA | 5,780 | 0.99 | 0.93 | $ 23.93 | $ 49,770 |
| Washington-Arlington-Alexandria, DC-VA-MD-WV | 5,560 | 1.84 | 1.72 | $ 27.38 | $ 56,950 |
| New York-Newark-Jersey City, NY-NJ-PA | 4,460 | 0.51 | 0.47 | $ 24.58 | $ 51,130 |
| Dallas-Fort Worth-Arlington, TX | 4,270 | 1.19 | 1.11 | $ 19.72 | $ 41,020 |
| Portland-Vancouver-Hillsboro, OR-WA | 3,520 | 3.08 | 2.88 | $ 18.41 | $ 38,290 |
| Houston-The Woodlands-Sugar Land, TX | 3,190 | 1.07 | 1.00 | $ 19.02 | $ 39,550 |
| San Diego-Carlsbad, CA | 2,740 | 1.96 | 1.83 | $ 20.46 | $ 42,550 |
| Phoenix-Mesa-Scottsdale, AZ | 2,610 | 1.24 | 1.16 | $ 20.43 | $ 42,500 |
| Atlanta-Sandy Springs-Roswell, GA | 2,490 | 0.95 | 0.88 | $ 19.63 | $ 40,830 |
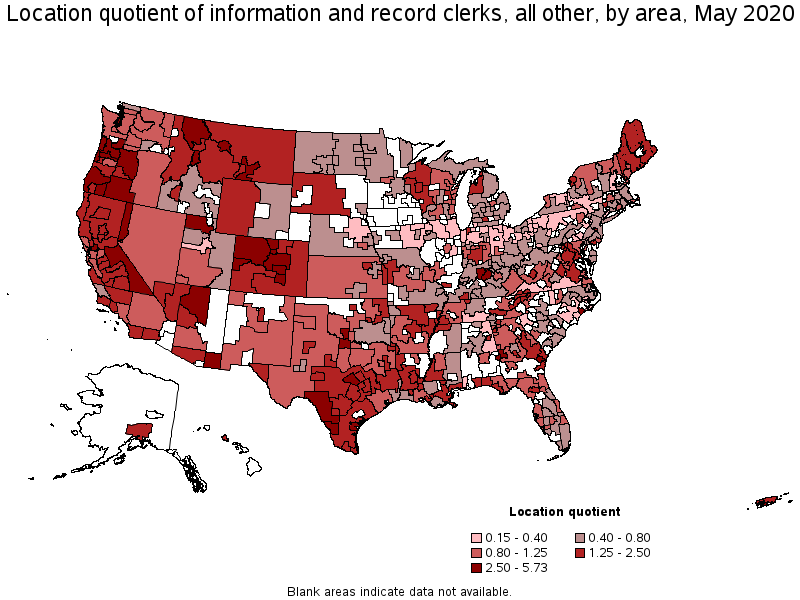
Metropolitan areas with the highest concentration of jobs and location quotients in Information and Record Clerks, All Other:
| Metropolitan area | Employment (1) | Employment per thousand jobs | Location quotient (9) | Hourly mean wage | Annual mean wage (2) |
|---|---|---|---|---|---|
| Fort Collins, CO | 960 | 6.13 | 5.73 | $ 22.12 | $ 46,000 |
| Hinesville, GA | 100 | 5.89 | 5.50 | $ 22.49 | $ 46,780 |
| Corpus Christi, TX | 960 | 5.32 | 4.97 | $ 14.39 | $ 29,930 |
| Colorado Springs, CO | 1,360 | 4.87 | 4.55 | $ 20.04 | $ 41,670 |
| Denver-Aurora-Lakewood, CO | 7,080 | 4.86 | 4.54 | $ 23.72 | $ 49,330 |
| Grand Junction, CO | 260 | 4.35 | 4.07 | $ 20.41 | $ 42,450 |
| Medford, OR | 340 | 4.05 | 3.78 | $ 17.38 | $ 36,150 |
| Pueblo, CO | 230 | 3.94 | 3.68 | $ 19.93 | $ 41,450 |
| Ogden-Clearfield, UT | 1,000 | 3.84 | 3.59 | $ 17.71 | $ 36,840 |
| Boulder, CO | 690 | 3.81 | 3.56 | $ 23.13 | $ 48,110 |
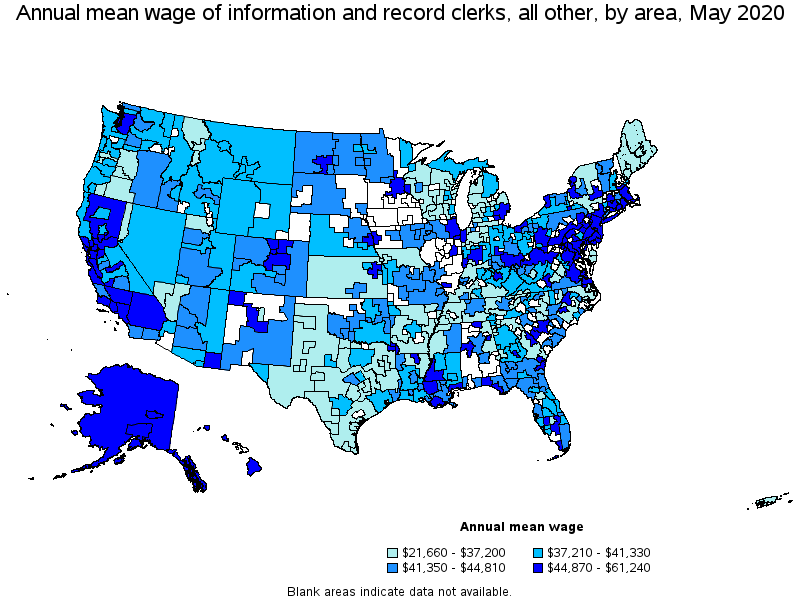
Top paying metropolitan areas for Information and Record Clerks, All Other:
| Metropolitan area | Employment (1) | Employment per thousand jobs | Location quotient (9) | Hourly mean wage | Annual mean wage (2) |
|---|---|---|---|---|---|
| San Jose-Sunnyvale-Santa Clara, CA | 1,120 | 1.01 | 0.95 | $ 29.44 | $ 61,240 |
| San Francisco-Oakland-Hayward, CA | 2,340 | 1.01 | 0.94 | $ 28.85 | $ 60,000 |
| Santa Maria-Santa Barbara, CA | 270 | 1.46 | 1.36 | $ 28.69 | $ 59,680 |
| Washington-Arlington-Alexandria, DC-VA-MD-WV | 5,560 | 1.84 | 1.72 | $ 27.38 | $ 56,950 |
| Norwich-New London-Westerly, CT-RI | 100 | 0.86 | 0.80 | $ 26.61 | $ 55,350 |
| Salinas, CA | 300 | 1.73 | 1.62 | $ 26.36 | $ 54,830 |
| Vineland-Bridgeton, NJ | 90 | 1.54 | 1.44 | $ 25.91 | $ 53,900 |
| Huntsville, AL | 140 | 0.62 | 0.58 | $ 25.60 | $ 53,250 |
| Vallejo-Fairfield, CA | 370 | 2.76 | 2.58 | $ 25.59 | $ 53,230 |
| Brunswick, GA | 70 | 1.80 | 1.68 | $ 25.50 | $ 53,050 |
Nonmetropolitan areas with the highest employment in Information and Record Clerks, All Other:
| Nonmetropolitan area | Employment (1) | Employment per thousand jobs | Location quotient (9) | Hourly mean wage | Annual mean wage (2) |
|---|---|---|---|---|---|
| Kansas nonmetropolitan area | 440 | 1.17 | 1.09 | $ 16.76 | $ 34,860 |
| Northwest Colorado nonmetropolitan area | 380 | 3.29 | 3.07 | $ 20.24 | $ 42,110 |
| Western Wisconsin nonmetropolitan area | 310 | 2.34 | 2.19 | $ 15.73 | $ 32,710 |
| Coast Oregon nonmetropolitan area | 310 | 2.90 | 2.71 | $ 18.60 | $ 38,680 |
| North Texas Region of Texas nonmetropolitan area | 310 | 1.14 | 1.07 | $ 16.49 | $ 34,300 |
Nonmetropolitan areas with the highest concentration of jobs and location quotients in Information and Record Clerks, All Other:
| Nonmetropolitan area | Employment (1) | Employment per thousand jobs | Location quotient (9) | Hourly mean wage | Annual mean wage (2) |
|---|---|---|---|---|---|
| Eastern Sierra-Mother Lode Region of California nonmetropolitan area | 210 | 3.81 | 3.56 | $ 19.75 | $ 41,090 |
| Border Region of Texas nonmetropolitan area | 210 | 3.76 | 3.51 | $ 17.09 | $ 35,550 |
| Northwest Colorado nonmetropolitan area | 380 | 3.29 | 3.07 | $ 20.24 | $ 42,110 |
| Central Oregon nonmetropolitan area | 170 | 2.91 | 2.72 | $ 17.05 | $ 35,470 |
| Coast Oregon nonmetropolitan area | 310 | 2.90 | 2.71 | $ 18.60 | $ 38,680 |
Top paying nonmetropolitan areas for Information and Record Clerks, All Other:
| Nonmetropolitan area | Employment (1) | Employment per thousand jobs | Location quotient (9) | Hourly mean wage | Annual mean wage (2) |
|---|---|---|---|---|---|
| Hawaii / Kauai nonmetropolitan area | (8) | (8) | (8) | $ 25.90 | $ 53,880 |
| Alaska nonmetropolitan area | (8) | (8) | (8) | $ 24.05 | $ 50,030 |
| Southern Pennsylvania nonmetropolitan area | 90 | 0.49 | 0.46 | $ 22.84 | $ 47,510 |
| Southern Ohio nonmetropolitan area | 100 | 0.64 | 0.60 | $ 22.77 | $ 47,360 |
| Northern West Virginia nonmetropolitan area | 80 | 0.55 | 0.52 | $ 22.57 | $ 46,950 |
These estimates are calculated with data collected from employers in all industry sectors, all metropolitan and nonmetropolitan areas, and all states and the District of Columbia. The top employment and wage figures are provided above. The complete list is available in the downloadable XLS files.
The percentile wage estimate is the value of a wage below which a certain percent of workers fall. The median wage is the 50th percentile wage estimate—50 percent of workers earn less than the median and 50 percent of workers earn more than the median. More about percentile wages.
(1) Estimates for detailed occupations do not sum to the totals because the totals include occupations not shown separately. Estimates do not include self-employed workers.
(2) Annual wages have been calculated by multiplying the hourly mean wage by a "year-round, full-time" hours figure of 2,080 hours; for those occupations where there is not an hourly wage published, the annual wage has been directly calculated from the reported survey data.
(3) The relative standard error (RSE) is a measure of the reliability of a survey statistic. The smaller the relative standard error, the more precise the estimate.
(8) Estimate not released.
(9) The location quotient is the ratio of the area concentration of occupational employment to the national average concentration. A location quotient greater than one indicates the occupation has a higher share of employment than average, and a location quotient less than one indicates the occupation is less prevalent in the area than average.
Other OEWS estimates and related information:
May 2020 National Occupational Employment and Wage Estimates
May 2020 State Occupational Employment and Wage Estimates
May 2020 Metropolitan and Nonmetropolitan Area Occupational Employment and Wage Estimates
May 2020 National Industry-Specific Occupational Employment and Wage Estimates
Last Modified Date: March 31, 2021