
An official website of the United States government
An official website of the United States government
The .gov means it's official.
Federal government websites often end in .gov or .mil. Before sharing sensitive information,
make sure you're on a federal government site.
The site is secure.
The
https:// ensures that you are connecting to the official website and that any
information you provide is encrypted and transmitted securely.
Assemble, install, or maintain solar photovoltaic (PV) systems on roofs or other structures in compliance with site assessment and schematics. May include measuring, cutting, assembling, and bolting structural framing and solar modules. May perform minor electrical work such as current checks. Excludes solar PV electricians who are included in "Electricians" (47-2111) and solar thermal installers who are included in "Plumbers, Pipefitters, and Steamfitters" (47-2152).
Employment estimate and mean wage estimates for Solar Photovoltaic Installers:
| Employment (1) | Employment RSE (3) |
Mean hourly wage |
Mean annual wage (2) |
Wage RSE (3) |
|---|---|---|---|---|
| 11,490 | 9.2 % | $ 23.08 | $ 48,020 | 1.9 % |
Percentile wage estimates for Solar Photovoltaic Installers:
| Percentile | 10% | 25% | 50% (Median) |
75% | 90% |
|---|---|---|---|---|---|
| Hourly Wage | $ 15.67 | $ 18.20 | $ 22.34 | $ 26.81 | $ 31.06 |
| Annual Wage (2) | $ 32,590 | $ 37,860 | $ 46,470 | $ 55,760 | $ 64,600 |
Industries with the highest published employment and wages for Solar Photovoltaic Installers are provided. For a list of all industries with employment in Solar Photovoltaic Installers, see the Create Customized Tables function.
Industries with the highest levels of employment in Solar Photovoltaic Installers:
| Industry | Employment (1) | Percent of industry employment | Hourly mean wage | Annual mean wage (2) |
|---|---|---|---|---|
| Building Equipment Contractors | 8,190 | 0.37 | $ 23.35 | $ 48,560 |
| Utility System Construction | 1,150 | 0.21 | $ 23.66 | $ 49,210 |
| Electric Power Generation, Transmission and Distribution | 590 | 0.16 | $ 23.49 | $ 48,850 |
| Nonresidential Building Construction | 150 | 0.02 | $ 24.18 | $ 50,290 |
| Foundation, Structure, and Building Exterior Contractors | 120 | 0.01 | $ 21.45 | $ 44,610 |
Industries with the highest concentration of employment in Solar Photovoltaic Installers:
| Industry | Employment (1) | Percent of industry employment | Hourly mean wage | Annual mean wage (2) |
|---|---|---|---|---|
| Building Equipment Contractors | 8,190 | 0.37 | $ 23.35 | $ 48,560 |
| Utility System Construction | 1,150 | 0.21 | $ 23.66 | $ 49,210 |
| Electric Power Generation, Transmission and Distribution | 590 | 0.16 | $ 23.49 | $ 48,850 |
| Nonresidential Building Construction | 150 | 0.02 | $ 24.18 | $ 50,290 |
| Foundation, Structure, and Building Exterior Contractors | 120 | 0.01 | $ 21.45 | $ 44,610 |
Top paying industries for Solar Photovoltaic Installers:
| Industry | Employment (1) | Percent of industry employment | Hourly mean wage | Annual mean wage (2) |
|---|---|---|---|---|
| Other Specialty Trade Contractors | (8) | (8) | $ 24.24 | $ 50,410 |
| Nonresidential Building Construction | 150 | 0.02 | $ 24.18 | $ 50,290 |
| Utility System Construction | 1,150 | 0.21 | $ 23.66 | $ 49,210 |
| Electric Power Generation, Transmission and Distribution | 590 | 0.16 | $ 23.49 | $ 48,850 |
| Building Equipment Contractors | 8,190 | 0.37 | $ 23.35 | $ 48,560 |
States and areas with the highest published employment, location quotients, and wages for Solar Photovoltaic Installers are provided. For a list of all areas with employment in Solar Photovoltaic Installers, see the Create Customized Tables function.
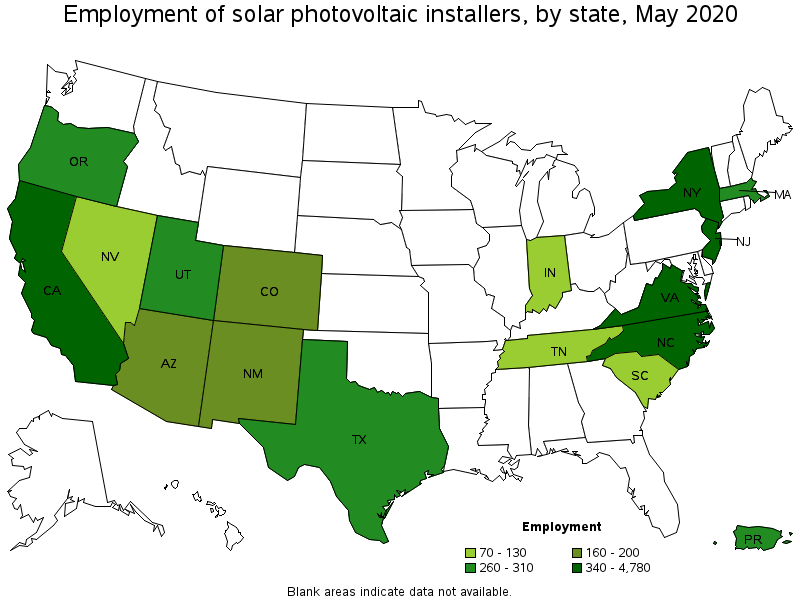
States with the highest employment level in Solar Photovoltaic Installers:
| State | Employment (1) | Employment per thousand jobs | Location quotient (9) | Hourly mean wage | Annual mean wage (2) |
|---|---|---|---|---|---|
| California | 4,780 | 0.29 | 3.52 | $ 23.89 | $ 49,690 |
| New Jersey | 1,370 | 0.36 | 4.39 | $ 23.91 | $ 49,730 |
| North Carolina | 580 | 0.13 | 1.63 | $ 19.57 | $ 40,710 |
| New York | 500 | 0.06 | 0.70 | $ 24.48 | $ 50,920 |
| Virginia | 340 | 0.09 | 1.10 | $ 20.35 | $ 42,330 |
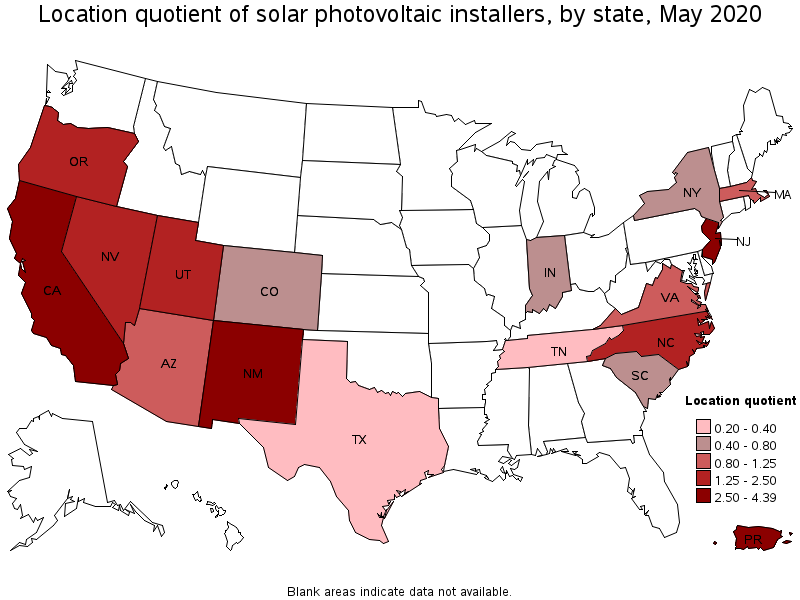
States with the highest concentration of jobs and location quotients in Solar Photovoltaic Installers:
| State | Employment (1) | Employment per thousand jobs | Location quotient (9) | Hourly mean wage | Annual mean wage (2) |
|---|---|---|---|---|---|
| New Jersey | 1,370 | 0.36 | 4.39 | $ 23.91 | $ 49,730 |
| California | 4,780 | 0.29 | 3.52 | $ 23.89 | $ 49,690 |
| New Mexico | 200 | 0.25 | 3.08 | $ 21.04 | $ 43,760 |
| Utah | 270 | 0.18 | 2.23 | $ 19.98 | $ 41,570 |
| Oregon | 260 | 0.14 | 1.73 | $ 27.78 | $ 57,790 |
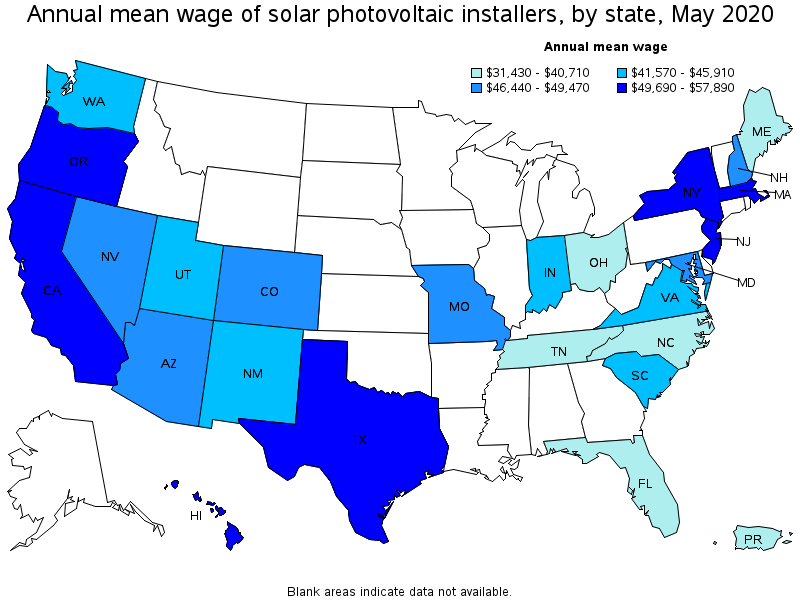
Top paying states for Solar Photovoltaic Installers:
| State | Employment (1) | Employment per thousand jobs | Location quotient (9) | Hourly mean wage | Annual mean wage (2) |
|---|---|---|---|---|---|
| Hawaii | (8) | (8) | (8) | $ 27.83 | $ 57,890 |
| Oregon | 260 | 0.14 | 1.73 | $ 27.78 | $ 57,790 |
| Texas | 260 | 0.02 | 0.26 | $ 25.10 | $ 52,210 |
| New York | 500 | 0.06 | 0.70 | $ 24.48 | $ 50,920 |
| Massachusetts | 310 | 0.09 | 1.13 | $ 24.45 | $ 50,850 |
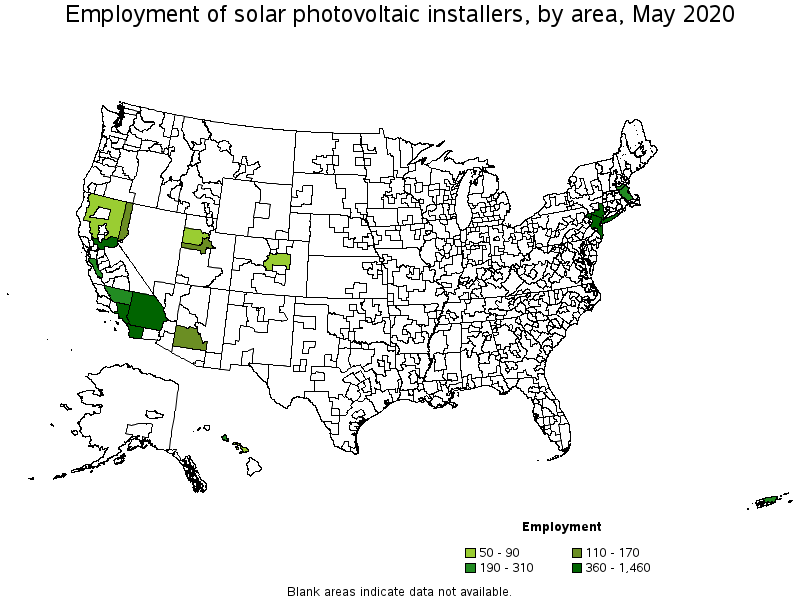
Metropolitan areas with the highest employment level in Solar Photovoltaic Installers:
| Metropolitan area | Employment (1) | Employment per thousand jobs | Location quotient (9) | Hourly mean wage | Annual mean wage (2) |
|---|---|---|---|---|---|
| New York-Newark-Jersey City, NY-NJ-PA | 1,460 | 0.17 | 2.00 | $ 23.86 | $ 49,620 |
| Los Angeles-Long Beach-Anaheim, CA | 1,050 | 0.18 | 2.17 | $ 22.71 | $ 47,240 |
| San Diego-Carlsbad, CA | 560 | 0.40 | 4.85 | $ 24.63 | $ 51,230 |
| Riverside-San Bernardino-Ontario, CA | 400 | 0.27 | 3.24 | $ 21.59 | $ 44,900 |
| Sacramento--Roseville--Arden-Arcade, CA | 360 | 0.37 | 4.52 | $ 22.66 | $ 47,130 |
| San Jose-Sunnyvale-Santa Clara, CA | 310 | 0.28 | 3.44 | $ 25.82 | $ 53,710 |
| Bakersfield, CA | 240 | 0.77 | 9.37 | $ 21.46 | $ 44,640 |
| Boston-Cambridge-Nashua, MA-NH | 190 | 0.07 | 0.89 | $ 24.58 | $ 51,120 |
| Urban Honolulu, HI | 190 | 0.46 | 5.56 | $ 28.91 | $ 60,140 |
| Phoenix-Mesa-Scottsdale, AZ | 170 | 0.08 | 1.00 | $ 23.87 | $ 49,650 |
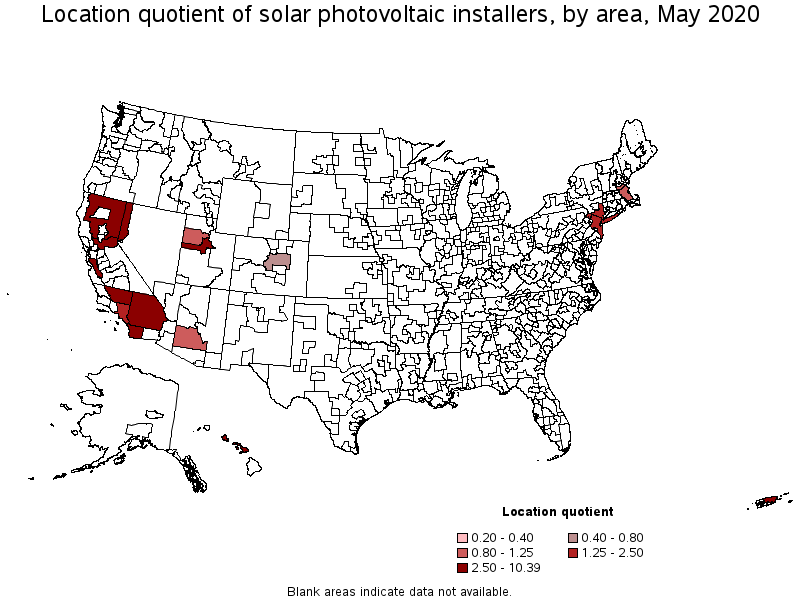
Metropolitan areas with the highest concentration of jobs and location quotients in Solar Photovoltaic Installers:
| Metropolitan area | Employment (1) | Employment per thousand jobs | Location quotient (9) | Hourly mean wage | Annual mean wage (2) |
|---|---|---|---|---|---|
| Kahului-Wailuku-Lahaina, HI | 60 | 0.86 | 10.39 | $ 27.32 | $ 56,830 |
| Bakersfield, CA | 240 | 0.77 | 9.37 | $ 21.46 | $ 44,640 |
| Provo-Orem, UT | 150 | 0.60 | 7.24 | $ 18.97 | $ 39,460 |
| Reno, NV | 110 | 0.50 | 6.04 | $ 22.40 | $ 46,590 |
| Urban Honolulu, HI | 190 | 0.46 | 5.56 | $ 28.91 | $ 60,140 |
| San Diego-Carlsbad, CA | 560 | 0.40 | 4.85 | $ 24.63 | $ 51,230 |
| Sacramento--Roseville--Arden-Arcade, CA | 360 | 0.37 | 4.52 | $ 22.66 | $ 47,130 |
| San Jose-Sunnyvale-Santa Clara, CA | 310 | 0.28 | 3.44 | $ 25.82 | $ 53,710 |
| Riverside-San Bernardino-Ontario, CA | 400 | 0.27 | 3.24 | $ 21.59 | $ 44,900 |
| Los Angeles-Long Beach-Anaheim, CA | 1,050 | 0.18 | 2.17 | $ 22.71 | $ 47,240 |
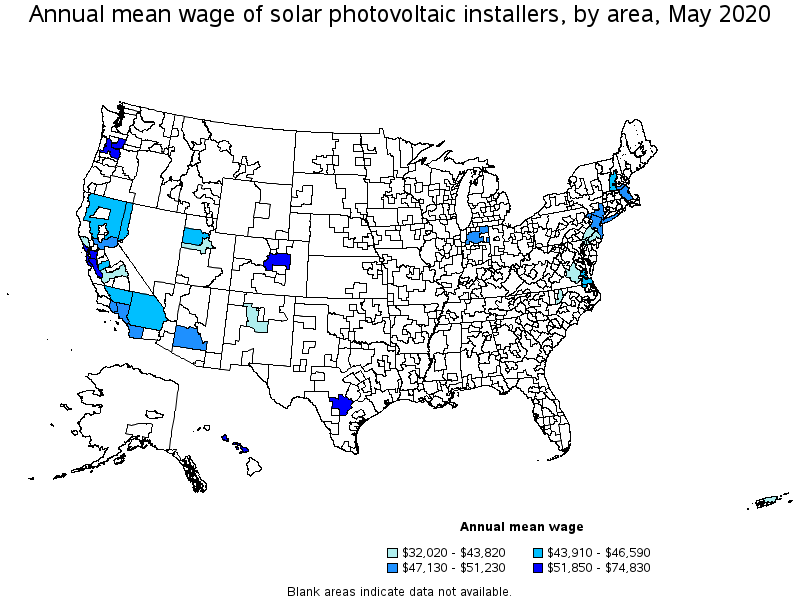
Top paying metropolitan areas for Solar Photovoltaic Installers:
| Metropolitan area | Employment (1) | Employment per thousand jobs | Location quotient (9) | Hourly mean wage | Annual mean wage (2) |
|---|---|---|---|---|---|
| Santa Cruz-Watsonville, CA | (8) | (8) | (8) | $ 35.98 | $ 74,830 |
| San Francisco-Oakland-Hayward, CA | (8) | (8) | (8) | $ 29.31 | $ 60,970 |
| Urban Honolulu, HI | 190 | 0.46 | 5.56 | $ 28.91 | $ 60,140 |
| Portland-Vancouver-Hillsboro, OR-WA | (8) | (8) | (8) | $ 28.25 | $ 58,760 |
| San Antonio-New Braunfels, TX | (8) | (8) | (8) | $ 28.09 | $ 58,420 |
| Kahului-Wailuku-Lahaina, HI | 60 | 0.86 | 10.39 | $ 27.32 | $ 56,830 |
| San Jose-Sunnyvale-Santa Clara, CA | 310 | 0.28 | 3.44 | $ 25.82 | $ 53,710 |
| Denver-Aurora-Lakewood, CO | 90 | 0.06 | 0.73 | $ 24.93 | $ 51,850 |
| San Diego-Carlsbad, CA | 560 | 0.40 | 4.85 | $ 24.63 | $ 51,230 |
| Boston-Cambridge-Nashua, MA-NH | 190 | 0.07 | 0.89 | $ 24.58 | $ 51,120 |
Nonmetropolitan areas with the highest employment in Solar Photovoltaic Installers:
| Nonmetropolitan area | Employment (1) | Employment per thousand jobs | Location quotient (9) | Hourly mean wage | Annual mean wage (2) |
|---|---|---|---|---|---|
| North Valley-Northern Mountains Region of California nonmetropolitan area | 50 | 0.56 | 6.77 | $ 21.51 | $ 44,750 |
Nonmetropolitan areas with the highest concentration of jobs and location quotients in Solar Photovoltaic Installers:
| Nonmetropolitan area | Employment (1) | Employment per thousand jobs | Location quotient (9) | Hourly mean wage | Annual mean wage (2) |
|---|---|---|---|---|---|
| North Valley-Northern Mountains Region of California nonmetropolitan area | 50 | 0.56 | 6.77 | $ 21.51 | $ 44,750 |
Top paying nonmetropolitan areas for Solar Photovoltaic Installers:
| Nonmetropolitan area | Employment (1) | Employment per thousand jobs | Location quotient (9) | Hourly mean wage | Annual mean wage (2) |
|---|---|---|---|---|---|
| Northern Indiana nonmetropolitan area | (8) | (8) | (8) | $ 22.87 | $ 47,570 |
| West Central-Southwest New Hampshire nonmetropolitan area | (8) | (8) | (8) | $ 22.33 | $ 46,440 |
| North Valley-Northern Mountains Region of California nonmetropolitan area | 50 | 0.56 | 6.77 | $ 21.51 | $ 44,750 |
These estimates are calculated with data collected from employers in all industry sectors, all metropolitan and nonmetropolitan areas, and all states and the District of Columbia. The top employment and wage figures are provided above. The complete list is available in the downloadable XLS files.
The percentile wage estimate is the value of a wage below which a certain percent of workers fall. The median wage is the 50th percentile wage estimate—50 percent of workers earn less than the median and 50 percent of workers earn more than the median. More about percentile wages.
(1) Estimates for detailed occupations do not sum to the totals because the totals include occupations not shown separately. Estimates do not include self-employed workers.
(2) Annual wages have been calculated by multiplying the hourly mean wage by a "year-round, full-time" hours figure of 2,080 hours; for those occupations where there is not an hourly wage published, the annual wage has been directly calculated from the reported survey data.
(3) The relative standard error (RSE) is a measure of the reliability of a survey statistic. The smaller the relative standard error, the more precise the estimate.
(8) Estimate not released.
(9) The location quotient is the ratio of the area concentration of occupational employment to the national average concentration. A location quotient greater than one indicates the occupation has a higher share of employment than average, and a location quotient less than one indicates the occupation is less prevalent in the area than average.
Other OEWS estimates and related information:
May 2020 National Occupational Employment and Wage Estimates
May 2020 State Occupational Employment and Wage Estimates
May 2020 Metropolitan and Nonmetropolitan Area Occupational Employment and Wage Estimates
May 2020 National Industry-Specific Occupational Employment and Wage Estimates
Last Modified Date: March 31, 2021