
An official website of the United States government
An official website of the United States government
The .gov means it's official.
Federal government websites often end in .gov or .mil. Before sharing sensitive information,
make sure you're on a federal government site.
The site is secure.
The
https:// ensures that you are connecting to the official website and that any
information you provide is encrypted and transmitted securely.
Operate or tend machines to bleach, shrink, wash, dye, or finish textiles or synthetic or glass fibers.
Employment estimate and mean wage estimates for Textile Bleaching and Dyeing Machine Operators and Tenders:
| Employment (1) | Employment RSE (3) |
Mean hourly wage |
Mean annual wage (2) |
Wage RSE (3) |
|---|---|---|---|---|
| 7,260 | 7.6 % | $ 15.19 | $ 31,600 | 1.1 % |
Percentile wage estimates for Textile Bleaching and Dyeing Machine Operators and Tenders:
| Percentile | 10% | 25% | 50% (Median) |
75% | 90% |
|---|---|---|---|---|---|
| Hourly Wage | $ 11.11 | $ 13.00 | $ 14.55 | $ 17.44 | $ 20.14 |
| Annual Wage (2) | $ 23,100 | $ 27,050 | $ 30,260 | $ 36,280 | $ 41,880 |
Industries with the highest published employment and wages for Textile Bleaching and Dyeing Machine Operators and Tenders are provided. For a list of all industries with employment in Textile Bleaching and Dyeing Machine Operators and Tenders, see the Create Customized Tables function.
Industries with the highest levels of employment in Textile Bleaching and Dyeing Machine Operators and Tenders:
| Industry | Employment (1) | Percent of industry employment | Hourly mean wage | Annual mean wage (2) |
|---|---|---|---|---|
| Textile and Fabric Finishing and Fabric Coating Mills | 4,440 | 17.67 | $ 15.00 | $ 31,190 |
| Fabric Mills | 660 | 1.44 | $ 14.65 | $ 30,480 |
| Textile Furnishings Mills | 550 | 1.27 | $ 16.99 | $ 35,340 |
| Fiber, Yarn, and Thread Mills | 260 | 1.20 | $ 15.38 | $ 31,990 |
| Apparel Knitting Mills | 200 | 2.35 | $ 13.99 | $ 29,100 |
Industries with the highest concentration of employment in Textile Bleaching and Dyeing Machine Operators and Tenders:
| Industry | Employment (1) | Percent of industry employment | Hourly mean wage | Annual mean wage (2) |
|---|---|---|---|---|
| Textile and Fabric Finishing and Fabric Coating Mills | 4,440 | 17.67 | $ 15.00 | $ 31,190 |
| Leather and Hide Tanning and Finishing | 170 | 6.07 | $ 16.27 | $ 33,830 |
| Apparel Knitting Mills | 200 | 2.35 | $ 13.99 | $ 29,100 |
| Fabric Mills | 660 | 1.44 | $ 14.65 | $ 30,480 |
| Textile Furnishings Mills | 550 | 1.27 | $ 16.99 | $ 35,340 |
Top paying industries for Textile Bleaching and Dyeing Machine Operators and Tenders:
| Industry | Employment (1) | Percent of industry employment | Hourly mean wage | Annual mean wage (2) |
|---|---|---|---|---|
| Other Textile Product Mills | 80 | 0.14 | $ 17.45 | $ 36,290 |
| Textile Furnishings Mills | 550 | 1.27 | $ 16.99 | $ 35,340 |
| Leather and Hide Tanning and Finishing | 170 | 6.07 | $ 16.27 | $ 33,830 |
| Drycleaning and Laundry Services | (8) | (8) | $ 15.41 | $ 32,060 |
| Fiber, Yarn, and Thread Mills | 260 | 1.20 | $ 15.38 | $ 31,990 |
States and areas with the highest published employment, location quotients, and wages for Textile Bleaching and Dyeing Machine Operators and Tenders are provided. For a list of all areas with employment in Textile Bleaching and Dyeing Machine Operators and Tenders, see the Create Customized Tables function.
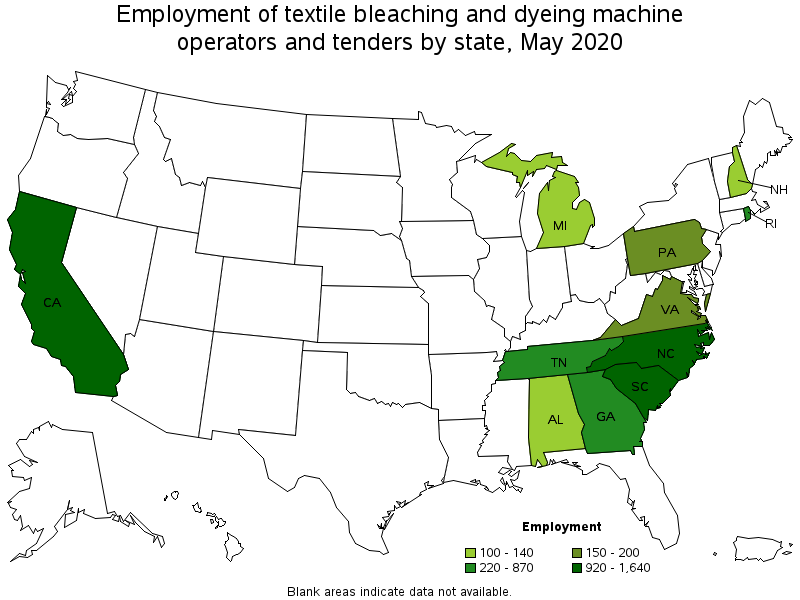
States with the highest employment level in Textile Bleaching and Dyeing Machine Operators and Tenders:
| State | Employment (1) | Employment per thousand jobs | Location quotient (9) | Hourly mean wage | Annual mean wage (2) |
|---|---|---|---|---|---|
| California | 1,640 | 0.10 | 1.91 | $ 15.69 | $ 32,640 |
| North Carolina | 1,630 | 0.38 | 7.29 | $ 14.33 | $ 29,810 |
| South Carolina | 920 | 0.46 | 8.74 | $ 13.98 | $ 29,080 |
| Georgia | 870 | 0.20 | 3.86 | $ 15.90 | $ 33,080 |
| Tennessee | 240 | 0.08 | 1.57 | $ 14.16 | $ 29,440 |
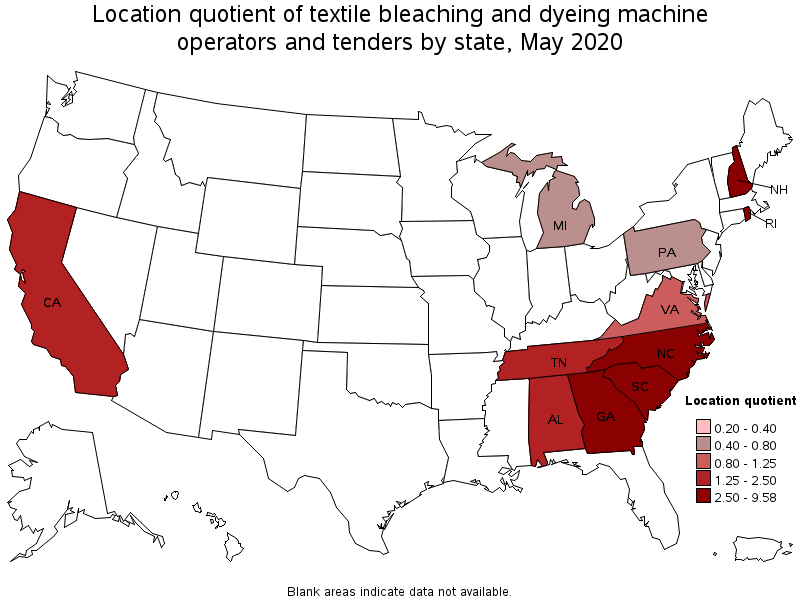
States with the highest concentration of jobs and location quotients in Textile Bleaching and Dyeing Machine Operators and Tenders:
| State | Employment (1) | Employment per thousand jobs | Location quotient (9) | Hourly mean wage | Annual mean wage (2) |
|---|---|---|---|---|---|
| Rhode Island | 220 | 0.50 | 9.58 | (8) | (8) |
| South Carolina | 920 | 0.46 | 8.74 | $ 13.98 | $ 29,080 |
| North Carolina | 1,630 | 0.38 | 7.29 | $ 14.33 | $ 29,810 |
| New Hampshire | 140 | 0.23 | 4.33 | $ 14.32 | $ 29,790 |
| Georgia | 870 | 0.20 | 3.86 | $ 15.90 | $ 33,080 |
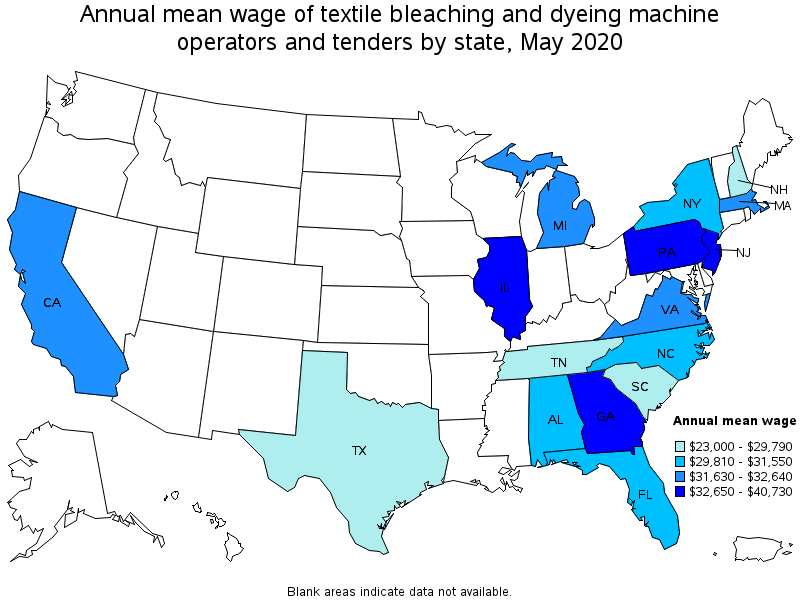
Top paying states for Textile Bleaching and Dyeing Machine Operators and Tenders:
| State | Employment (1) | Employment per thousand jobs | Location quotient (9) | Hourly mean wage | Annual mean wage (2) |
|---|---|---|---|---|---|
| New Jersey | (8) | (8) | (8) | $ 19.58 | $ 40,730 |
| Pennsylvania | 150 | 0.03 | 0.54 | $ 17.88 | $ 37,180 |
| Georgia | 870 | 0.20 | 3.86 | $ 15.90 | $ 33,080 |
| Illinois | (8) | (8) | (8) | $ 15.70 | $ 32,650 |
| California | 1,640 | 0.10 | 1.91 | $ 15.69 | $ 32,640 |
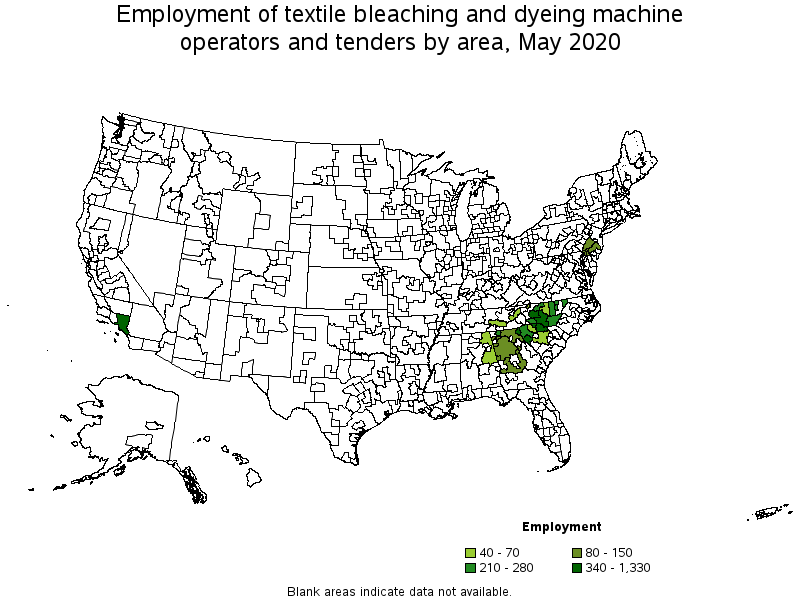
Metropolitan areas with the highest employment level in Textile Bleaching and Dyeing Machine Operators and Tenders:
| Metropolitan area | Employment (1) | Employment per thousand jobs | Location quotient (9) | Hourly mean wage | Annual mean wage (2) |
|---|---|---|---|---|---|
| Los Angeles-Long Beach-Anaheim, CA | 1,330 | 0.23 | 4.39 | $ 15.60 | $ 32,460 |
| Charlotte-Concord-Gastonia, NC-SC | 370 | 0.31 | 5.86 | $ 15.31 | $ 31,840 |
| Hickory-Lenoir-Morganton, NC | 340 | 2.38 | 45.64 | $ 15.26 | $ 31,750 |
| Greensboro-High Point, NC | 280 | 0.80 | 15.38 | $ 15.16 | $ 31,540 |
| Dalton, GA | 260 | 4.39 | 84.22 | $ 17.93 | $ 37,290 |
| Greenville-Anderson-Mauldin, SC | 250 | 0.65 | 12.50 | $ 14.26 | $ 29,650 |
| Burlington, NC | 210 | 3.38 | 64.84 | $ 13.00 | $ 27,030 |
| Atlanta-Sandy Springs-Roswell, GA | 150 | 0.06 | 1.12 | $ 15.79 | $ 32,850 |
| Philadelphia-Camden-Wilmington, PA-NJ-DE-MD | 80 | 0.03 | 0.57 | $ 16.74 | $ 34,810 |
| Spartanburg, SC | 70 | 0.43 | 8.26 | $ 12.39 | $ 25,770 |
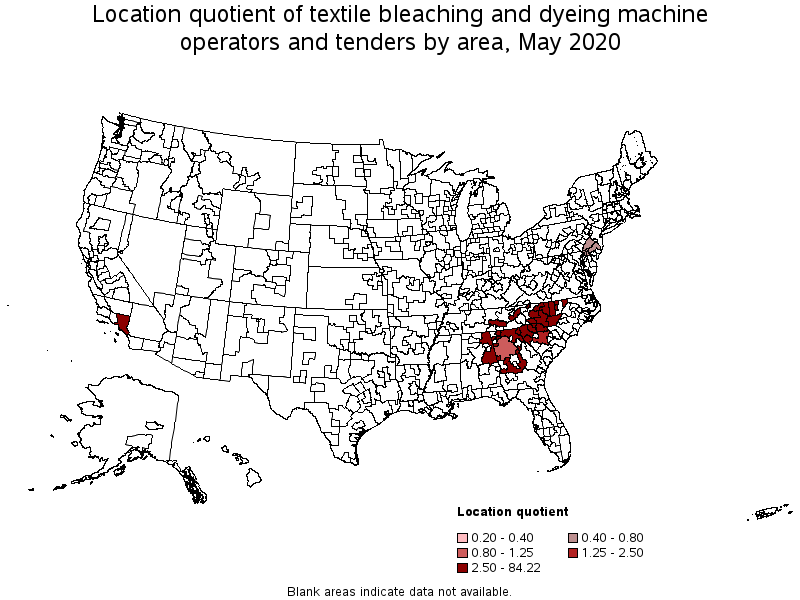
Metropolitan areas with the highest concentration of jobs and location quotients in Textile Bleaching and Dyeing Machine Operators and Tenders:
| Metropolitan area | Employment (1) | Employment per thousand jobs | Location quotient (9) | Hourly mean wage | Annual mean wage (2) |
|---|---|---|---|---|---|
| Dalton, GA | 260 | 4.39 | 84.22 | $ 17.93 | $ 37,290 |
| Burlington, NC | 210 | 3.38 | 64.84 | $ 13.00 | $ 27,030 |
| Hickory-Lenoir-Morganton, NC | 340 | 2.38 | 45.64 | $ 15.26 | $ 31,750 |
| Greensboro-High Point, NC | 280 | 0.80 | 15.38 | $ 15.16 | $ 31,540 |
| Greenville-Anderson-Mauldin, SC | 250 | 0.65 | 12.50 | $ 14.26 | $ 29,650 |
| Spartanburg, SC | 70 | 0.43 | 8.26 | $ 12.39 | $ 25,770 |
| Charlotte-Concord-Gastonia, NC-SC | 370 | 0.31 | 5.86 | $ 15.31 | $ 31,840 |
| Los Angeles-Long Beach-Anaheim, CA | 1,330 | 0.23 | 4.39 | $ 15.60 | $ 32,460 |
| Winston-Salem, NC | 50 | 0.20 | 3.78 | $ 14.80 | $ 30,790 |
| Columbia, SC | 40 | 0.10 | 2.01 | $ 14.03 | $ 29,180 |
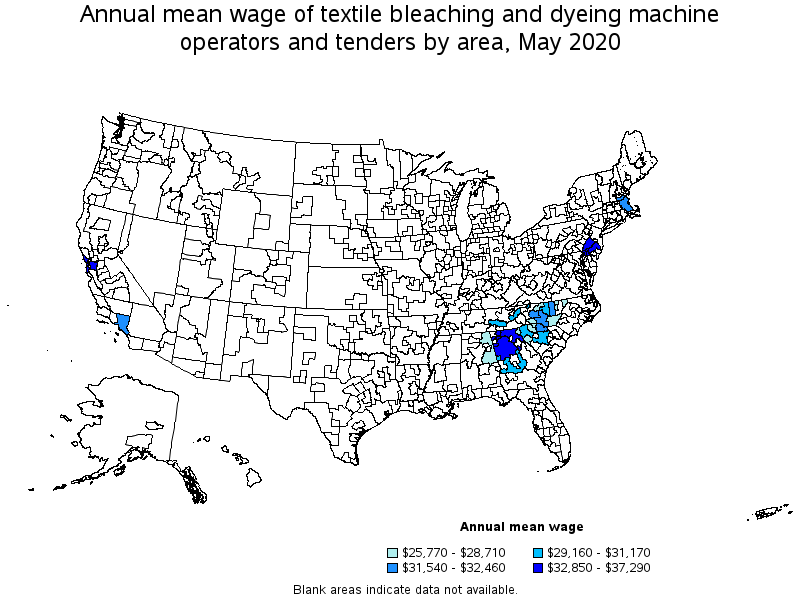
Top paying metropolitan areas for Textile Bleaching and Dyeing Machine Operators and Tenders:
| Metropolitan area | Employment (1) | Employment per thousand jobs | Location quotient (9) | Hourly mean wage | Annual mean wage (2) |
|---|---|---|---|---|---|
| Dalton, GA | 260 | 4.39 | 84.22 | $ 17.93 | $ 37,290 |
| San Francisco-Oakland-Hayward, CA | (8) | (8) | (8) | $ 16.95 | $ 35,250 |
| Philadelphia-Camden-Wilmington, PA-NJ-DE-MD | 80 | 0.03 | 0.57 | $ 16.74 | $ 34,810 |
| Atlanta-Sandy Springs-Roswell, GA | 150 | 0.06 | 1.12 | $ 15.79 | $ 32,850 |
| Los Angeles-Long Beach-Anaheim, CA | 1,330 | 0.23 | 4.39 | $ 15.60 | $ 32,460 |
| Charlotte-Concord-Gastonia, NC-SC | 370 | 0.31 | 5.86 | $ 15.31 | $ 31,840 |
| Hickory-Lenoir-Morganton, NC | 340 | 2.38 | 45.64 | $ 15.26 | $ 31,750 |
| Boston-Cambridge-Nashua, MA-NH | (8) | (8) | (8) | $ 15.18 | $ 31,570 |
| Greensboro-High Point, NC | 280 | 0.80 | 15.38 | $ 15.16 | $ 31,540 |
| Winston-Salem, NC | 50 | 0.20 | 3.78 | $ 14.80 | $ 30,790 |
Nonmetropolitan areas with the highest employment in Textile Bleaching and Dyeing Machine Operators and Tenders:
| Nonmetropolitan area | Employment (1) | Employment per thousand jobs | Location quotient (9) | Hourly mean wage | Annual mean wage (2) |
|---|---|---|---|---|---|
| Upper Savannah South Carolina nonmetropolitan area | 340 | 4.32 | 82.80 | $ 13.66 | $ 28,410 |
| Piedmont North Carolina nonmetropolitan area | 240 | 1.00 | 19.11 | $ 13.14 | $ 27,330 |
| North Georgia nonmetropolitan area | 130 | 0.82 | 15.69 | $ 16.18 | $ 33,660 |
| Middle Georgia nonmetropolitan area | 110 | 0.86 | 16.46 | $ 14.99 | $ 31,170 |
| Northeast Alabama nonmetropolitan area | 70 | 0.51 | 9.81 | $ 13.80 | $ 28,710 |
Nonmetropolitan areas with the highest concentration of jobs and location quotients in Textile Bleaching and Dyeing Machine Operators and Tenders:
| Nonmetropolitan area | Employment (1) | Employment per thousand jobs | Location quotient (9) | Hourly mean wage | Annual mean wage (2) |
|---|---|---|---|---|---|
| Upper Savannah South Carolina nonmetropolitan area | 340 | 4.32 | 82.80 | $ 13.66 | $ 28,410 |
| Piedmont North Carolina nonmetropolitan area | 240 | 1.00 | 19.11 | $ 13.14 | $ 27,330 |
| Middle Georgia nonmetropolitan area | 110 | 0.86 | 16.46 | $ 14.99 | $ 31,170 |
| North Georgia nonmetropolitan area | 130 | 0.82 | 15.69 | $ 16.18 | $ 33,660 |
| Northeast Alabama nonmetropolitan area | 70 | 0.51 | 9.81 | $ 13.80 | $ 28,710 |
Top paying nonmetropolitan areas for Textile Bleaching and Dyeing Machine Operators and Tenders:
| Nonmetropolitan area | Employment (1) | Employment per thousand jobs | Location quotient (9) | Hourly mean wage | Annual mean wage (2) |
|---|---|---|---|---|---|
| North Georgia nonmetropolitan area | 130 | 0.82 | 15.69 | $ 16.18 | $ 33,660 |
| Middle Georgia nonmetropolitan area | 110 | 0.86 | 16.46 | $ 14.99 | $ 31,170 |
| East Tennessee nonmetropolitan area | 50 | 0.37 | 7.05 | $ 14.02 | $ 29,160 |
| Northeast Alabama nonmetropolitan area | 70 | 0.51 | 9.81 | $ 13.80 | $ 28,710 |
| Upper Savannah South Carolina nonmetropolitan area | 340 | 4.32 | 82.80 | $ 13.66 | $ 28,410 |
These estimates are calculated with data collected from employers in all industry sectors, all metropolitan and nonmetropolitan areas, and all states and the District of Columbia. The top employment and wage figures are provided above. The complete list is available in the downloadable XLS files.
The percentile wage estimate is the value of a wage below which a certain percent of workers fall. The median wage is the 50th percentile wage estimate—50 percent of workers earn less than the median and 50 percent of workers earn more than the median. More about percentile wages.
(1) Estimates for detailed occupations do not sum to the totals because the totals include occupations not shown separately. Estimates do not include self-employed workers.
(2) Annual wages have been calculated by multiplying the hourly mean wage by a "year-round, full-time" hours figure of 2,080 hours; for those occupations where there is not an hourly wage published, the annual wage has been directly calculated from the reported survey data.
(3) The relative standard error (RSE) is a measure of the reliability of a survey statistic. The smaller the relative standard error, the more precise the estimate.
(8) Estimate not released.
(9) The location quotient is the ratio of the area concentration of occupational employment to the national average concentration. A location quotient greater than one indicates the occupation has a higher share of employment than average, and a location quotient less than one indicates the occupation is less prevalent in the area than average.
Other OEWS estimates and related information:
May 2020 National Occupational Employment and Wage Estimates
May 2020 State Occupational Employment and Wage Estimates
May 2020 Metropolitan and Nonmetropolitan Area Occupational Employment and Wage Estimates
May 2020 National Industry-Specific Occupational Employment and Wage Estimates
Last Modified Date: March 31, 2021