
An official website of the United States government
An official website of the United States government
The .gov means it's official.
Federal government websites often end in .gov or .mil. Before sharing sensitive information,
make sure you're on a federal government site.
The site is secure.
The
https:// ensures that you are connecting to the official website and that any
information you provide is encrypted and transmitted securely.
Operate or tend equipment such as cooling and freezing units, refrigerators, batch freezers, and freezing tunnels, to cool or freeze products, food, blood plasma, and chemicals.
Employment estimate and mean wage estimates for Cooling and Freezing Equipment Operators and Tenders:
| Employment (1) | Employment RSE (3) |
Mean hourly wage |
Mean annual wage (2) |
Wage RSE (3) |
|---|---|---|---|---|
| 8,020 | 4.5 % | $ 19.05 | $ 39,610 | 1.1 % |
Percentile wage estimates for Cooling and Freezing Equipment Operators and Tenders:
| Percentile | 10% | 25% | 50% (Median) |
75% | 90% |
|---|---|---|---|---|---|
| Hourly Wage | $ 12.59 | $ 14.39 | $ 18.10 | $ 23.19 | $ 28.02 |
| Annual Wage (2) | $ 26,190 | $ 29,920 | $ 37,650 | $ 48,230 | $ 58,290 |
Industries with the highest published employment and wages for Cooling and Freezing Equipment Operators and Tenders are provided. For a list of all industries with employment in Cooling and Freezing Equipment Operators and Tenders, see the Create Customized Tables function.
Industries with the highest levels of employment in Cooling and Freezing Equipment Operators and Tenders:
| Industry | Employment (1) | Percent of industry employment | Hourly mean wage | Annual mean wage (2) |
|---|---|---|---|---|
| Animal Slaughtering and Processing | 3,100 | 0.58 | $ 19.04 | $ 39,600 |
| Dairy Product Manufacturing | 1,600 | 1.06 | $ 19.34 | $ 40,230 |
| Beverage Manufacturing | 610 | 0.23 | $ 16.26 | $ 33,820 |
| Fruit and Vegetable Preserving and Specialty Food Manufacturing | 510 | 0.31 | $ 19.36 | $ 40,260 |
| Warehousing and Storage | 410 | 0.03 | $ 19.80 | $ 41,180 |
Industries with the highest concentration of employment in Cooling and Freezing Equipment Operators and Tenders:
| Industry | Employment (1) | Percent of industry employment | Hourly mean wage | Annual mean wage (2) |
|---|---|---|---|---|
| Dairy Product Manufacturing | 1,600 | 1.06 | $ 19.34 | $ 40,230 |
| Animal Slaughtering and Processing | 3,100 | 0.58 | $ 19.04 | $ 39,600 |
| Seafood Product Preparation and Packaging | 110 | 0.38 | $ 14.40 | $ 29,940 |
| Fruit and Vegetable Preserving and Specialty Food Manufacturing | 510 | 0.31 | $ 19.36 | $ 40,260 |
| Beverage Manufacturing | 610 | 0.23 | $ 16.26 | $ 33,820 |
Top paying industries for Cooling and Freezing Equipment Operators and Tenders:
| Industry | Employment (1) | Percent of industry employment | Hourly mean wage | Annual mean wage (2) |
|---|---|---|---|---|
| Machinery Manufacturing (3331, 3332, 3334, and 3339 only) | (8) | (8) | $ 28.42 | $ 59,120 |
| Support Activities for Crop Production | 190 | 0.05 | $ 21.16 | $ 44,010 |
| Management of Companies and Enterprises | 80 | (7) | $ 20.88 | $ 43,440 |
| Other Food Manufacturing | 30 | 0.01 | $ 20.76 | $ 43,180 |
| Warehousing and Storage | 410 | 0.03 | $ 19.80 | $ 41,180 |
States and areas with the highest published employment, location quotients, and wages for Cooling and Freezing Equipment Operators and Tenders are provided. For a list of all areas with employment in Cooling and Freezing Equipment Operators and Tenders, see the Create Customized Tables function.
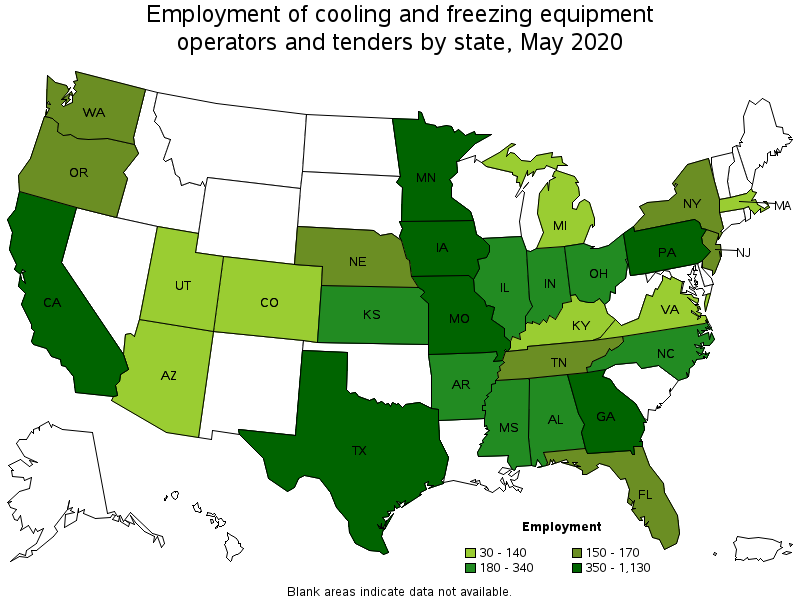
States with the highest employment level in Cooling and Freezing Equipment Operators and Tenders:
| State | Employment (1) | Employment per thousand jobs | Location quotient (9) | Hourly mean wage | Annual mean wage (2) |
|---|---|---|---|---|---|
| California | 1,130 | 0.07 | 1.19 | $ 17.88 | $ 37,200 |
| Iowa | 570 | 0.39 | 6.71 | $ 20.80 | $ 43,270 |
| Texas | 530 | 0.04 | 0.76 | $ 19.41 | $ 40,380 |
| Missouri | 520 | 0.19 | 3.33 | $ 19.32 | $ 40,180 |
| Georgia | 410 | 0.10 | 1.66 | $ 17.00 | $ 35,360 |
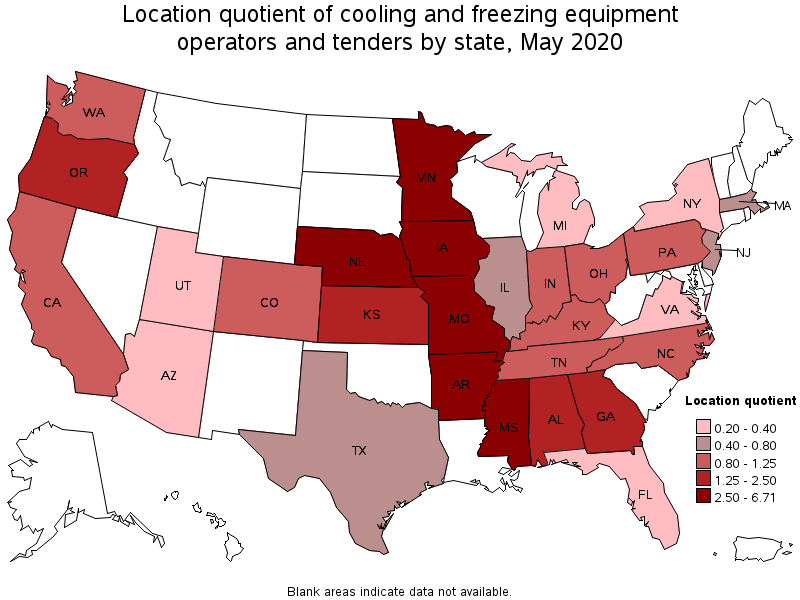
States with the highest concentration of jobs and location quotients in Cooling and Freezing Equipment Operators and Tenders:
| State | Employment (1) | Employment per thousand jobs | Location quotient (9) | Hourly mean wage | Annual mean wage (2) |
|---|---|---|---|---|---|
| Iowa | 570 | 0.39 | 6.71 | $ 20.80 | $ 43,270 |
| Arkansas | 340 | 0.29 | 5.06 | $ 18.16 | $ 37,770 |
| Missouri | 520 | 0.19 | 3.33 | $ 19.32 | $ 40,180 |
| Mississippi | 180 | 0.17 | 2.98 | $ 17.10 | $ 35,580 |
| Nebraska | 150 | 0.16 | 2.85 | $ 19.17 | $ 39,870 |
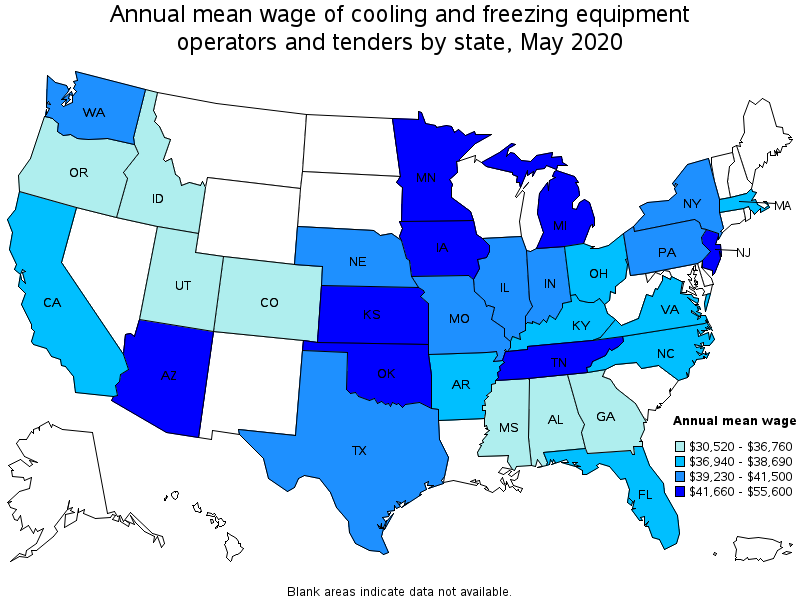
Top paying states for Cooling and Freezing Equipment Operators and Tenders:
| State | Employment (1) | Employment per thousand jobs | Location quotient (9) | Hourly mean wage | Annual mean wage (2) |
|---|---|---|---|---|---|
| New Jersey | 170 | 0.05 | 0.79 | $ 26.73 | $ 55,600 |
| Kansas | 190 | 0.14 | 2.48 | $ 22.52 | $ 46,840 |
| Minnesota | 400 | 0.15 | 2.59 | $ 21.87 | $ 45,490 |
| Michigan | 80 | 0.02 | 0.36 | $ 21.39 | $ 44,490 |
| Arizona | 50 | 0.02 | 0.33 | $ 21.29 | $ 44,280 |
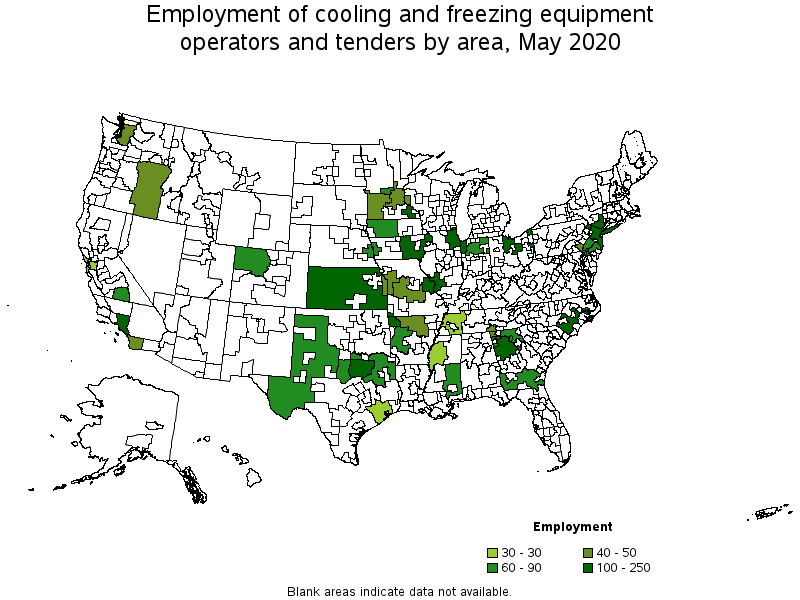
Metropolitan areas with the highest employment level in Cooling and Freezing Equipment Operators and Tenders:
| Metropolitan area | Employment (1) | Employment per thousand jobs | Location quotient (9) | Hourly mean wage | Annual mean wage (2) |
|---|---|---|---|---|---|
| St. Louis, MO-IL | 250 | 0.19 | 3.37 | $ 18.08 | $ 37,610 |
| Rochester, MN | 180 | 1.56 | 27.12 | $ 24.15 | $ 50,230 |
| New York-Newark-Jersey City, NY-NJ-PA | 160 | 0.02 | 0.31 | $ 26.47 | $ 55,070 |
| Chicago-Naperville-Elgin, IL-IN-WI | 140 | 0.03 | 0.55 | (8) | (8) |
| Atlanta-Sandy Springs-Roswell, GA | 140 | 0.05 | 0.91 | $ 16.12 | $ 33,520 |
| Dallas-Fort Worth-Arlington, TX | 140 | 0.04 | 0.66 | $ 22.99 | $ 47,820 |
| Los Angeles-Long Beach-Anaheim, CA | 130 | 0.02 | 0.39 | $ 17.53 | $ 36,470 |
| Fayetteville-Springdale-Rogers, AR-MO | 100 | 0.40 | 6.98 | $ 16.94 | $ 35,230 |
| Philadelphia-Camden-Wilmington, PA-NJ-DE-MD | 70 | 0.03 | 0.48 | (8) | (8) |
| Visalia-Porterville, CA | 60 | 0.43 | 7.46 | $ 19.83 | $ 41,240 |
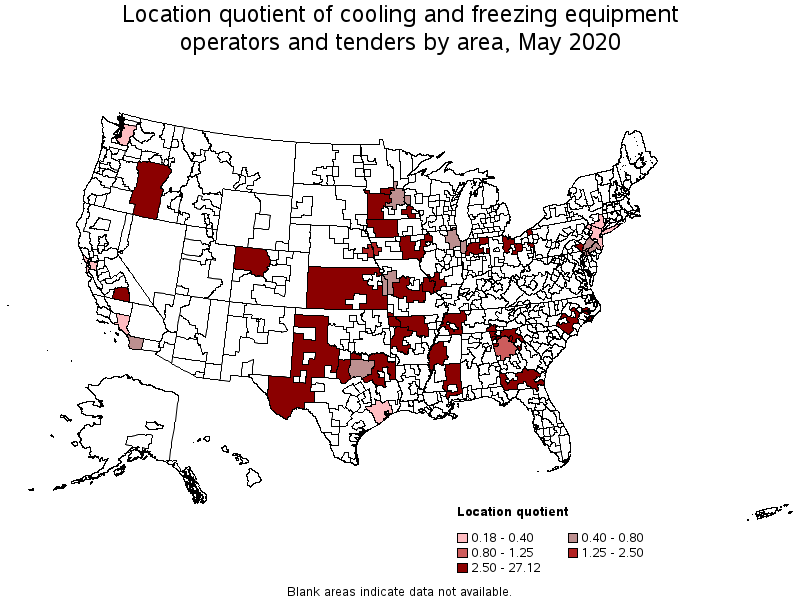
Metropolitan areas with the highest concentration of jobs and location quotients in Cooling and Freezing Equipment Operators and Tenders:
| Metropolitan area | Employment (1) | Employment per thousand jobs | Location quotient (9) | Hourly mean wage | Annual mean wage (2) |
|---|---|---|---|---|---|
| Rochester, MN | 180 | 1.56 | 27.12 | $ 24.15 | $ 50,230 |
| Gainesville, GA | 60 | 0.63 | 10.89 | $ 18.58 | $ 38,640 |
| St. Cloud, MN | 60 | 0.55 | 9.62 | $ 17.71 | $ 36,830 |
| Visalia-Porterville, CA | 60 | 0.43 | 7.46 | $ 19.83 | $ 41,240 |
| Fayetteville-Springdale-Rogers, AR-MO | 100 | 0.40 | 6.98 | $ 16.94 | $ 35,230 |
| Chattanooga, TN-GA | 50 | 0.20 | 3.54 | $ 15.34 | $ 31,910 |
| St. Louis, MO-IL | 250 | 0.19 | 3.37 | $ 18.08 | $ 37,610 |
| Lancaster, PA | 40 | 0.18 | 3.17 | (8) | (8) |
| Omaha-Council Bluffs, NE-IA | 60 | 0.12 | 2.09 | $ 18.40 | $ 38,260 |
| Atlanta-Sandy Springs-Roswell, GA | 140 | 0.05 | 0.91 | $ 16.12 | $ 33,520 |
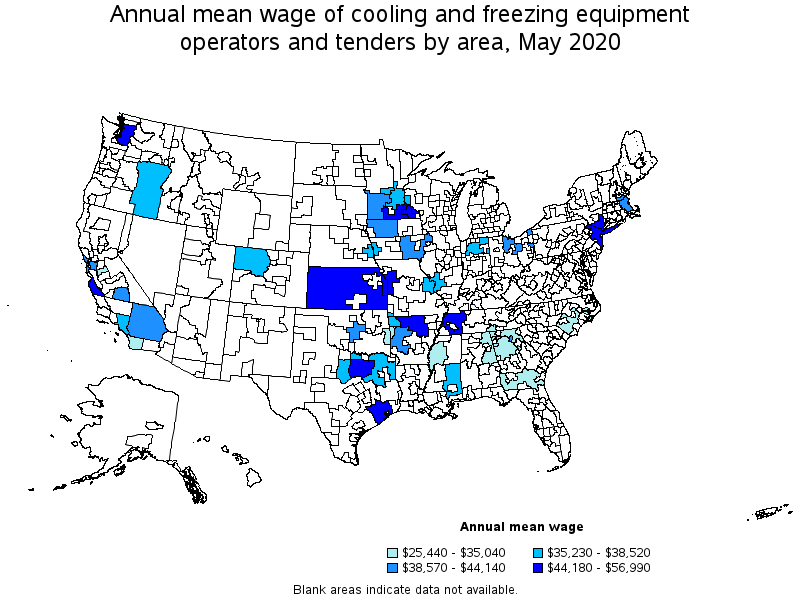
Top paying metropolitan areas for Cooling and Freezing Equipment Operators and Tenders:
| Metropolitan area | Employment (1) | Employment per thousand jobs | Location quotient (9) | Hourly mean wage | Annual mean wage (2) |
|---|---|---|---|---|---|
| Houston-The Woodlands-Sugar Land, TX | 30 | 0.01 | 0.18 | $ 27.40 | $ 56,990 |
| New York-Newark-Jersey City, NY-NJ-PA | 160 | 0.02 | 0.31 | $ 26.47 | $ 55,070 |
| Kansas City, MO-KS | 40 | 0.04 | 0.71 | $ 24.85 | $ 51,700 |
| Rochester, MN | 180 | 1.56 | 27.12 | $ 24.15 | $ 50,230 |
| Dallas-Fort Worth-Arlington, TX | 140 | 0.04 | 0.66 | $ 22.99 | $ 47,820 |
| Seattle-Tacoma-Bellevue, WA | 40 | 0.02 | 0.34 | $ 22.45 | $ 46,690 |
| Salinas, CA | (8) | (8) | (8) | $ 21.50 | $ 44,720 |
| San Francisco-Oakland-Hayward, CA | 30 | 0.01 | 0.24 | $ 21.13 | $ 43,950 |
| Oklahoma City, OK | (8) | (8) | (8) | $ 19.99 | $ 41,580 |
| Visalia-Porterville, CA | 60 | 0.43 | 7.46 | $ 19.83 | $ 41,240 |
Nonmetropolitan areas with the highest employment in Cooling and Freezing Equipment Operators and Tenders:
| Nonmetropolitan area | Employment (1) | Employment per thousand jobs | Location quotient (9) | Hourly mean wage | Annual mean wage (2) |
|---|---|---|---|---|---|
| Southeast Coastal North Carolina nonmetropolitan area | 150 | 0.64 | 11.10 | $ 16.85 | $ 35,040 |
| Kansas nonmetropolitan area | 140 | 0.37 | 6.49 | $ 22.13 | $ 46,020 |
| North Northeastern Ohio nonmetropolitan area (noncontiguous) | 130 | 0.43 | 7.39 | $ 18.55 | $ 38,570 |
| Southeast Iowa nonmetropolitan area | 110 | 0.50 | 8.73 | $ 21.22 | $ 44,140 |
| West Arkansas nonmetropolitan area | 90 | 1.06 | 18.47 | $ 19.06 | $ 39,640 |
Nonmetropolitan areas with the highest concentration of jobs and location quotients in Cooling and Freezing Equipment Operators and Tenders:
| Nonmetropolitan area | Employment (1) | Employment per thousand jobs | Location quotient (9) | Hourly mean wage | Annual mean wage (2) |
|---|---|---|---|---|---|
| West Arkansas nonmetropolitan area | 90 | 1.06 | 18.47 | $ 19.06 | $ 39,640 |
| Southeast Coastal North Carolina nonmetropolitan area | 150 | 0.64 | 11.10 | $ 16.85 | $ 35,040 |
| Southeast Mississippi nonmetropolitan area | 80 | 0.55 | 9.60 | $ 18.48 | $ 38,440 |
| Northwest Iowa nonmetropolitan area | 70 | 0.55 | 9.58 | $ 19.27 | $ 40,090 |
| Eastern Oregon nonmetropolitan area | 40 | 0.52 | 9.00 | $ 18.21 | $ 37,880 |
Top paying nonmetropolitan areas for Cooling and Freezing Equipment Operators and Tenders:
| Nonmetropolitan area | Employment (1) | Employment per thousand jobs | Location quotient (9) | Hourly mean wage | Annual mean wage (2) |
|---|---|---|---|---|---|
| Southeast Minnesota nonmetropolitan area | (8) | (8) | (8) | $ 24.01 | $ 49,940 |
| Kansas nonmetropolitan area | 140 | 0.37 | 6.49 | $ 22.13 | $ 46,020 |
| North Arkansas nonmetropolitan area | 40 | 0.34 | 5.97 | $ 21.93 | $ 45,620 |
| West Tennessee nonmetropolitan area | 30 | 0.27 | 4.71 | $ 21.24 | $ 44,180 |
| Southeast Iowa nonmetropolitan area | 110 | 0.50 | 8.73 | $ 21.22 | $ 44,140 |
These estimates are calculated with data collected from employers in all industry sectors, all metropolitan and nonmetropolitan areas, and all states and the District of Columbia. The top employment and wage figures are provided above. The complete list is available in the downloadable XLS files.
The percentile wage estimate is the value of a wage below which a certain percent of workers fall. The median wage is the 50th percentile wage estimate—50 percent of workers earn less than the median and 50 percent of workers earn more than the median. More about percentile wages.
(1) Estimates for detailed occupations do not sum to the totals because the totals include occupations not shown separately. Estimates do not include self-employed workers.
(2) Annual wages have been calculated by multiplying the hourly mean wage by a "year-round, full-time" hours figure of 2,080 hours; for those occupations where there is not an hourly wage published, the annual wage has been directly calculated from the reported survey data.
(3) The relative standard error (RSE) is a measure of the reliability of a survey statistic. The smaller the relative standard error, the more precise the estimate.
(7) The value is less than .005 percent of industry employment.
(8) Estimate not released.
(9) The location quotient is the ratio of the area concentration of occupational employment to the national average concentration. A location quotient greater than one indicates the occupation has a higher share of employment than average, and a location quotient less than one indicates the occupation is less prevalent in the area than average.
Other OEWS estimates and related information:
May 2020 National Occupational Employment and Wage Estimates
May 2020 State Occupational Employment and Wage Estimates
May 2020 Metropolitan and Nonmetropolitan Area Occupational Employment and Wage Estimates
May 2020 National Industry-Specific Occupational Employment and Wage Estimates
Last Modified Date: March 31, 2021