
An official website of the United States government
An official website of the United States government
The .gov means it's official.
Federal government websites often end in .gov or .mil. Before sharing sensitive information,
make sure you're on a federal government site.
The site is secure.
The
https:// ensures that you are connecting to the official website and that any
information you provide is encrypted and transmitted securely.
Plan, direct, or coordinate the actual distribution or movement of a product or service to the customer. Coordinate sales distribution by establishing sales territories, quotas, and goals and establish training programs for sales representatives. Analyze sales statistics gathered by staff to determine sales potential and inventory requirements and monitor the preferences of customers.
Employment estimate and mean wage estimates for Sales Managers:
| Employment (1) | Employment RSE (3) |
Mean hourly wage |
Mean annual wage (2) |
Wage RSE (3) |
|---|---|---|---|---|
| 453,800 | 1.2 % | $ 68.46 | $ 142,390 | 0.4 % |
Percentile wage estimates for Sales Managers:
| Percentile | 10% | 25% | 50% (Median) |
75% | 90% |
|---|---|---|---|---|---|
| Hourly Wage | $ 29.37 | $ 40.60 | $ 61.30 | $ 83.18 | (5) |
| Annual Wage (2) | $ 61,090 | $ 84,450 | $ 127,490 | $ 173,010 | (5) |
Industries with the highest published employment and wages for Sales Managers are provided. For a list of all industries with employment in Sales Managers, see the Create Customized Tables function.
Industries with the highest levels of employment in Sales Managers:
| Industry | Employment (1) | Percent of industry employment | Hourly mean wage | Annual mean wage (2) |
|---|---|---|---|---|
| Management of Companies and Enterprises | 29,500 | 1.16 | $ 76.21 | $ 158,510 |
| Computer Systems Design and Related Services | 25,280 | 1.12 | $ 84.69 | $ 176,160 |
| Automobile Dealers | 25,160 | 2.06 | $ 64.97 | $ 135,140 |
| Merchant Wholesalers, Durable Goods (4232, 4233, 4235, 4236, 4237, and 4239 only) | 19,310 | 1.41 | $ 67.09 | $ 139,550 |
| Merchant Wholesalers, Nondurable Goods (4244 and 4248 only) | 17,090 | 1.84 | $ 57.35 | $ 119,290 |
Industries with the highest concentration of employment in Sales Managers:
| Industry | Employment (1) | Percent of industry employment | Hourly mean wage | Annual mean wage (2) |
|---|---|---|---|---|
| Merchant Wholesalers, Nondurable Goods (4242 and 4246 only) | 9,800 | 2.61 | $ 81.15 | $ 168,790 |
| Wholesale Electronic Markets and Agents and Brokers | 12,220 | 2.57 | $ 75.38 | $ 156,790 |
| Shoe Stores | 3,640 | 2.22 | $ 28.78 | $ 59,860 |
| Automobile Dealers | 25,160 | 2.06 | $ 64.97 | $ 135,140 |
| Professional and Commercial Equipment and Supplies Merchant Wholesalers | 13,540 | 2.03 | $ 78.52 | $ 163,310 |
Top paying industries for Sales Managers:
| Industry | Employment (1) | Percent of industry employment | Hourly mean wage | Annual mean wage (2) |
|---|---|---|---|---|
| Cable and Other Subscription Programming | 470 | 1.00 | $ 108.89 | $ 226,490 |
| Securities, Commodity Contracts, and Other Financial Investments and Related Activities | 11,080 | 1.16 | $ 105.18 | $ 218,780 |
| Oil and Gas Extraction | 80 | 0.08 | $ 104.97 | $ 218,340 |
| Computer and Peripheral Equipment Manufacturing | 2,340 | 1.50 | $ 96.08 | $ 199,840 |
| Scientific Research and Development Services | 4,350 | 0.55 | $ 94.24 | $ 196,020 |
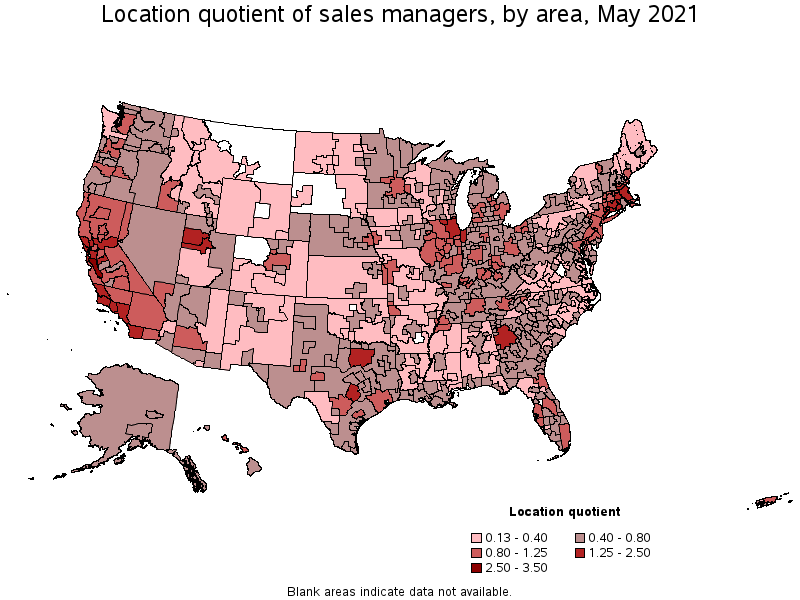
States and areas with the highest published employment, location quotients, and wages for Sales Managers are provided. For a list of all areas with employment in Sales Managers, see the Create Customized Tables function.
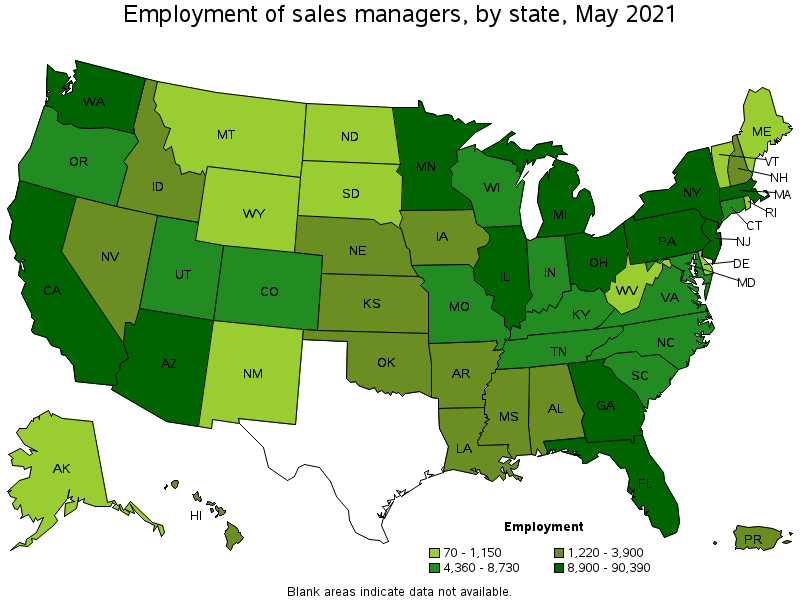
States with the highest employment level in Sales Managers:
| State | Employment (1) | Employment per thousand jobs | Location quotient (9) | Hourly mean wage | Annual mean wage (2) |
|---|---|---|---|---|---|
| California | 90,390 | 5.47 | 1.70 | $ 69.27 | $ 144,090 |
| Illinois | 30,290 | 5.39 | 1.67 | $ 68.49 | $ 142,460 |
| New York | 27,180 | 3.14 | 0.97 | $ 94.03 | $ 195,580 |
| Florida | 24,200 | 2.81 | 0.87 | $ 61.04 | $ 126,960 |
| Massachusetts | 19,770 | 5.82 | 1.81 | $ 73.15 | $ 152,160 |
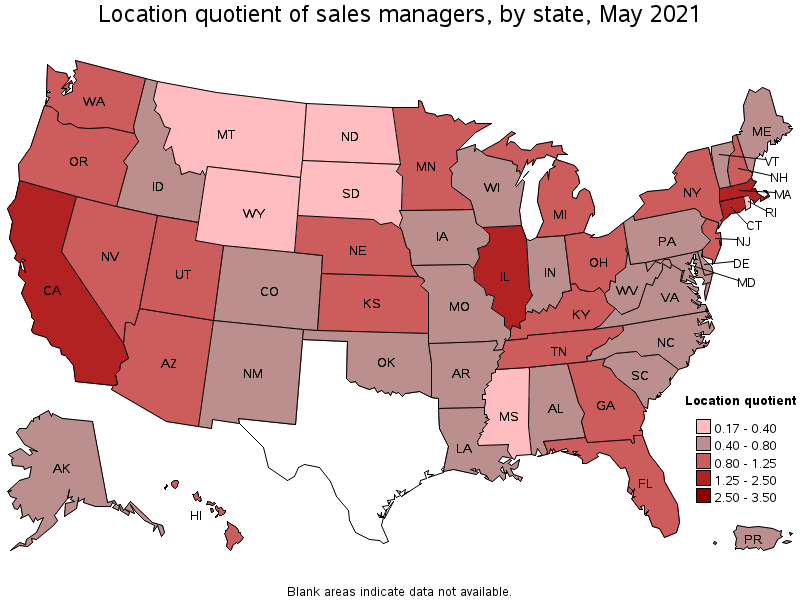
States with the highest concentration of jobs and location quotients in Sales Managers:
| State | Employment (1) | Employment per thousand jobs | Location quotient (9) | Hourly mean wage | Annual mean wage (2) |
|---|---|---|---|---|---|
| Massachusetts | 19,770 | 5.82 | 1.81 | $ 73.15 | $ 152,160 |
| California | 90,390 | 5.47 | 1.70 | $ 69.27 | $ 144,090 |
| Illinois | 30,290 | 5.39 | 1.67 | $ 68.49 | $ 142,460 |
| Connecticut | 8,120 | 5.16 | 1.60 | $ 67.20 | $ 139,770 |
| New Jersey | 14,310 | 3.72 | 1.15 | $ 86.16 | $ 179,220 |
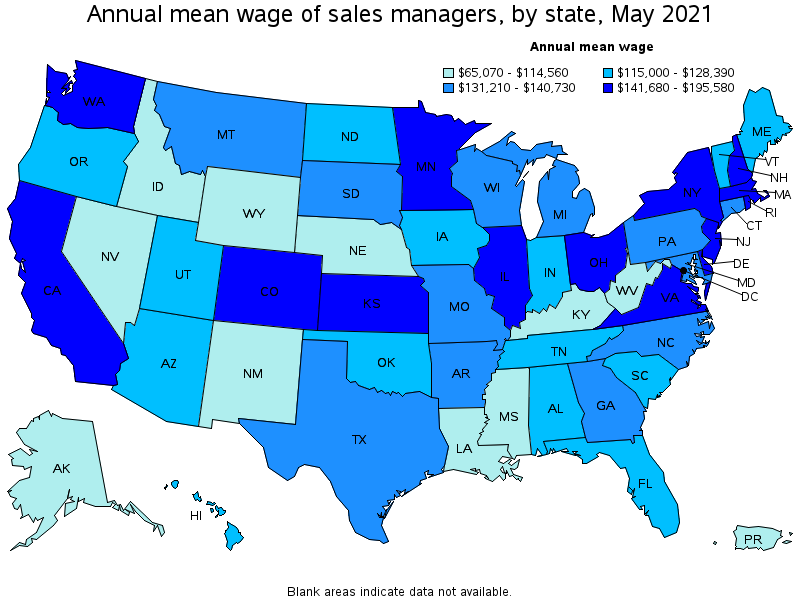
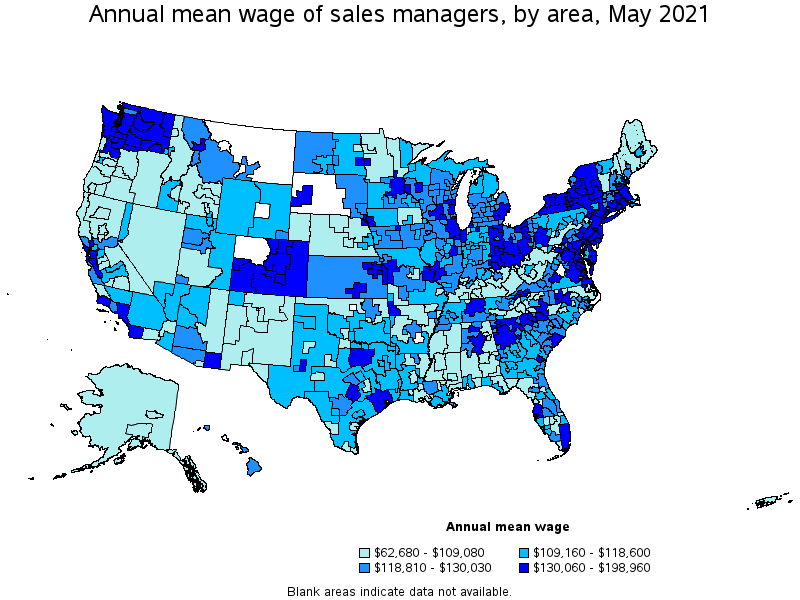
Top paying states for Sales Managers:
| State | Employment (1) | Employment per thousand jobs | Location quotient (9) | Hourly mean wage | Annual mean wage (2) |
|---|---|---|---|---|---|
| New York | 27,180 | 3.14 | 0.97 | $ 94.03 | $ 195,580 |
| Delaware | 930 | 2.14 | 0.67 | $ 89.48 | $ 186,120 |
| New Jersey | 14,310 | 3.72 | 1.15 | $ 86.16 | $ 179,220 |
| Colorado | 6,390 | 2.44 | 0.76 | $ 83.59 | $ 173,860 |
| Virginia | 6,100 | 1.63 | 0.50 | $ 77.88 | $ 161,990 |
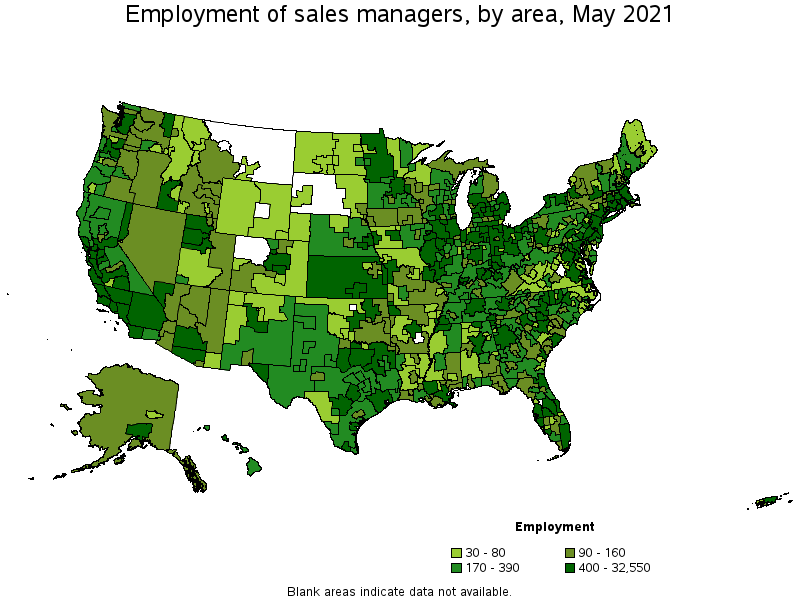
Metropolitan areas with the highest employment level in Sales Managers:
| Metropolitan area | Employment (1) | Employment per thousand jobs | Location quotient (9) | Hourly mean wage | Annual mean wage (2) |
|---|---|---|---|---|---|
| New York-Newark-Jersey City, NY-NJ-PA | 32,550 | 3.75 | 1.16 | $ 95.65 | $ 198,960 |
| Los Angeles-Long Beach-Anaheim, CA | 31,390 | 5.49 | 1.70 | $ 64.31 | $ 133,760 |
| Chicago-Naperville-Elgin, IL-IN-WI | 23,660 | 5.59 | 1.74 | $ 70.46 | $ 146,560 |
| Dallas-Fort Worth-Arlington, TX | 16,220 | 4.52 | 1.40 | $ 65.89 | $ 137,040 |
| San Francisco-Oakland-Hayward, CA | 15,980 | 7.13 | 2.21 | $ 82.92 | $ 172,470 |
| Boston-Cambridge-Nashua, MA-NH | 15,830 | 6.12 | 1.90 | $ 74.87 | $ 155,730 |
| Atlanta-Sandy Springs-Roswell, GA | 10,970 | 4.24 | 1.32 | $ 70.13 | $ 145,860 |
| Houston-The Woodlands-Sugar Land, TX | 10,040 | 3.47 | 1.08 | $ 65.99 | $ 137,260 |
| San Jose-Sunnyvale-Santa Clara, CA | 9,640 | 9.03 | 2.80 | $ 94.67 | $ 196,910 |
| Phoenix-Mesa-Scottsdale, AZ | 8,280 | 3.91 | 1.21 | $ 60.82 | $ 126,500 |
Metropolitan areas with the highest concentration of jobs and location quotients in Sales Managers:
| Metropolitan area | Employment (1) | Employment per thousand jobs | Location quotient (9) | Hourly mean wage | Annual mean wage (2) |
|---|---|---|---|---|---|
| San Jose-Sunnyvale-Santa Clara, CA | 9,640 | 9.03 | 2.80 | $ 94.67 | $ 196,910 |
| San Francisco-Oakland-Hayward, CA | 15,980 | 7.13 | 2.21 | $ 82.92 | $ 172,470 |
| Danbury, CT | 460 | 6.29 | 1.95 | $ 62.72 | $ 130,460 |
| Bridgeport-Stamford-Norwalk, CT | 2,310 | 6.16 | 1.91 | $ 75.31 | $ 156,630 |
| Boston-Cambridge-Nashua, MA-NH | 15,830 | 6.12 | 1.90 | $ 74.87 | $ 155,730 |
| Chicago-Naperville-Elgin, IL-IN-WI | 23,660 | 5.59 | 1.74 | $ 70.46 | $ 146,560 |
| Los Angeles-Long Beach-Anaheim, CA | 31,390 | 5.49 | 1.70 | $ 64.31 | $ 133,760 |
| Napa, CA | 370 | 5.36 | 1.66 | $ 70.96 | $ 147,590 |
| Santa Rosa, CA | 1,010 | 5.28 | 1.64 | $ 61.66 | $ 128,250 |
| Oxnard-Thousand Oaks-Ventura, CA | 1,560 | 5.27 | 1.64 | $ 59.59 | $ 123,940 |
Top paying metropolitan areas for Sales Managers:
| Metropolitan area | Employment (1) | Employment per thousand jobs | Location quotient (9) | Hourly mean wage | Annual mean wage (2) |
|---|---|---|---|---|---|
| New York-Newark-Jersey City, NY-NJ-PA | 32,550 | 3.75 | 1.16 | $ 95.65 | $ 198,960 |
| San Jose-Sunnyvale-Santa Clara, CA | 9,640 | 9.03 | 2.80 | $ 94.67 | $ 196,910 |
| Boulder, CO | 510 | 2.79 | 0.87 | $ 87.89 | $ 182,820 |
| Trenton, NJ | 700 | 3.07 | 0.95 | $ 85.31 | $ 177,450 |
| Denver-Aurora-Lakewood, CO | 4,330 | 2.95 | 0.92 | $ 85.30 | $ 177,430 |
| Portsmouth, NH-ME | 250 | 2.86 | 0.89 | $ 83.53 | $ 173,750 |
| Fort Collins, CO | 330 | 2.06 | 0.64 | $ 83.43 | $ 173,530 |
| San Francisco-Oakland-Hayward, CA | 15,980 | 7.13 | 2.21 | $ 82.92 | $ 172,470 |
| Seattle-Tacoma-Bellevue, WA | 6,670 | 3.48 | 1.08 | $ 80.98 | $ 168,450 |
| Manchester, NH | 370 | 3.52 | 1.09 | $ 80.38 | $ 167,190 |
Nonmetropolitan areas with the highest employment in Sales Managers:
| Nonmetropolitan area | Employment (1) | Employment per thousand jobs | Location quotient (9) | Hourly mean wage | Annual mean wage (2) |
|---|---|---|---|---|---|
| North Texas Region of Texas nonmetropolitan area | 560 | 2.10 | 0.65 | $ 56.22 | $ 116,930 |
| North Northeastern Ohio nonmetropolitan area (noncontiguous) | 550 | 1.74 | 0.54 | $ 59.81 | $ 124,390 |
| Balance of Lower Peninsula of Michigan nonmetropolitan area | 500 | 1.96 | 0.61 | $ 59.70 | $ 124,180 |
| Northwest Illinois nonmetropolitan area | 480 | 3.79 | 1.18 | $ 57.82 | $ 120,270 |
| Kansas nonmetropolitan area | 480 | 1.27 | 0.39 | $ 60.64 | $ 126,140 |
Nonmetropolitan areas with the highest concentration of jobs and location quotients in Sales Managers:
| Nonmetropolitan area | Employment (1) | Employment per thousand jobs | Location quotient (9) | Hourly mean wage | Annual mean wage (2) |
|---|---|---|---|---|---|
| Northwest Illinois nonmetropolitan area | 480 | 3.79 | 1.18 | $ 57.82 | $ 120,270 |
| Connecticut nonmetropolitan area | 120 | 3.71 | 1.15 | $ 59.43 | $ 123,620 |
| North Coast Region of California nonmetropolitan area | 370 | 3.66 | 1.14 | $ 46.59 | $ 96,920 |
| Eastern Sierra-Mother Lode Region of California nonmetropolitan area | 190 | 3.30 | 1.02 | $ 46.03 | $ 95,750 |
| East Central Illinois nonmetropolitan area | 330 | 2.92 | 0.91 | $ 62.51 | $ 130,030 |
Top paying nonmetropolitan areas for Sales Managers:
| Nonmetropolitan area | Employment (1) | Employment per thousand jobs | Location quotient (9) | Hourly mean wage | Annual mean wage (2) |
|---|---|---|---|---|---|
| Eastern Washington nonmetropolitan area | 140 | 1.49 | 0.46 | $ 70.86 | $ 147,400 |
| Eastern and Southern Colorado nonmetropolitan area | 50 | 0.74 | 0.23 | $ 69.23 | $ 143,990 |
| Southwest Colorado nonmetropolitan area | 90 | 0.94 | 0.29 | $ 66.63 | $ 138,600 |
| Northeast Virginia nonmetropolitan area | 40 | 0.81 | 0.25 | $ 66.12 | $ 137,520 |
| Eastern Ohio nonmetropolitan area | 190 | 1.49 | 0.46 | $ 65.95 | $ 137,170 |
These estimates are calculated with data collected from employers in all industry sectors, all metropolitan and nonmetropolitan areas, and all states and the District of Columbia. The top employment and wage figures are provided above. The complete list is available in the downloadable XLS files.
The percentile wage estimate is the value of a wage below which a certain percent of workers fall. The median wage is the 50th percentile wage estimate—50 percent of workers earn less than the median and 50 percent of workers earn more than the median. More about percentile wages.
(1) Estimates for detailed occupations do not sum to the totals because the totals include occupations not shown separately. Estimates do not include self-employed workers.
(2) Annual wages have been calculated by multiplying the hourly mean wage by a "year-round, full-time" hours figure of 2,080 hours; for those occupations where there is not an hourly wage published, the annual wage has been directly calculated from the reported survey data.
(3) The relative standard error (RSE) is a measure of the reliability of a survey statistic. The smaller the relative standard error, the more precise the estimate.
(5) This wage is equal to or greater than $100.00 per hour or $208,000 per year.
(9) The location quotient is the ratio of the area concentration of occupational employment to the national average concentration. A location quotient greater than one indicates the occupation has a higher share of employment than average, and a location quotient less than one indicates the occupation is less prevalent in the area than average.
Other OEWS estimates and related information:
May 2021 National Occupational Employment and Wage Estimates
May 2021 State Occupational Employment and Wage Estimates
May 2021 Metropolitan and Nonmetropolitan Area Occupational Employment and Wage Estimates
May 2021 National Industry-Specific Occupational Employment and Wage Estimates
Last Modified Date: March 31, 2022