
An official website of the United States government
An official website of the United States government
The .gov means it's official.
Federal government websites often end in .gov or .mil. Before sharing sensitive information,
make sure you're on a federal government site.
The site is secure.
The
https:// ensures that you are connecting to the official website and that any
information you provide is encrypted and transmitted securely.
Plan, direct, or coordinate transportation, storage, or distribution activities in accordance with organizational policies and applicable government laws or regulations. Includes logistics managers.
Employment estimate and mean wage estimates for Transportation, Storage, and Distribution Managers:
| Employment (1) | Employment RSE (3) |
Mean hourly wage |
Mean annual wage (2) |
Wage RSE (3) |
|---|---|---|---|---|
| 144,640 | 1.1 % | $ 50.76 | $ 105,580 | 0.6 % |
Percentile wage estimates for Transportation, Storage, and Distribution Managers:
| Percentile | 10% | 25% | 50% (Median) |
75% | 90% |
|---|---|---|---|---|---|
| Hourly Wage | $ 28.16 | $ 36.20 | $ 47.22 | $ 60.87 | $ 78.26 |
| Annual Wage (2) | $ 58,570 | $ 75,290 | $ 98,230 | $ 126,600 | $ 162,770 |
Industries with the highest published employment and wages for Transportation, Storage, and Distribution Managers are provided. For a list of all industries with employment in Transportation, Storage, and Distribution Managers, see the Create Customized Tables function.
Industries with the highest levels of employment in Transportation, Storage, and Distribution Managers:
| Industry | Employment (1) | Percent of industry employment | Hourly mean wage | Annual mean wage (2) |
|---|---|---|---|---|
| Warehousing and Storage | 16,620 | 1.00 | $ 47.61 | $ 99,040 |
| Management of Companies and Enterprises | 11,530 | 0.45 | $ 67.20 | $ 139,770 |
| Truck Transportation | 10,450 | 0.70 | $ 44.98 | $ 93,550 |
| Federal Executive Branch (OEWS Designation) | 6,690 | 0.32 | $ 53.20 | $ 110,650 |
| Local Government, excluding schools and hospitals (OEWS Designation) | 5,730 | 0.11 | $ 51.76 | $ 107,650 |
Industries with the highest concentration of employment in Transportation, Storage, and Distribution Managers:
| Industry | Employment (1) | Percent of industry employment | Hourly mean wage | Annual mean wage (2) |
|---|---|---|---|---|
| Deep Sea, Coastal, and Great Lakes Water Transportation | 1,510 | 4.67 | $ 64.23 | $ 133,600 |
| Automotive Equipment Rental and Leasing | 4,260 | 2.40 | $ 26.55 | $ 55,230 |
| Freight Transportation Arrangement | 4,010 | 1.72 | $ 48.72 | $ 101,330 |
| Support Activities for Water Transportation | 1,440 | 1.61 | $ 54.34 | $ 113,030 |
| Nonscheduled Air Transportation | 560 | 1.16 | $ 66.83 | $ 139,010 |
Top paying industries for Transportation, Storage, and Distribution Managers:
| Industry | Employment (1) | Percent of industry employment | Hourly mean wage | Annual mean wage (2) |
|---|---|---|---|---|
| Computer and Peripheral Equipment Manufacturing | 480 | 0.31 | $ 92.81 | $ 193,050 |
| Scientific Research and Development Services | 1,120 | 0.14 | $ 81.21 | $ 168,920 |
| Pipeline Transportation of Crude Oil | 70 | 0.61 | $ 74.94 | $ 155,880 |
| Semiconductor and Other Electronic Component Manufacturing | 520 | 0.15 | $ 74.12 | $ 154,180 |
| Oil and Gas Extraction | 130 | 0.12 | $ 72.92 | $ 151,670 |
States and areas with the highest published employment, location quotients, and wages for Transportation, Storage, and Distribution Managers are provided. For a list of all areas with employment in Transportation, Storage, and Distribution Managers, see the Create Customized Tables function.
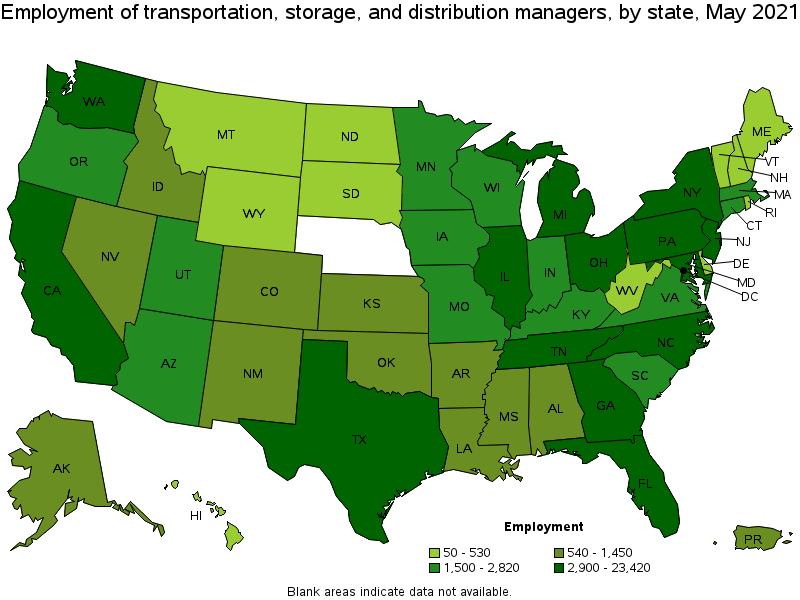
States with the highest employment level in Transportation, Storage, and Distribution Managers:
| State | Employment (1) | Employment per thousand jobs | Location quotient (9) | Hourly mean wage | Annual mean wage (2) |
|---|---|---|---|---|---|
| California | 23,420 | 1.42 | 1.38 | $ 53.07 | $ 110,390 |
| Texas | 13,180 | 1.08 | 1.05 | $ 51.74 | $ 107,620 |
| Illinois | 9,000 | 1.60 | 1.56 | $ 52.17 | $ 108,510 |
| Florida | 8,380 | 0.97 | 0.95 | $ 49.75 | $ 103,480 |
| Ohio | 6,190 | 1.19 | 1.16 | $ 48.43 | $ 100,740 |
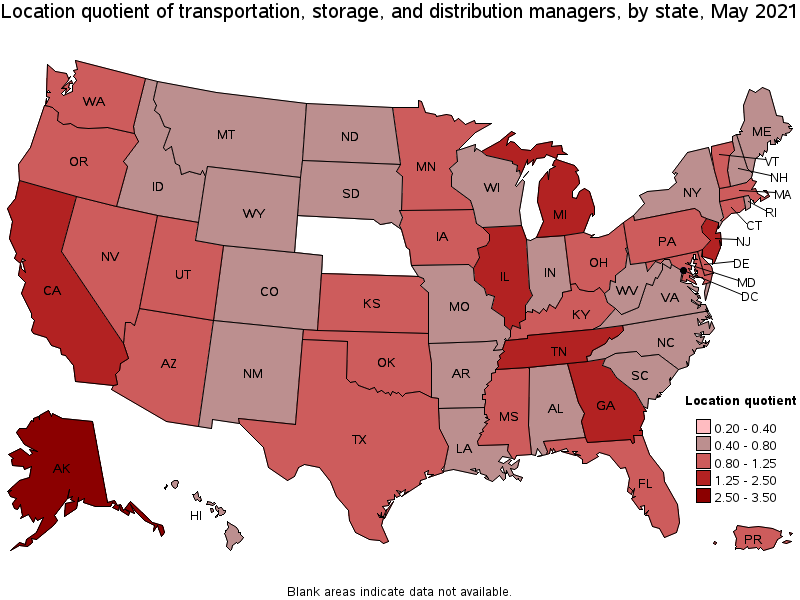
States with the highest concentration of jobs and location quotients in Transportation, Storage, and Distribution Managers:
| State | Employment (1) | Employment per thousand jobs | Location quotient (9) | Hourly mean wage | Annual mean wage (2) |
|---|---|---|---|---|---|
| Alaska | 910 | 3.07 | 2.99 | $ 49.62 | $ 103,220 |
| Illinois | 9,000 | 1.60 | 1.56 | $ 52.17 | $ 108,510 |
| Tennessee | 4,590 | 1.54 | 1.50 | $ 45.19 | $ 93,990 |
| California | 23,420 | 1.42 | 1.38 | $ 53.07 | $ 110,390 |
| Michigan | 5,730 | 1.41 | 1.38 | $ 46.05 | $ 95,790 |
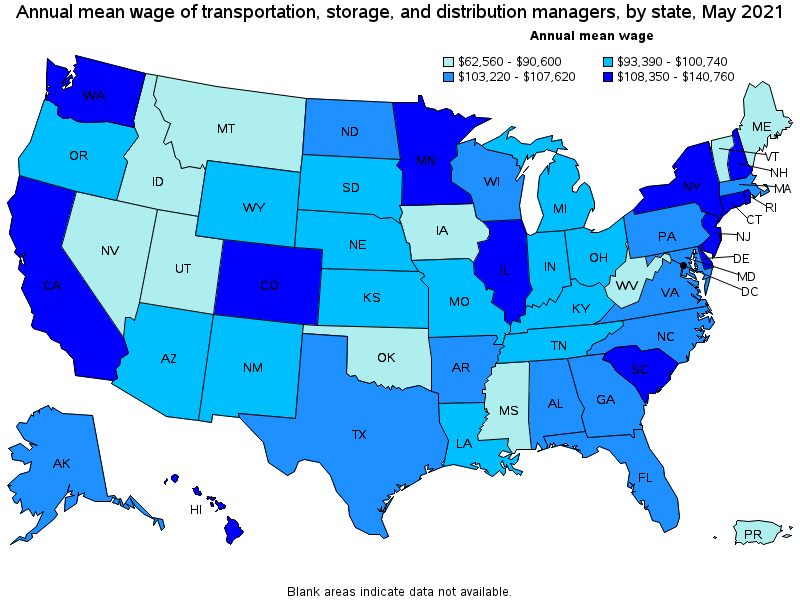
Top paying states for Transportation, Storage, and Distribution Managers:
| State | Employment (1) | Employment per thousand jobs | Location quotient (9) | Hourly mean wage | Annual mean wage (2) |
|---|---|---|---|---|---|
| District of Columbia | 580 | 0.87 | 0.85 | $ 67.67 | $ 140,760 |
| New Jersey | 5,420 | 1.41 | 1.37 | $ 64.89 | $ 134,960 |
| Delaware | 380 | 0.88 | 0.86 | $ 63.12 | $ 131,280 |
| Connecticut | 1,510 | 0.96 | 0.94 | $ 60.74 | $ 126,330 |
| New York | 4,860 | 0.56 | 0.55 | $ 58.02 | $ 120,670 |
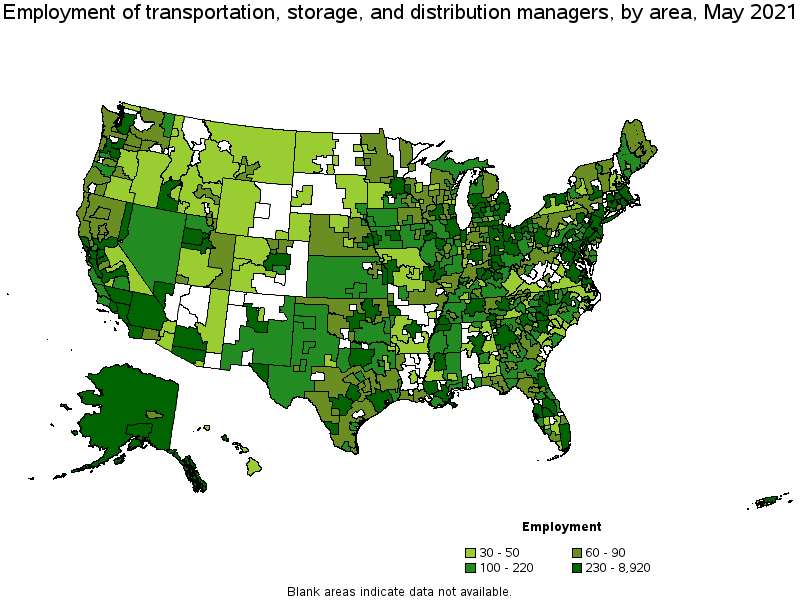
Metropolitan areas with the highest employment level in Transportation, Storage, and Distribution Managers:
| Metropolitan area | Employment (1) | Employment per thousand jobs | Location quotient (9) | Hourly mean wage | Annual mean wage (2) |
|---|---|---|---|---|---|
| Los Angeles-Long Beach-Anaheim, CA | 8,920 | 1.56 | 1.52 | $ 51.94 | $ 108,030 |
| New York-Newark-Jersey City, NY-NJ-PA | 7,020 | 0.81 | 0.79 | $ 64.07 | $ 133,260 |
| Chicago-Naperville-Elgin, IL-IN-WI | 6,630 | 1.57 | 1.52 | $ 53.75 | $ 111,800 |
| Dallas-Fort Worth-Arlington, TX | 4,610 | 1.29 | 1.25 | $ 53.72 | $ 111,740 |
| Atlanta-Sandy Springs-Roswell, GA | 3,580 | 1.38 | 1.35 | $ 53.30 | $ 110,860 |
| Houston-The Woodlands-Sugar Land, TX | 3,540 | 1.22 | 1.19 | $ 54.16 | $ 112,650 |
| San Francisco-Oakland-Hayward, CA | 3,260 | 1.46 | 1.42 | $ 61.06 | $ 127,000 |
| Miami-Fort Lauderdale-West Palm Beach, FL | 3,160 | 1.29 | 1.26 | $ 53.57 | $ 111,420 |
| Riverside-San Bernardino-Ontario, CA | 3,070 | 2.00 | 1.95 | $ 45.57 | $ 94,780 |
| Detroit-Warren-Dearborn, MI | 2,850 | 1.58 | 1.54 | $ 48.07 | $ 99,980 |
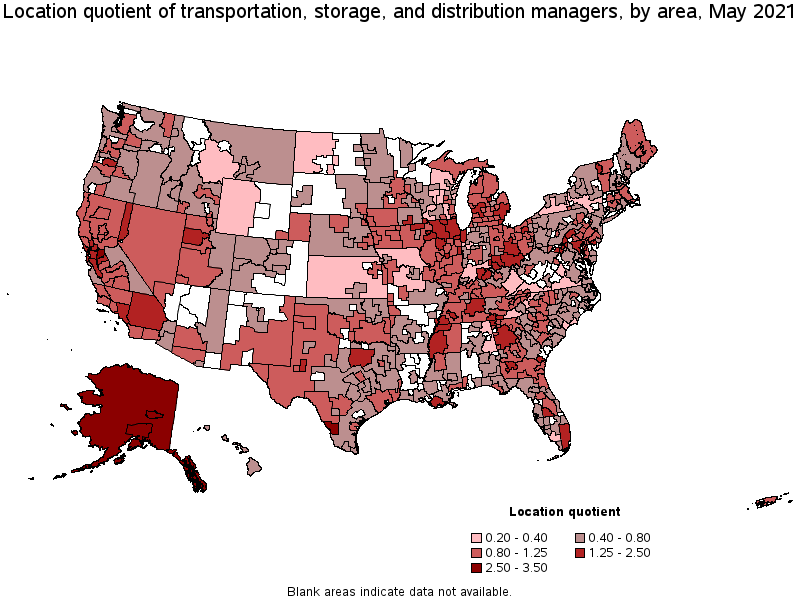
Metropolitan areas with the highest concentration of jobs and location quotients in Transportation, Storage, and Distribution Managers:
| Metropolitan area | Employment (1) | Employment per thousand jobs | Location quotient (9) | Hourly mean wage | Annual mean wage (2) |
|---|---|---|---|---|---|
| Laredo, TX | 340 | 3.52 | 3.43 | $ 38.42 | $ 79,920 |
| Anchorage, AK | 520 | 3.20 | 3.12 | $ 48.83 | $ 101,560 |
| Fairbanks, AK | 90 | 2.69 | 2.62 | $ 49.43 | $ 102,810 |
| Stockton-Lodi, CA | 680 | 2.66 | 2.59 | $ 47.65 | $ 99,100 |
| Midland, MI | 90 | 2.54 | 2.48 | $ 68.06 | $ 141,560 |
| Memphis, TN-MS-AR | 1,460 | 2.42 | 2.36 | $ 46.44 | $ 96,600 |
| Waterloo-Cedar Falls, IA | 200 | 2.38 | 2.32 | $ 46.51 | $ 96,740 |
| Peoria, IL | 360 | 2.29 | 2.23 | $ 58.14 | $ 120,930 |
| Albany, OR | 90 | 2.11 | 2.05 | $ 40.64 | $ 84,520 |
| Hinesville, GA | 40 | 2.10 | 2.04 | $ 40.09 | $ 83,390 |
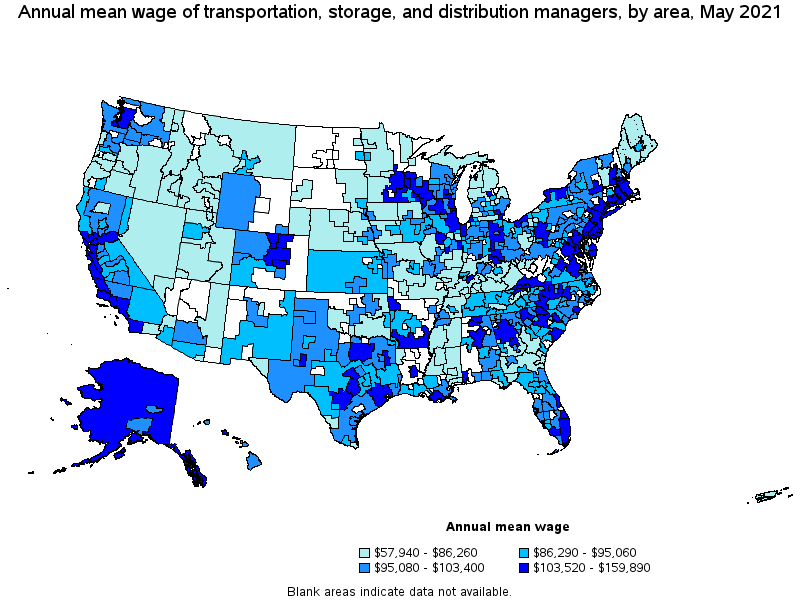
Top paying metropolitan areas for Transportation, Storage, and Distribution Managers:
| Metropolitan area | Employment (1) | Employment per thousand jobs | Location quotient (9) | Hourly mean wage | Annual mean wage (2) |
|---|---|---|---|---|---|
| San Jose-Sunnyvale-Santa Clara, CA | 1,380 | 1.29 | 1.26 | $ 76.87 | $ 159,890 |
| Bridgeport-Stamford-Norwalk, CT | (8) | (8) | (8) | $ 74.12 | $ 154,170 |
| Trenton, NJ | 250 | 1.10 | 1.07 | $ 69.53 | $ 144,620 |
| Midland, MI | 90 | 2.54 | 2.48 | $ 68.06 | $ 141,560 |
| New York-Newark-Jersey City, NY-NJ-PA | 7,020 | 0.81 | 0.79 | $ 64.07 | $ 133,260 |
| Fayetteville-Springdale-Rogers, AR-MO | 270 | 1.12 | 1.09 | $ 61.42 | $ 127,760 |
| Atlantic City-Hammonton, NJ | 60 | 0.48 | 0.47 | $ 61.42 | $ 127,750 |
| San Francisco-Oakland-Hayward, CA | 3,260 | 1.46 | 1.42 | $ 61.06 | $ 127,000 |
| Vineland-Bridgeton, NJ | 80 | 1.44 | 1.41 | $ 60.02 | $ 124,830 |
| Fort Collins, CO | 80 | 0.50 | 0.48 | $ 59.57 | $ 123,910 |
Nonmetropolitan areas with the highest employment in Transportation, Storage, and Distribution Managers:
| Nonmetropolitan area | Employment (1) | Employment per thousand jobs | Location quotient (9) | Hourly mean wage | Annual mean wage (2) |
|---|---|---|---|---|---|
| North Northeastern Ohio nonmetropolitan area (noncontiguous) | 360 | 1.13 | 1.10 | $ 43.71 | $ 90,910 |
| Balance of Lower Peninsula of Michigan nonmetropolitan area | 320 | 1.26 | 1.23 | $ 38.15 | $ 79,350 |
| Alaska nonmetropolitan area | 280 | 2.89 | 2.81 | $ 50.87 | $ 105,800 |
| West Northwestern Ohio nonmetropolitan area | 260 | 1.08 | 1.05 | $ 50.93 | $ 105,940 |
| North Georgia nonmetropolitan area | 220 | 1.27 | 1.24 | $ 49.23 | $ 102,390 |
Nonmetropolitan areas with the highest concentration of jobs and location quotients in Transportation, Storage, and Distribution Managers:
| Nonmetropolitan area | Employment (1) | Employment per thousand jobs | Location quotient (9) | Hourly mean wage | Annual mean wage (2) |
|---|---|---|---|---|---|
| Alaska nonmetropolitan area | 280 | 2.89 | 2.81 | $ 50.87 | $ 105,800 |
| Northwest Mississippi nonmetropolitan area | 120 | 1.40 | 1.37 | $ 34.07 | $ 70,870 |
| Northwest Illinois nonmetropolitan area | 170 | 1.34 | 1.30 | $ 44.64 | $ 92,850 |
| Southern Ohio nonmetropolitan area | 200 | 1.31 | 1.27 | $ 47.22 | $ 98,220 |
| North Georgia nonmetropolitan area | 220 | 1.27 | 1.24 | $ 49.23 | $ 102,390 |
Top paying nonmetropolitan areas for Transportation, Storage, and Distribution Managers:
| Nonmetropolitan area | Employment (1) | Employment per thousand jobs | Location quotient (9) | Hourly mean wage | Annual mean wage (2) |
|---|---|---|---|---|---|
| West Central-Southwest New Hampshire nonmetropolitan area | 50 | 0.55 | 0.53 | $ 61.89 | $ 128,740 |
| Western Wisconsin nonmetropolitan area | 60 | 0.47 | 0.46 | $ 54.36 | $ 113,070 |
| Southwest Virginia nonmetropolitan area | 40 | 0.35 | 0.34 | $ 51.97 | $ 108,100 |
| South Arkansas nonmetropolitan area | 40 | 0.43 | 0.42 | $ 51.60 | $ 107,330 |
| West Northwestern Ohio nonmetropolitan area | 260 | 1.08 | 1.05 | $ 50.93 | $ 105,940 |
These estimates are calculated with data collected from employers in all industry sectors, all metropolitan and nonmetropolitan areas, and all states and the District of Columbia. The top employment and wage figures are provided above. The complete list is available in the downloadable XLS files.
The percentile wage estimate is the value of a wage below which a certain percent of workers fall. The median wage is the 50th percentile wage estimate—50 percent of workers earn less than the median and 50 percent of workers earn more than the median. More about percentile wages.
(1) Estimates for detailed occupations do not sum to the totals because the totals include occupations not shown separately. Estimates do not include self-employed workers.
(2) Annual wages have been calculated by multiplying the hourly mean wage by a "year-round, full-time" hours figure of 2,080 hours; for those occupations where there is not an hourly wage published, the annual wage has been directly calculated from the reported survey data.
(3) The relative standard error (RSE) is a measure of the reliability of a survey statistic. The smaller the relative standard error, the more precise the estimate.
(8) Estimate not released.
(9) The location quotient is the ratio of the area concentration of occupational employment to the national average concentration. A location quotient greater than one indicates the occupation has a higher share of employment than average, and a location quotient less than one indicates the occupation is less prevalent in the area than average.
Other OEWS estimates and related information:
May 2021 National Occupational Employment and Wage Estimates
May 2021 State Occupational Employment and Wage Estimates
May 2021 Metropolitan and Nonmetropolitan Area Occupational Employment and Wage Estimates
May 2021 National Industry-Specific Occupational Employment and Wage Estimates
Last Modified Date: March 31, 2022