
An official website of the United States government
An official website of the United States government
The .gov means it's official.
Federal government websites often end in .gov or .mil. Before sharing sensitive information,
make sure you're on a federal government site.
The site is secure.
The
https:// ensures that you are connecting to the official website and that any
information you provide is encrypted and transmitted securely.
Plan, direct, or coordinate human resources activities and staff of an organization. Excludes managers who primarily focus on compensation and benefits (11-3111) and training and development (11-3131).
Employment estimate and mean wage estimates for Human Resources Managers:
| Employment (1) | Employment RSE (3) |
Mean hourly wage |
Mean annual wage (2) |
Wage RSE (3) |
|---|---|---|---|---|
| 166,530 | 1.4 % | $ 65.67 | $ 136,590 | 0.5 % |
Percentile wage estimates for Human Resources Managers:
| Percentile | 10% | 25% | 50% (Median) |
75% | 90% |
|---|---|---|---|---|---|
| Hourly Wage | $ 36.06 | $ 45.82 | $ 60.69 | $ 78.54 | (5) |
| Annual Wage (2) | $ 75,000 | $ 95,310 | $ 126,230 | $ 163,360 | (5) |
Industries with the highest published employment and wages for Human Resources Managers are provided. For a list of all industries with employment in Human Resources Managers, see the Create Customized Tables function.
Industries with the highest levels of employment in Human Resources Managers:
| Industry | Employment (1) | Percent of industry employment | Hourly mean wage | Annual mean wage (2) |
|---|---|---|---|---|
| Management of Companies and Enterprises | 25,060 | 0.99 | $ 72.96 | $ 151,750 |
| Employment Services | 9,000 | 0.26 | $ 54.55 | $ 113,460 |
| Local Government, excluding schools and hospitals (OEWS Designation) | 7,800 | 0.15 | $ 55.15 | $ 114,710 |
| Computer Systems Design and Related Services | 7,770 | 0.34 | $ 74.26 | $ 154,460 |
| Management, Scientific, and Technical Consulting Services | 7,540 | 0.48 | $ 68.61 | $ 142,710 |
Industries with the highest concentration of employment in Human Resources Managers:
| Industry | Employment (1) | Percent of industry employment | Hourly mean wage | Annual mean wage (2) |
|---|---|---|---|---|
| Management of Companies and Enterprises | 25,060 | 0.99 | $ 72.96 | $ 151,750 |
| Other Information Services | 2,050 | 0.56 | $ 92.76 | $ 192,930 |
| Office Administrative Services | 2,750 | 0.56 | $ 61.24 | $ 127,380 |
| Cable and Other Subscription Programming | 250 | 0.51 | $ 83.42 | $ 173,520 |
| Management, Scientific, and Technical Consulting Services | 7,540 | 0.48 | $ 68.61 | $ 142,710 |
Top paying industries for Human Resources Managers:
| Industry | Employment (1) | Percent of industry employment | Hourly mean wage | Annual mean wage (2) |
|---|---|---|---|---|
| Other Information Services | 2,050 | 0.56 | $ 92.76 | $ 192,930 |
| Scientific Research and Development Services | 3,330 | 0.42 | $ 89.42 | $ 185,990 |
| Computer and Peripheral Equipment Manufacturing | 340 | 0.22 | $ 88.92 | $ 184,950 |
| Radio and Television Broadcasting | 310 | 0.16 | $ 88.75 | $ 184,610 |
| Securities, Commodity Contracts, and Other Financial Investments and Related Activities | 1,960 | 0.20 | $ 87.69 | $ 182,380 |
States and areas with the highest published employment, location quotients, and wages for Human Resources Managers are provided. For a list of all areas with employment in Human Resources Managers, see the Create Customized Tables function.
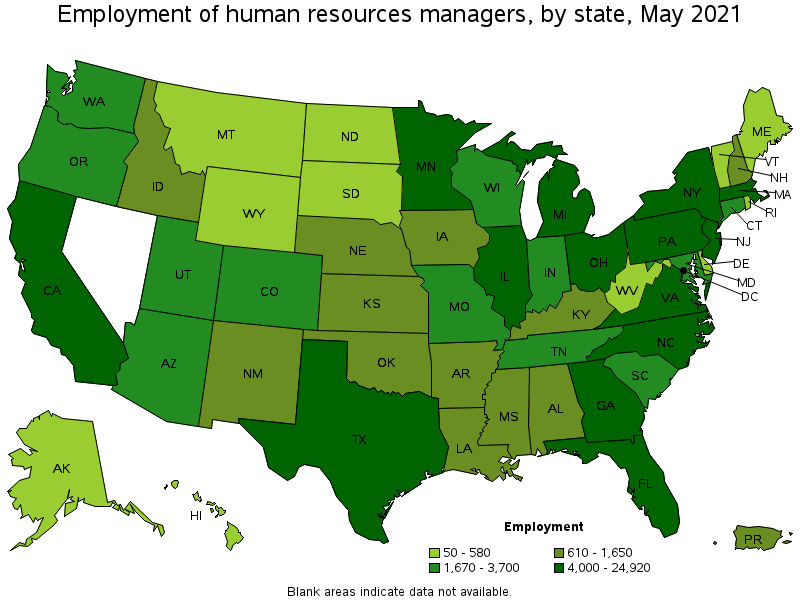
States with the highest employment level in Human Resources Managers:
| State | Employment (1) | Employment per thousand jobs | Location quotient (9) | Hourly mean wage | Annual mean wage (2) |
|---|---|---|---|---|---|
| California | 24,920 | 1.51 | 1.28 | $ 74.25 | $ 154,430 |
| Illinois | 12,210 | 2.17 | 1.84 | $ 61.93 | $ 128,820 |
| Texas | 11,930 | 0.98 | 0.83 | $ 63.60 | $ 132,290 |
| New York | 10,440 | 1.20 | 1.02 | $ 86.72 | $ 180,380 |
| Florida | 7,820 | 0.91 | 0.77 | $ 56.98 | $ 118,520 |
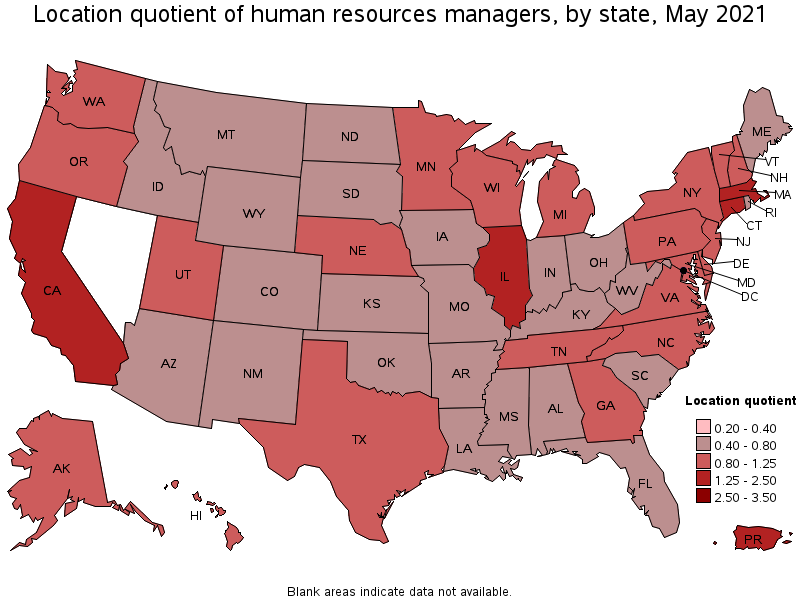
States with the highest concentration of jobs and location quotients in Human Resources Managers:
| State | Employment (1) | Employment per thousand jobs | Location quotient (9) | Hourly mean wage | Annual mean wage (2) |
|---|---|---|---|---|---|
| District of Columbia | 1,990 | 3.01 | 2.54 | $ 78.27 | $ 162,810 |
| Illinois | 12,210 | 2.17 | 1.84 | $ 61.93 | $ 128,820 |
| Connecticut | 3,140 | 1.99 | 1.69 | $ 69.29 | $ 144,130 |
| Massachusetts | 6,540 | 1.93 | 1.63 | $ 77.15 | $ 160,460 |
| California | 24,920 | 1.51 | 1.28 | $ 74.25 | $ 154,430 |
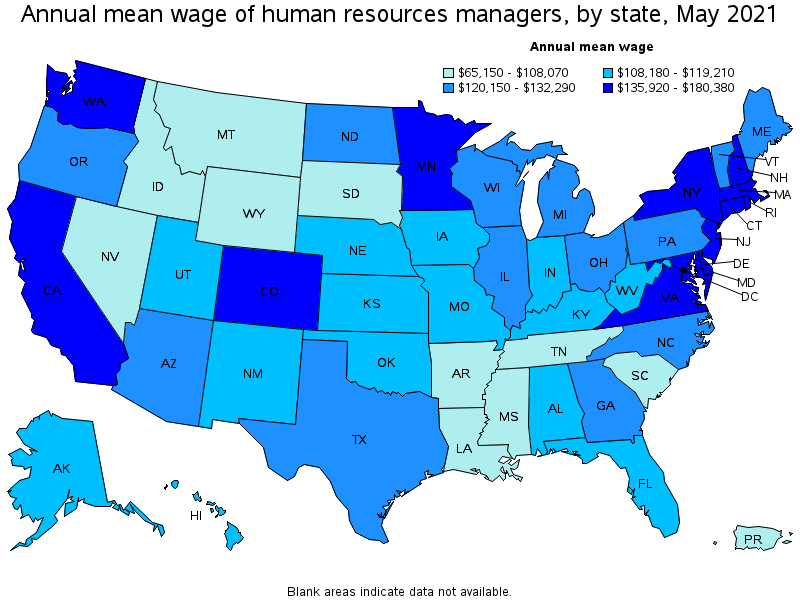
Top paying states for Human Resources Managers:
| State | Employment (1) | Employment per thousand jobs | Location quotient (9) | Hourly mean wage | Annual mean wage (2) |
|---|---|---|---|---|---|
| New York | 10,440 | 1.20 | 1.02 | $ 86.72 | $ 180,380 |
| New Jersey | 4,410 | 1.15 | 0.97 | $ 82.14 | $ 170,850 |
| District of Columbia | 1,990 | 3.01 | 2.54 | $ 78.27 | $ 162,810 |
| Massachusetts | 6,540 | 1.93 | 1.63 | $ 77.15 | $ 160,460 |
| Rhode Island | 350 | 0.76 | 0.65 | $ 75.34 | $ 156,710 |
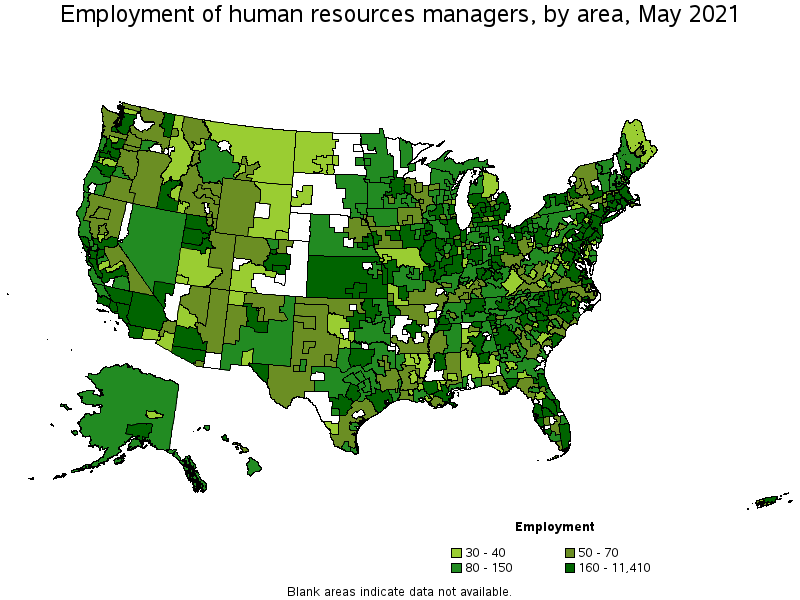
Metropolitan areas with the highest employment level in Human Resources Managers:
| Metropolitan area | Employment (1) | Employment per thousand jobs | Location quotient (9) | Hourly mean wage | Annual mean wage (2) |
|---|---|---|---|---|---|
| New York-Newark-Jersey City, NY-NJ-PA | 11,410 | 1.31 | 1.11 | $ 89.87 | $ 186,930 |
| Chicago-Naperville-Elgin, IL-IN-WI | 9,590 | 2.27 | 1.92 | $ 64.85 | $ 134,890 |
| Los Angeles-Long Beach-Anaheim, CA | 8,910 | 1.56 | 1.32 | $ 72.46 | $ 150,720 |
| Washington-Arlington-Alexandria, DC-VA-MD-WV | 5,620 | 1.92 | 1.62 | $ 77.30 | $ 160,790 |
| Boston-Cambridge-Nashua, MA-NH | 5,580 | 2.16 | 1.83 | $ 79.66 | $ 165,700 |
| San Francisco-Oakland-Hayward, CA | 5,190 | 2.31 | 1.96 | $ 84.33 | $ 175,410 |
| Atlanta-Sandy Springs-Roswell, GA | 4,330 | 1.67 | 1.41 | $ 63.12 | $ 131,300 |
| Dallas-Fort Worth-Arlington, TX | 4,100 | 1.14 | 0.97 | $ 66.77 | $ 138,880 |
| Philadelphia-Camden-Wilmington, PA-NJ-DE-MD | 3,400 | 1.28 | 1.08 | $ 67.47 | $ 140,330 |
| Minneapolis-St. Paul-Bloomington, MN-WI | 3,190 | 1.75 | 1.48 | $ 68.08 | $ 141,600 |
Metropolitan areas with the highest concentration of jobs and location quotients in Human Resources Managers:
| Metropolitan area | Employment (1) | Employment per thousand jobs | Location quotient (9) | Hourly mean wage | Annual mean wage (2) |
|---|---|---|---|---|---|
| San Jose-Sunnyvale-Santa Clara, CA | 2,750 | 2.58 | 2.18 | $ 91.36 | $ 190,020 |
| San Francisco-Oakland-Hayward, CA | 5,190 | 2.31 | 1.96 | $ 84.33 | $ 175,410 |
| Bridgeport-Stamford-Norwalk, CT | 860 | 2.30 | 1.95 | $ 82.22 | $ 171,030 |
| Chicago-Naperville-Elgin, IL-IN-WI | 9,590 | 2.27 | 1.92 | $ 64.85 | $ 134,890 |
| Peoria, IL | 350 | 2.24 | 1.90 | $ 54.94 | $ 114,270 |
| Danbury, CT | 160 | 2.16 | 1.83 | $ 65.87 | $ 137,000 |
| Boston-Cambridge-Nashua, MA-NH | 5,580 | 2.16 | 1.83 | $ 79.66 | $ 165,700 |
| Hartford-West Hartford-East Hartford, CT | 1,110 | 2.04 | 1.72 | $ 67.90 | $ 141,240 |
| Midland, MI | 70 | 1.93 | 1.64 | $ 74.02 | $ 153,950 |
| Washington-Arlington-Alexandria, DC-VA-MD-WV | 5,620 | 1.92 | 1.62 | $ 77.30 | $ 160,790 |
Top paying metropolitan areas for Human Resources Managers:
| Metropolitan area | Employment (1) | Employment per thousand jobs | Location quotient (9) | Hourly mean wage | Annual mean wage (2) |
|---|---|---|---|---|---|
| San Jose-Sunnyvale-Santa Clara, CA | 2,750 | 2.58 | 2.18 | $ 91.36 | $ 190,020 |
| New York-Newark-Jersey City, NY-NJ-PA | 11,410 | 1.31 | 1.11 | $ 89.87 | $ 186,930 |
| San Francisco-Oakland-Hayward, CA | 5,190 | 2.31 | 1.96 | $ 84.33 | $ 175,410 |
| Bridgeport-Stamford-Norwalk, CT | 860 | 2.30 | 1.95 | $ 82.22 | $ 171,030 |
| Boston-Cambridge-Nashua, MA-NH | 5,580 | 2.16 | 1.83 | $ 79.66 | $ 165,700 |
| Trenton, NJ | 400 | 1.76 | 1.49 | $ 78.03 | $ 162,300 |
| Denver-Aurora-Lakewood, CO | 1,570 | 1.07 | 0.90 | $ 77.70 | $ 161,620 |
| Washington-Arlington-Alexandria, DC-VA-MD-WV | 5,620 | 1.92 | 1.62 | $ 77.30 | $ 160,790 |
| Seattle-Tacoma-Bellevue, WA | 2,700 | 1.41 | 1.19 | $ 76.84 | $ 159,830 |
| Ithaca, NY | 50 | 1.03 | 0.87 | $ 75.84 | $ 157,740 |
Nonmetropolitan areas with the highest employment in Human Resources Managers:
| Nonmetropolitan area | Employment (1) | Employment per thousand jobs | Location quotient (9) | Hourly mean wage | Annual mean wage (2) |
|---|---|---|---|---|---|
| West Central Illinois nonmetropolitan area | 230 | 1.46 | 1.24 | $ 46.09 | $ 95,860 |
| Balance of Lower Peninsula of Michigan nonmetropolitan area | 210 | 0.83 | 0.70 | $ 49.28 | $ 102,510 |
| East Central Illinois nonmetropolitan area | 200 | 1.73 | 1.47 | $ 48.84 | $ 101,580 |
| Southeast Iowa nonmetropolitan area | 190 | 0.89 | 0.75 | $ 53.04 | $ 110,330 |
| North Northeastern Ohio nonmetropolitan area (noncontiguous) | 180 | 0.56 | 0.47 | $ 54.19 | $ 112,710 |
Nonmetropolitan areas with the highest concentration of jobs and location quotients in Human Resources Managers:
| Nonmetropolitan area | Employment (1) | Employment per thousand jobs | Location quotient (9) | Hourly mean wage | Annual mean wage (2) |
|---|---|---|---|---|---|
| East Central Illinois nonmetropolitan area | 200 | 1.73 | 1.47 | $ 48.84 | $ 101,580 |
| Connecticut nonmetropolitan area | 50 | 1.60 | 1.35 | $ 52.39 | $ 108,980 |
| West Central Illinois nonmetropolitan area | 230 | 1.46 | 1.24 | $ 46.09 | $ 95,860 |
| Nevada nonmetropolitan area | 140 | 1.46 | 1.23 | $ 49.88 | $ 103,750 |
| Northwest Illinois nonmetropolitan area | 150 | 1.22 | 1.04 | $ 50.20 | $ 104,410 |
Top paying nonmetropolitan areas for Human Resources Managers:
| Nonmetropolitan area | Employment (1) | Employment per thousand jobs | Location quotient (9) | Hourly mean wage | Annual mean wage (2) |
|---|---|---|---|---|---|
| Southwest New York nonmetropolitan area | 100 | 0.60 | 0.51 | $ 77.12 | $ 160,400 |
| Central East New York nonmetropolitan area | 60 | 0.42 | 0.35 | $ 70.01 | $ 145,620 |
| West Central-Southwest New Hampshire nonmetropolitan area | 110 | 1.08 | 0.92 | $ 66.73 | $ 138,800 |
| Capital/Northern New York nonmetropolitan area | 60 | 0.41 | 0.34 | $ 61.35 | $ 127,600 |
| Northeast Maine nonmetropolitan area | 40 | 0.63 | 0.54 | $ 61.11 | $ 127,110 |
These estimates are calculated with data collected from employers in all industry sectors, all metropolitan and nonmetropolitan areas, and all states and the District of Columbia. The top employment and wage figures are provided above. The complete list is available in the downloadable XLS files.
The percentile wage estimate is the value of a wage below which a certain percent of workers fall. The median wage is the 50th percentile wage estimate—50 percent of workers earn less than the median and 50 percent of workers earn more than the median. More about percentile wages.
(1) Estimates for detailed occupations do not sum to the totals because the totals include occupations not shown separately. Estimates do not include self-employed workers.
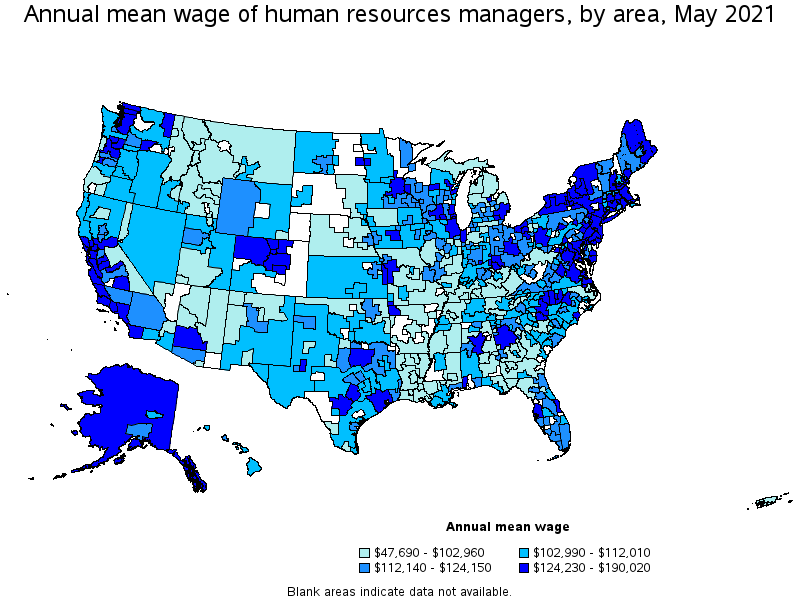
(2) Annual wages have been calculated by multiplying the hourly mean wage by a "year-round, full-time" hours figure of 2,080 hours; for those occupations where there is not an hourly wage published, the annual wage has been directly calculated from the reported survey data.
(3) The relative standard error (RSE) is a measure of the reliability of a survey statistic. The smaller the relative standard error, the more precise the estimate.
(5) This wage is equal to or greater than $100.00 per hour or $208,000 per year.
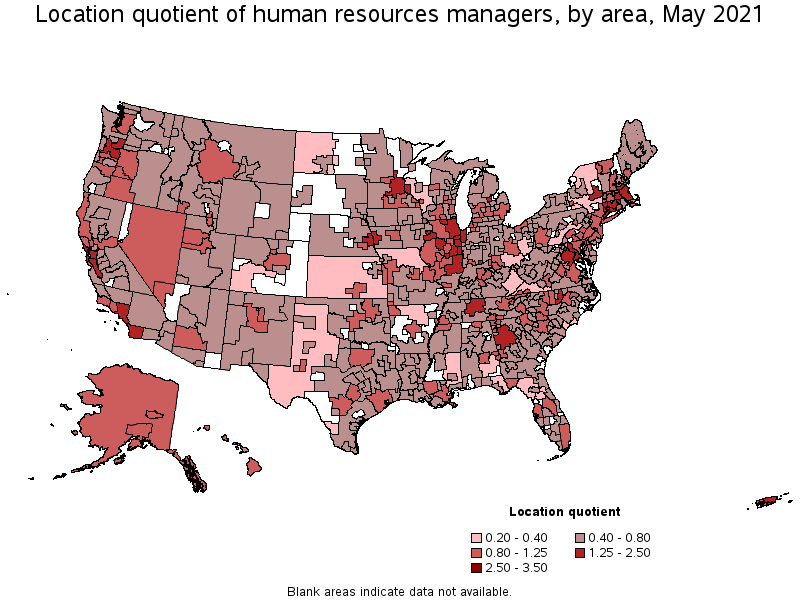
(9) The location quotient is the ratio of the area concentration of occupational employment to the national average concentration. A location quotient greater than one indicates the occupation has a higher share of employment than average, and a location quotient less than one indicates the occupation is less prevalent in the area than average.
Other OEWS estimates and related information:
May 2021 National Occupational Employment and Wage Estimates
May 2021 State Occupational Employment and Wage Estimates
May 2021 Metropolitan and Nonmetropolitan Area Occupational Employment and Wage Estimates
May 2021 National Industry-Specific Occupational Employment and Wage Estimates
Last Modified Date: March 31, 2022