
An official website of the United States government
An official website of the United States government
The .gov means it's official.
Federal government websites often end in .gov or .mil. Before sharing sensitive information,
make sure you're on a federal government site.
The site is secure.
The
https:// ensures that you are connecting to the official website and that any
information you provide is encrypted and transmitted securely.
Examine, evaluate, and investigate eligibility for or conformity with laws and regulations governing contract compliance of licenses and permits, and perform other compliance and enforcement inspection and analysis activities not classified elsewhere. Excludes �Financial Examiners" (13-2061), �Tax Examiners and Collectors, and Revenue Agents� (13-2081), �Occupational Health and Safety Specialists� (19-5011), �Occupational Health and Safety Technicians� (19-5012), �Transportation Security Screeners� (33-9093), �Agricultural Inspectors� (45-2011), �Construction and Building Inspectors� (47-4011), and �Transportation Inspectors� (53-6051).
Employment estimate and mean wage estimates for Compliance Officers:
| Employment (1) | Employment RSE (3) |
Mean hourly wage |
Mean annual wage (2) |
Wage RSE (3) |
|---|---|---|---|---|
| 334,340 | 1.5 % | $ 36.45 | $ 75,810 | 0.5 % |
Percentile wage estimates for Compliance Officers:
| Percentile | 10% | 25% | 50% (Median) |
75% | 90% |
|---|---|---|---|---|---|
| Hourly Wage | $ 18.73 | $ 24.05 | $ 34.45 | $ 46.47 | $ 56.49 |
| Annual Wage (2) | $ 38,950 | $ 50,020 | $ 71,650 | $ 96,660 | $ 117,500 |
Industries with the highest published employment and wages for Compliance Officers are provided. For a list of all industries with employment in Compliance Officers, see the Create Customized Tables function.
Industries with the highest levels of employment in Compliance Officers:
| Industry | Employment (1) | Percent of industry employment | Hourly mean wage | Annual mean wage (2) |
|---|---|---|---|---|
| Federal Executive Branch (OEWS Designation) | 61,840 | 2.93 | $ 42.43 | $ 88,260 |
| State Government, excluding schools and hospitals (OEWS Designation) | 37,580 | 1.71 | $ 29.01 | $ 60,330 |
| Local Government, excluding schools and hospitals (OEWS Designation) | 27,400 | 0.51 | $ 31.56 | $ 65,640 |
| Management of Companies and Enterprises | 19,890 | 0.78 | $ 40.84 | $ 84,940 |
| Insurance Carriers | 11,310 | 0.94 | $ 37.96 | $ 78,960 |
Industries with the highest concentration of employment in Compliance Officers:
| Industry | Employment (1) | Percent of industry employment | Hourly mean wage | Annual mean wage (2) |
|---|---|---|---|---|
| Federal Executive Branch (OEWS Designation) | 61,840 | 2.93 | $ 42.43 | $ 88,260 |
| State Government, excluding schools and hospitals (OEWS Designation) | 37,580 | 1.71 | $ 29.01 | $ 60,330 |
| Lessors of Nonfinancial Intangible Assets (except Copyrighted Works) | 280 | 1.44 | $ 30.43 | $ 63,290 |
| Pharmaceutical and Medicine Manufacturing | 4,120 | 1.31 | $ 42.38 | $ 88,150 |
| Natural Gas Distribution | 1,260 | 1.15 | $ 48.90 | $ 101,710 |
Top paying industries for Compliance Officers:
| Industry | Employment (1) | Percent of industry employment | Hourly mean wage | Annual mean wage (2) |
|---|---|---|---|---|
| Pipeline Transportation of Crude Oil | 110 | 0.92 | $ 57.97 | $ 120,580 |
| Other Information Services | 1,470 | 0.41 | $ 55.14 | $ 114,700 |
| Motion Picture and Video Industries | 250 | 0.08 | $ 52.86 | $ 109,960 |
| Computer and Peripheral Equipment Manufacturing | 210 | 0.14 | $ 52.38 | $ 108,950 |
| Engine, Turbine, and Power Transmission Equipment Manufacturing | 90 | 0.10 | $ 50.58 | $ 105,200 |
States and areas with the highest published employment, location quotients, and wages for Compliance Officers are provided. For a list of all areas with employment in Compliance Officers, see the Create Customized Tables function.
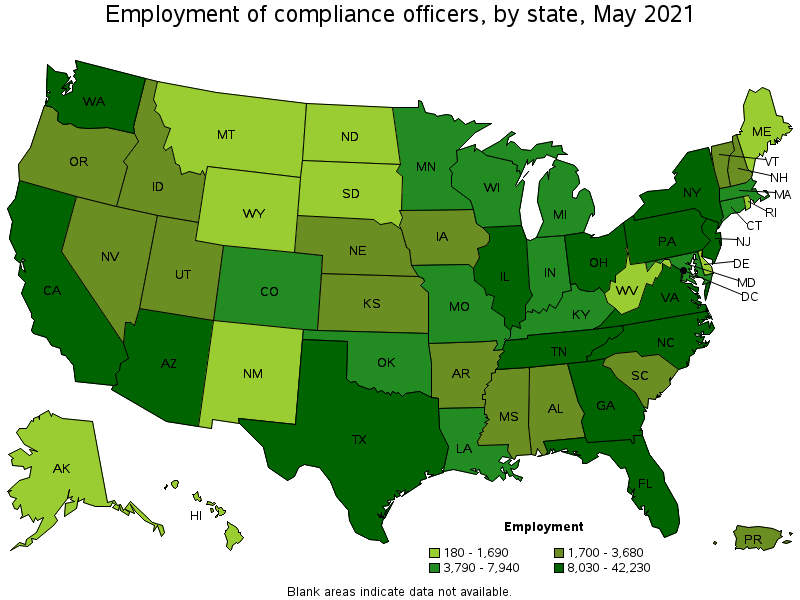
States with the highest employment level in Compliance Officers:
| State | Employment (1) | Employment per thousand jobs | Location quotient (9) | Hourly mean wage | Annual mean wage (2) |
|---|---|---|---|---|---|
| California | 42,230 | 2.55 | 1.08 | $ 41.36 | $ 86,030 |
| Texas | 29,640 | 2.42 | 1.02 | $ 35.14 | $ 73,090 |
| Florida | 25,680 | 2.98 | 1.26 | $ 31.63 | $ 65,780 |
| New York | 20,540 | 2.37 | 1.00 | $ 41.30 | $ 85,900 |
| Georgia | 12,300 | 2.81 | 1.18 | $ 33.66 | $ 70,020 |
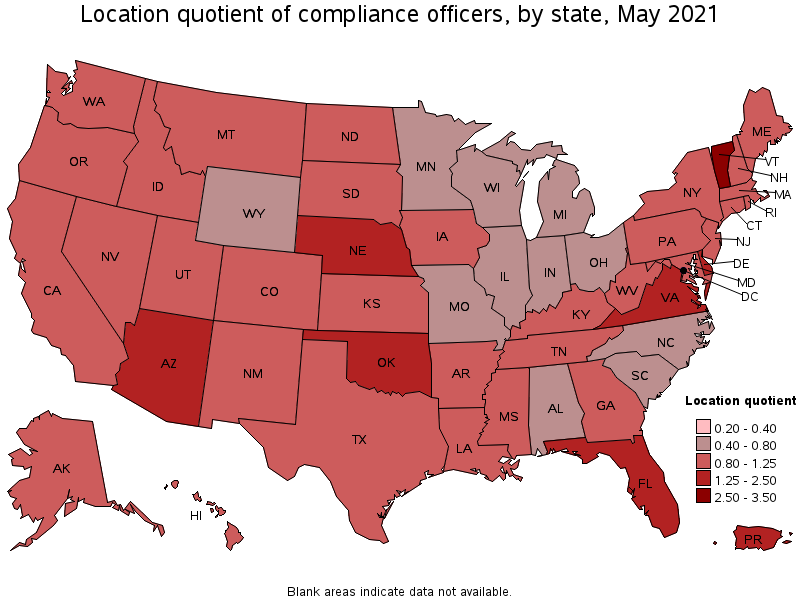
States with the highest concentration of jobs and location quotients in Compliance Officers:
| State | Employment (1) | Employment per thousand jobs | Location quotient (9) | Hourly mean wage | Annual mean wage (2) |
|---|---|---|---|---|---|
| Vermont | 2,000 | 7.03 | 2.96 | $ 36.94 | $ 76,830 |
| District of Columbia | 4,440 | 6.71 | 2.83 | $ 47.47 | $ 98,740 |
| Oklahoma | 5,470 | 3.51 | 1.48 | $ 29.05 | $ 60,420 |
| Nebraska | 3,110 | 3.24 | 1.37 | $ 33.86 | $ 70,420 |
| Arizona | 9,180 | 3.19 | 1.34 | $ 32.54 | $ 67,680 |
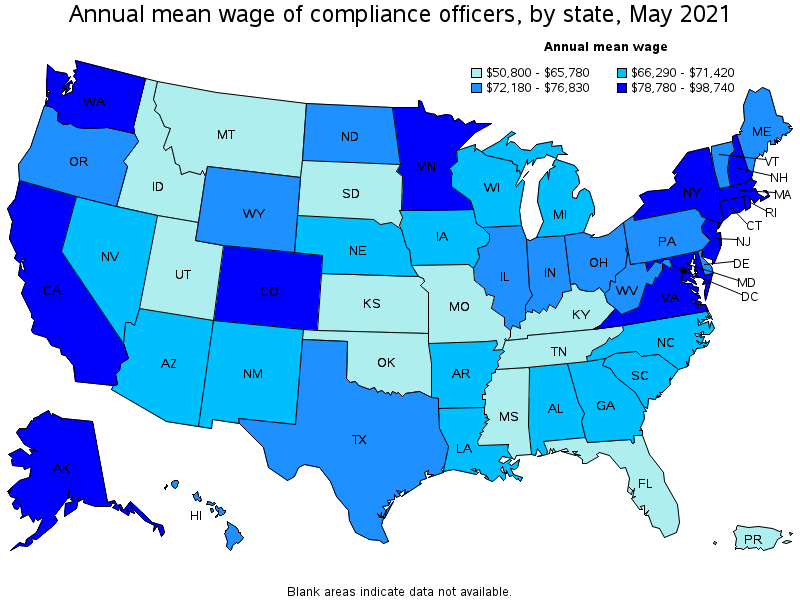
Top paying states for Compliance Officers:
| State | Employment (1) | Employment per thousand jobs | Location quotient (9) | Hourly mean wage | Annual mean wage (2) |
|---|---|---|---|---|---|
| District of Columbia | 4,440 | 6.71 | 2.83 | $ 47.47 | $ 98,740 |
| New Hampshire | 1,770 | 2.79 | 1.18 | $ 47.17 | $ 98,110 |
| New Jersey | 10,480 | 2.72 | 1.15 | $ 44.00 | $ 91,520 |
| Massachusetts | 7,940 | 2.34 | 0.99 | $ 42.15 | $ 87,660 |
| Connecticut | 3,790 | 2.41 | 1.01 | $ 41.64 | $ 86,600 |
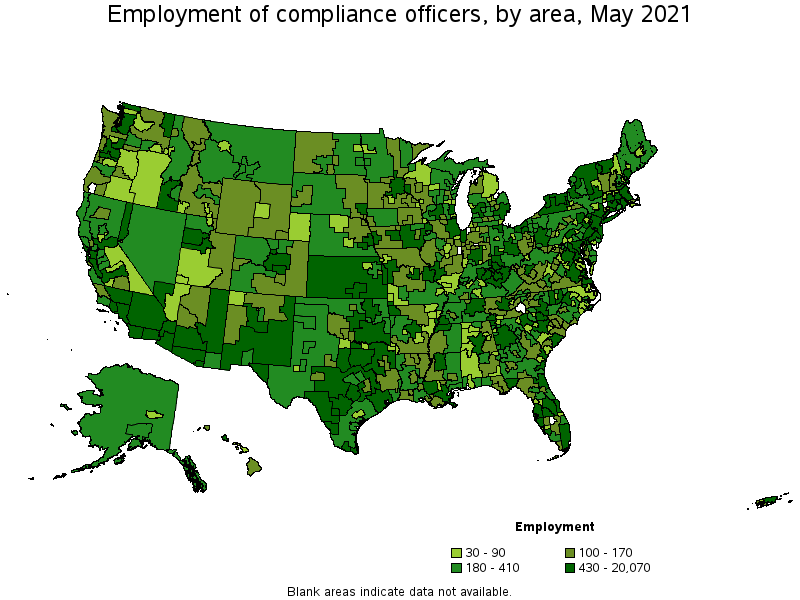
Metropolitan areas with the highest employment level in Compliance Officers:
| Metropolitan area | Employment (1) | Employment per thousand jobs | Location quotient (9) | Hourly mean wage | Annual mean wage (2) |
|---|---|---|---|---|---|
| New York-Newark-Jersey City, NY-NJ-PA | 20,070 | 2.31 | 0.97 | $ 44.93 | $ 93,440 |
| Los Angeles-Long Beach-Anaheim, CA | 14,820 | 2.59 | 1.09 | $ 40.57 | $ 84,390 |
| Washington-Arlington-Alexandria, DC-VA-MD-WV | 12,720 | 4.34 | 1.83 | $ 44.87 | $ 93,340 |
| Miami-Fort Lauderdale-West Palm Beach, FL | 8,890 | 3.62 | 1.53 | $ 34.98 | $ 72,760 |
| Dallas-Fort Worth-Arlington, TX | 8,010 | 2.23 | 0.94 | $ 36.07 | $ 75,030 |
| Atlanta-Sandy Springs-Roswell, GA | 7,930 | 3.06 | 1.29 | $ 35.19 | $ 73,200 |
| Chicago-Naperville-Elgin, IL-IN-WI | 7,020 | 1.66 | 0.70 | $ 38.18 | $ 79,420 |
| San Francisco-Oakland-Hayward, CA | 6,850 | 3.05 | 1.29 | $ 47.82 | $ 99,460 |
| Boston-Cambridge-Nashua, MA-NH | 6,670 | 2.58 | 1.09 | $ 42.86 | $ 89,150 |
| Philadelphia-Camden-Wilmington, PA-NJ-DE-MD | 6,650 | 2.50 | 1.06 | $ 38.99 | $ 81,110 |
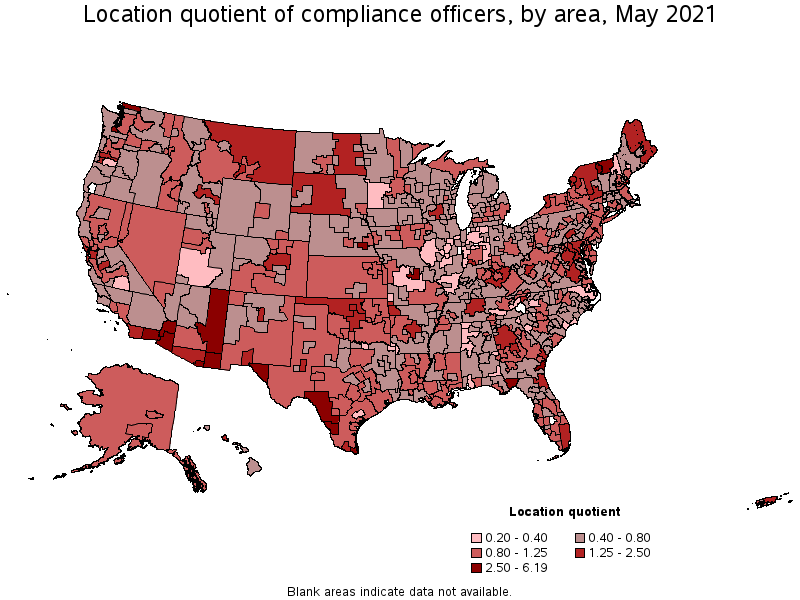
Metropolitan areas with the highest concentration of jobs and location quotients in Compliance Officers:
| Metropolitan area | Employment (1) | Employment per thousand jobs | Location quotient (9) | Hourly mean wage | Annual mean wage (2) |
|---|---|---|---|---|---|
| Brunswick, GA | 600 | 14.70 | 6.19 | $ 44.19 | $ 91,920 |
| Laredo, TX | 1,410 | 14.48 | 6.10 | $ 35.00 | $ 72,810 |
| El Centro, CA | 720 | 12.21 | 5.14 | $ 41.43 | $ 86,170 |
| Burlington-South Burlington, VT | 1,390 | 12.10 | 5.10 | $ 37.83 | $ 78,680 |
| Tallahassee, FL | 1,620 | 9.52 | 4.01 | $ 19.68 | $ 40,930 |
| Jefferson City, MO | 650 | 8.97 | 3.78 | $ 18.78 | $ 39,070 |
| Lincoln, NE | 1,420 | 8.35 | 3.52 | $ 35.06 | $ 72,930 |
| Olympia-Tumwater, WA | 900 | 8.03 | 3.38 | $ 37.06 | $ 77,070 |
| Sierra Vista-Douglas, AZ | 250 | 7.27 | 3.06 | $ 34.33 | $ 71,400 |
| Bellingham, WA | 600 | 7.27 | 3.06 | $ 40.24 | $ 83,690 |
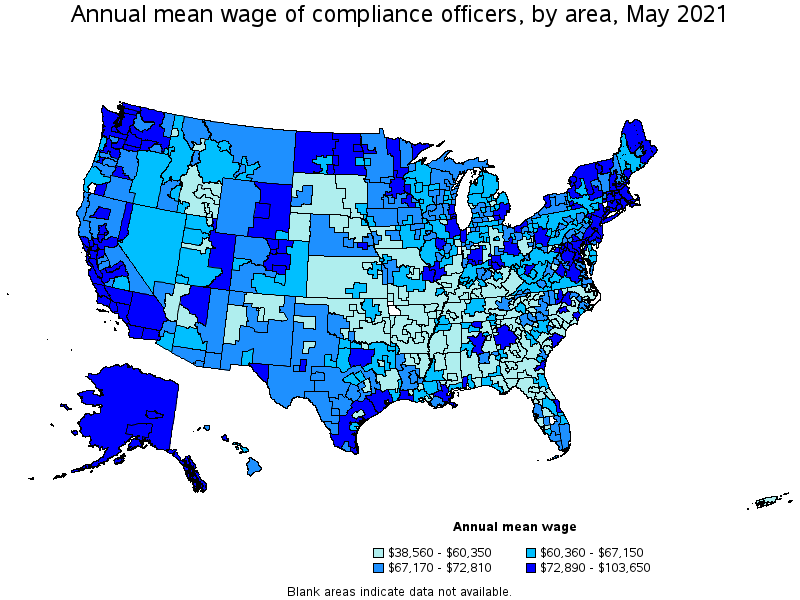
Top paying metropolitan areas for Compliance Officers:
| Metropolitan area | Employment (1) | Employment per thousand jobs | Location quotient (9) | Hourly mean wage | Annual mean wage (2) |
|---|---|---|---|---|---|
| San Jose-Sunnyvale-Santa Clara, CA | 2,590 | 2.42 | 1.02 | $ 49.83 | $ 103,650 |
| San Francisco-Oakland-Hayward, CA | 6,850 | 3.05 | 1.29 | $ 47.82 | $ 99,460 |
| California-Lexington Park, MD | 90 | 1.96 | 0.83 | $ 46.17 | $ 96,030 |
| Bridgeport-Stamford-Norwalk, CT | 1,080 | 2.89 | 1.22 | $ 45.14 | $ 93,890 |
| Columbus, IN | 70 | 1.55 | 0.65 | $ 44.99 | $ 93,570 |
| New York-Newark-Jersey City, NY-NJ-PA | 20,070 | 2.31 | 0.97 | $ 44.93 | $ 93,440 |
| Washington-Arlington-Alexandria, DC-VA-MD-WV | 12,720 | 4.34 | 1.83 | $ 44.87 | $ 93,340 |
| Brunswick, GA | 600 | 14.70 | 6.19 | $ 44.19 | $ 91,920 |
| Boston-Cambridge-Nashua, MA-NH | 6,670 | 2.58 | 1.09 | $ 42.86 | $ 89,150 |
| Durham-Chapel Hill, NC | 620 | 1.99 | 0.84 | $ 42.64 | $ 88,690 |
Nonmetropolitan areas with the highest employment in Compliance Officers:
| Nonmetropolitan area | Employment (1) | Employment per thousand jobs | Location quotient (9) | Hourly mean wage | Annual mean wage (2) |
|---|---|---|---|---|---|
| Arizona nonmetropolitan area | 720 | 7.96 | 3.35 | $ 33.14 | $ 68,930 |
| Kansas nonmetropolitan area | 710 | 1.90 | 0.80 | $ 25.71 | $ 53,470 |
| Capital/Northern New York nonmetropolitan area | 670 | 4.94 | 2.08 | $ 37.06 | $ 77,080 |
| Central Kentucky nonmetropolitan area | 550 | 3.17 | 1.33 | $ 25.05 | $ 52,090 |
| Border Region of Texas nonmetropolitan area | 540 | 9.73 | 4.10 | $ 33.47 | $ 69,610 |
Nonmetropolitan areas with the highest concentration of jobs and location quotients in Compliance Officers:
| Nonmetropolitan area | Employment (1) | Employment per thousand jobs | Location quotient (9) | Hourly mean wage | Annual mean wage (2) |
|---|---|---|---|---|---|
| Border Region of Texas nonmetropolitan area | 540 | 9.73 | 4.10 | $ 33.47 | $ 69,610 |
| Arizona nonmetropolitan area | 720 | 7.96 | 3.35 | $ 33.14 | $ 68,930 |
| Northern Vermont nonmetropolitan area | 510 | 7.79 | 3.28 | $ 35.41 | $ 73,650 |
| West South Dakota nonmetropolitan area | 330 | 5.48 | 2.31 | $ 26.57 | $ 55,270 |
| Capital/Northern New York nonmetropolitan area | 670 | 4.94 | 2.08 | $ 37.06 | $ 77,080 |
Top paying nonmetropolitan areas for Compliance Officers:
| Nonmetropolitan area | Employment (1) | Employment per thousand jobs | Location quotient (9) | Hourly mean wage | Annual mean wage (2) |
|---|---|---|---|---|---|
| West North Dakota nonmetropolitan area | 170 | 1.61 | 0.68 | $ 41.86 | $ 87,060 |
| Alaska nonmetropolitan area | 210 | 2.19 | 0.92 | $ 41.47 | $ 86,250 |
| Northeast Maine nonmetropolitan area | 280 | 4.17 | 1.76 | $ 39.01 | $ 81,150 |
| East North Dakota nonmetropolitan area | 180 | 3.01 | 1.27 | $ 38.43 | $ 79,940 |
| Eastern Utah nonmetropolitan area | 100 | 1.27 | 0.54 | $ 38.11 | $ 79,260 |
These estimates are calculated with data collected from employers in all industry sectors, all metropolitan and nonmetropolitan areas, and all states and the District of Columbia. The top employment and wage figures are provided above. The complete list is available in the downloadable XLS files.
The percentile wage estimate is the value of a wage below which a certain percent of workers fall. The median wage is the 50th percentile wage estimate—50 percent of workers earn less than the median and 50 percent of workers earn more than the median. More about percentile wages.
(1) Estimates for detailed occupations do not sum to the totals because the totals include occupations not shown separately. Estimates do not include self-employed workers.
(2) Annual wages have been calculated by multiplying the hourly mean wage by a "year-round, full-time" hours figure of 2,080 hours; for those occupations where there is not an hourly wage published, the annual wage has been directly calculated from the reported survey data.
(3) The relative standard error (RSE) is a measure of the reliability of a survey statistic. The smaller the relative standard error, the more precise the estimate.
(9) The location quotient is the ratio of the area concentration of occupational employment to the national average concentration. A location quotient greater than one indicates the occupation has a higher share of employment than average, and a location quotient less than one indicates the occupation is less prevalent in the area than average.
Other OEWS estimates and related information:
May 2021 National Occupational Employment and Wage Estimates
May 2021 State Occupational Employment and Wage Estimates
May 2021 Metropolitan and Nonmetropolitan Area Occupational Employment and Wage Estimates
May 2021 National Industry-Specific Occupational Employment and Wage Estimates
Last Modified Date: March 31, 2022