
An official website of the United States government
An official website of the United States government
The .gov means it's official.
Federal government websites often end in .gov or .mil. Before sharing sensitive information,
make sure you're on a federal government site.
The site is secure.
The
https:// ensures that you are connecting to the official website and that any
information you provide is encrypted and transmitted securely.
Research conditions in local, regional, national, or online markets. Gather information to determine potential sales of a product or service, or plan a marketing or advertising campaign. May gather information on competitors, prices, sales, and methods of marketing and distribution. May employ search marketing tactics, analyze web metrics, and develop recommendations to increase search engine ranking and visibility to target markets. Excludes �Web and Digital Interface Designers� (15-1255), �Art Directors� (27-1011), �Graphic Designers� (27-1024), and �Public Relations Specialists� (27-3031).
Employment estimate and mean wage estimates for Market Research Analysts and Marketing Specialists:
| Employment (1) | Employment RSE (3) |
Mean hourly wage |
Mean annual wage (2) |
Wage RSE (3) |
|---|---|---|---|---|
| 727,540 | 1.0 % | $ 36.58 | $ 76,080 | 0.4 % |
Percentile wage estimates for Market Research Analysts and Marketing Specialists:
| Percentile | 10% | 25% | 50% (Median) |
75% | 90% |
|---|---|---|---|---|---|
| Hourly Wage | $ 18.06 | $ 23.27 | $ 30.73 | $ 46.93 | $ 61.69 |
| Annual Wage (2) | $ 37,570 | $ 48,400 | $ 63,920 | $ 97,600 | $ 128,320 |
Industries with the highest published employment and wages for Market Research Analysts and Marketing Specialists are provided. For a list of all industries with employment in Market Research Analysts and Marketing Specialists, see the Create Customized Tables function.
Industries with the highest levels of employment in Market Research Analysts and Marketing Specialists:
| Industry | Employment (1) | Percent of industry employment | Hourly mean wage | Annual mean wage (2) |
|---|---|---|---|---|
| Management, Scientific, and Technical Consulting Services | 84,050 | 5.40 | $ 34.58 | $ 71,930 |
| Management of Companies and Enterprises | 63,840 | 2.51 | $ 42.90 | $ 89,230 |
| Advertising, Public Relations, and Related Services | 36,140 | 8.30 | $ 35.56 | $ 73,960 |
| Computer Systems Design and Related Services | 35,700 | 1.58 | $ 42.98 | $ 89,390 |
| Other Information Services | 20,580 | 5.67 | $ 50.16 | $ 104,330 |
Industries with the highest concentration of employment in Market Research Analysts and Marketing Specialists:
| Industry | Employment (1) | Percent of industry employment | Hourly mean wage | Annual mean wage (2) |
|---|---|---|---|---|
| Advertising, Public Relations, and Related Services | 36,140 | 8.30 | $ 35.56 | $ 73,960 |
| Lessors of Nonfinancial Intangible Assets (except Copyrighted Works) | 1,190 | 6.16 | $ 29.37 | $ 61,090 |
| Other Information Services | 20,580 | 5.67 | $ 50.16 | $ 104,330 |
| Management, Scientific, and Technical Consulting Services | 84,050 | 5.40 | $ 34.58 | $ 71,930 |
| Sound Recording Industries | 830 | 4.74 | $ 31.66 | $ 65,850 |
Top paying industries for Market Research Analysts and Marketing Specialists:
| Industry | Employment (1) | Percent of industry employment | Hourly mean wage | Annual mean wage (2) |
|---|---|---|---|---|
| Aerospace Product and Parts Manufacturing | 1,380 | 0.29 | $ 61.39 | $ 127,700 |
| Monetary Authorities-Central Bank | 100 | 0.47 | $ 60.38 | $ 125,580 |
| Pipeline Transportation of Natural Gas | (8) | (8) | $ 53.93 | $ 112,180 |
| Semiconductor and Other Electronic Component Manufacturing | 2,200 | 0.62 | $ 52.27 | $ 108,720 |
| Other Information Services | 20,580 | 5.67 | $ 50.16 | $ 104,330 |
States and areas with the highest published employment, location quotients, and wages for Market Research Analysts and Marketing Specialists are provided. For a list of all areas with employment in Market Research Analysts and Marketing Specialists, see the Create Customized Tables function.
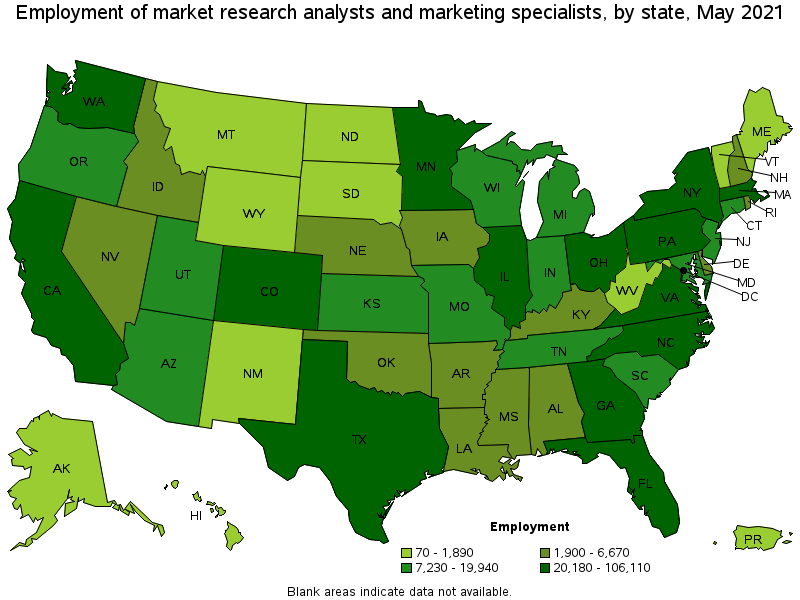
States with the highest employment level in Market Research Analysts and Marketing Specialists:
| State | Employment (1) | Employment per thousand jobs | Location quotient (9) | Hourly mean wage | Annual mean wage (2) |
|---|---|---|---|---|---|
| California | 106,110 | 6.42 | 1.24 | $ 41.90 | $ 87,150 |
| New York | 75,910 | 8.76 | 1.70 | $ 42.74 | $ 88,900 |
| Texas | 44,230 | 3.62 | 0.70 | $ 33.94 | $ 70,600 |
| Florida | 41,210 | 4.79 | 0.93 | $ 32.99 | $ 68,620 |
| Illinois | 34,410 | 6.12 | 1.19 | $ 33.14 | $ 68,920 |
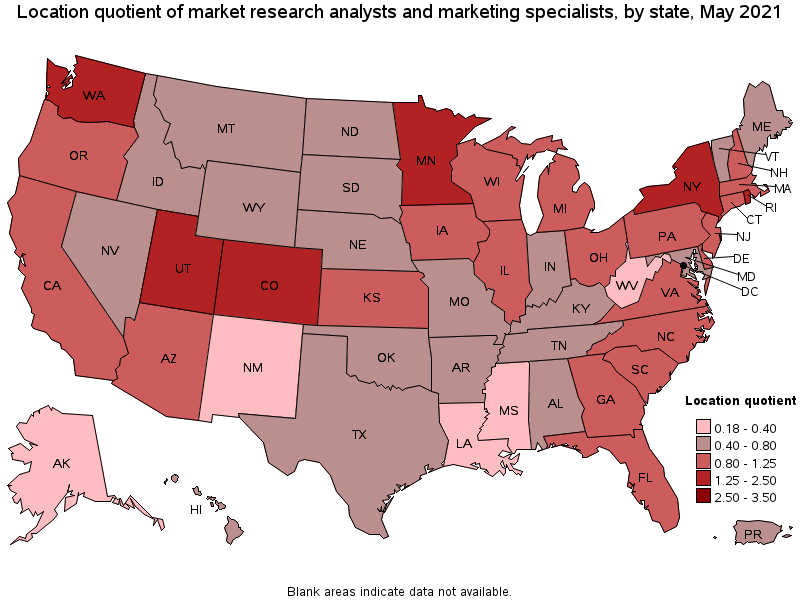
States with the highest concentration of jobs and location quotients in Market Research Analysts and Marketing Specialists:
| State | Employment (1) | Employment per thousand jobs | Location quotient (9) | Hourly mean wage | Annual mean wage (2) |
|---|---|---|---|---|---|
| District of Columbia | 6,090 | 9.20 | 1.78 | $ 42.02 | $ 87,390 |
| Colorado | 23,210 | 8.85 | 1.71 | $ 38.94 | $ 80,980 |
| New York | 75,910 | 8.76 | 1.70 | $ 42.74 | $ 88,900 |
| Minnesota | 20,180 | 7.38 | 1.43 | $ 39.11 | $ 81,360 |
| Washington | 23,480 | 7.32 | 1.42 | $ 44.81 | $ 93,210 |
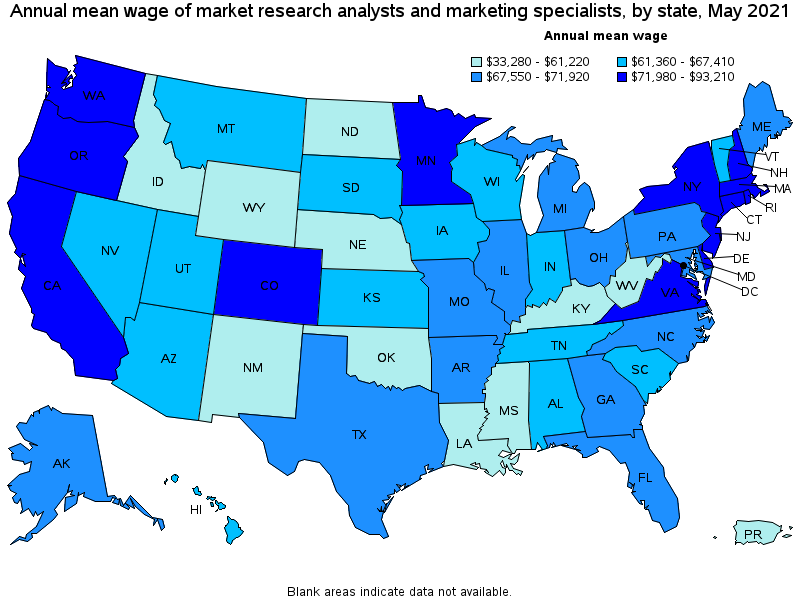
Top paying states for Market Research Analysts and Marketing Specialists:
| State | Employment (1) | Employment per thousand jobs | Location quotient (9) | Hourly mean wage | Annual mean wage (2) |
|---|---|---|---|---|---|
| Washington | 23,480 | 7.32 | 1.42 | $ 44.81 | $ 93,210 |
| Delaware | 2,390 | 5.49 | 1.06 | $ 44.63 | $ 92,840 |
| New York | 75,910 | 8.76 | 1.70 | $ 42.74 | $ 88,900 |
| New Jersey | 19,940 | 5.18 | 1.00 | $ 42.10 | $ 87,570 |
| District of Columbia | 6,090 | 9.20 | 1.78 | $ 42.02 | $ 87,390 |
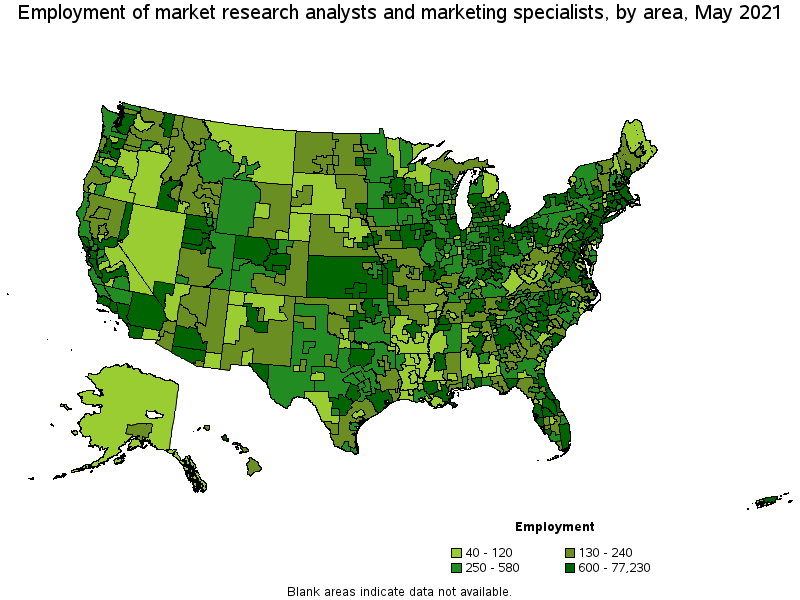
Metropolitan areas with the highest employment level in Market Research Analysts and Marketing Specialists:
| Metropolitan area | Employment (1) | Employment per thousand jobs | Location quotient (9) | Hourly mean wage | Annual mean wage (2) |
|---|---|---|---|---|---|
| New York-Newark-Jersey City, NY-NJ-PA | 77,230 | 8.90 | 1.72 | $ 44.03 | $ 91,580 |
| Los Angeles-Long Beach-Anaheim, CA | 38,240 | 6.69 | 1.29 | $ 36.91 | $ 76,770 |
| Chicago-Naperville-Elgin, IL-IN-WI | 27,890 | 6.59 | 1.28 | $ 34.25 | $ 71,240 |
| San Francisco-Oakland-Hayward, CA | 21,310 | 9.50 | 1.84 | $ 52.10 | $ 108,370 |
| Washington-Arlington-Alexandria, DC-VA-MD-WV | 20,060 | 6.84 | 1.32 | $ 41.56 | $ 86,440 |
| Seattle-Tacoma-Bellevue, WA | 18,730 | 9.77 | 1.89 | $ 47.84 | $ 99,510 |
| Boston-Cambridge-Nashua, MA-NH | 18,280 | 7.07 | 1.37 | $ 38.85 | $ 80,810 |
| Atlanta-Sandy Springs-Roswell, GA | 16,660 | 6.44 | 1.25 | $ 36.43 | $ 75,770 |
| Minneapolis-St. Paul-Bloomington, MN-WI | 16,330 | 8.96 | 1.73 | $ 40.44 | $ 84,110 |
| Dallas-Fort Worth-Arlington, TX | 15,520 | 4.32 | 0.84 | $ 36.32 | $ 75,550 |
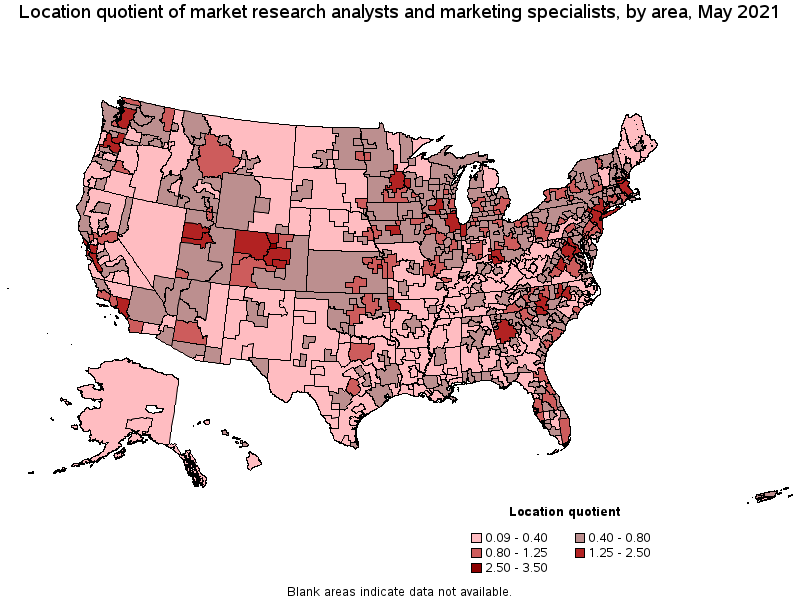
Metropolitan areas with the highest concentration of jobs and location quotients in Market Research Analysts and Marketing Specialists:
| Metropolitan area | Employment (1) | Employment per thousand jobs | Location quotient (9) | Hourly mean wage | Annual mean wage (2) |
|---|---|---|---|---|---|
| Boulder, CO | 2,510 | 13.80 | 2.67 | $ 42.80 | $ 89,020 |
| San Jose-Sunnyvale-Santa Clara, CA | 12,220 | 11.43 | 2.21 | $ 57.30 | $ 119,180 |
| Denver-Aurora-Lakewood, CO | 14,670 | 10.02 | 1.94 | $ 40.76 | $ 84,780 |
| Provo-Orem, UT | 2,730 | 10.01 | 1.94 | $ 27.94 | $ 58,120 |
| Seattle-Tacoma-Bellevue, WA | 18,730 | 9.77 | 1.89 | $ 47.84 | $ 99,510 |
| San Francisco-Oakland-Hayward, CA | 21,310 | 9.50 | 1.84 | $ 52.10 | $ 108,370 |
| Minneapolis-St. Paul-Bloomington, MN-WI | 16,330 | 8.96 | 1.73 | $ 40.44 | $ 84,110 |
| New York-Newark-Jersey City, NY-NJ-PA | 77,230 | 8.90 | 1.72 | $ 44.03 | $ 91,580 |
| Fort Collins, CO | 1,280 | 8.01 | 1.55 | $ 34.17 | $ 71,070 |
| Fayetteville-Springdale-Rogers, AR-MO | 1,950 | 7.97 | 1.54 | $ 39.68 | $ 82,540 |
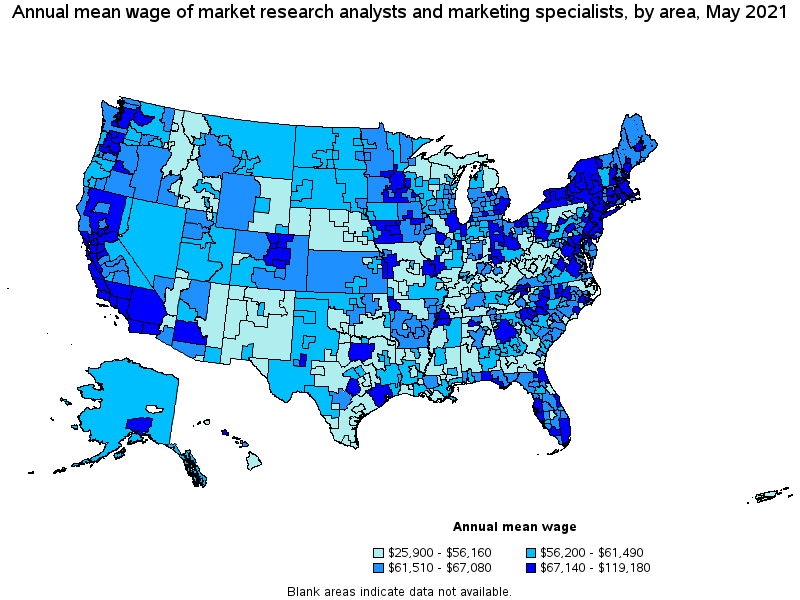
Top paying metropolitan areas for Market Research Analysts and Marketing Specialists:
| Metropolitan area | Employment (1) | Employment per thousand jobs | Location quotient (9) | Hourly mean wage | Annual mean wage (2) |
|---|---|---|---|---|---|
| San Jose-Sunnyvale-Santa Clara, CA | 12,220 | 11.43 | 2.21 | $ 57.30 | $ 119,180 |
| San Francisco-Oakland-Hayward, CA | 21,310 | 9.50 | 1.84 | $ 52.10 | $ 108,370 |
| Seattle-Tacoma-Bellevue, WA | 18,730 | 9.77 | 1.89 | $ 47.84 | $ 99,510 |
| New York-Newark-Jersey City, NY-NJ-PA | 77,230 | 8.90 | 1.72 | $ 44.03 | $ 91,580 |
| Boulder, CO | 2,510 | 13.80 | 2.67 | $ 42.80 | $ 89,020 |
| Durham-Chapel Hill, NC | 2,130 | 6.84 | 1.32 | $ 41.73 | $ 86,800 |
| Washington-Arlington-Alexandria, DC-VA-MD-WV | 20,060 | 6.84 | 1.32 | $ 41.56 | $ 86,440 |
| Trenton, NJ | 1,160 | 5.08 | 0.98 | $ 40.84 | $ 84,950 |
| Denver-Aurora-Lakewood, CO | 14,670 | 10.02 | 1.94 | $ 40.76 | $ 84,780 |
| Minneapolis-St. Paul-Bloomington, MN-WI | 16,330 | 8.96 | 1.73 | $ 40.44 | $ 84,110 |
Nonmetropolitan areas with the highest employment in Market Research Analysts and Marketing Specialists:
| Nonmetropolitan area | Employment (1) | Employment per thousand jobs | Location quotient (9) | Hourly mean wage | Annual mean wage (2) |
|---|---|---|---|---|---|
| Kansas nonmetropolitan area | 1,060 | 2.82 | 0.55 | $ 30.97 | $ 64,410 |
| West Northwestern Ohio nonmetropolitan area | 790 | 3.31 | 0.64 | $ 32.28 | $ 67,140 |
| Southeast Iowa nonmetropolitan area | 780 | 3.73 | 0.72 | $ 31.44 | $ 65,380 |
| Northwest Colorado nonmetropolitan area | 770 | 6.60 | 1.28 | $ 30.73 | $ 63,920 |
| North Northeastern Ohio nonmetropolitan area (noncontiguous) | 760 | 2.42 | 0.47 | $ 31.26 | $ 65,020 |
Nonmetropolitan areas with the highest concentration of jobs and location quotients in Market Research Analysts and Marketing Specialists:
| Nonmetropolitan area | Employment (1) | Employment per thousand jobs | Location quotient (9) | Hourly mean wage | Annual mean wage (2) |
|---|---|---|---|---|---|
| Northwest Colorado nonmetropolitan area | 770 | 6.60 | 1.28 | $ 30.73 | $ 63,920 |
| Southwest Colorado nonmetropolitan area | 490 | 4.95 | 0.96 | $ 29.22 | $ 60,780 |
| Southwest Montana nonmetropolitan area | 580 | 4.16 | 0.81 | $ 31.58 | $ 65,680 |
| Southeast Minnesota nonmetropolitan area | 620 | 4.16 | 0.81 | $ 34.05 | $ 70,820 |
| Mountain North Carolina nonmetropolitan area | 520 | 4.13 | 0.80 | $ 25.42 | $ 52,880 |
Top paying nonmetropolitan areas for Market Research Analysts and Marketing Specialists:
| Nonmetropolitan area | Employment (1) | Employment per thousand jobs | Location quotient (9) | Hourly mean wage | Annual mean wage (2) |
|---|---|---|---|---|---|
| Southwest New York nonmetropolitan area | 510 | 3.07 | 0.59 | $ 35.04 | $ 72,890 |
| Southeast Minnesota nonmetropolitan area | 620 | 4.16 | 0.81 | $ 34.05 | $ 70,820 |
| West Central-Southwest New Hampshire nonmetropolitan area | 280 | 2.90 | 0.56 | $ 32.78 | $ 68,170 |
| Capital/Northern New York nonmetropolitan area | 310 | 2.29 | 0.44 | $ 32.65 | $ 67,910 |
| Central East New York nonmetropolitan area | 520 | 3.46 | 0.67 | $ 32.57 | $ 67,750 |
These estimates are calculated with data collected from employers in all industry sectors, all metropolitan and nonmetropolitan areas, and all states and the District of Columbia. The top employment and wage figures are provided above. The complete list is available in the downloadable XLS files.
The percentile wage estimate is the value of a wage below which a certain percent of workers fall. The median wage is the 50th percentile wage estimate—50 percent of workers earn less than the median and 50 percent of workers earn more than the median. More about percentile wages.
(1) Estimates for detailed occupations do not sum to the totals because the totals include occupations not shown separately. Estimates do not include self-employed workers.
(2) Annual wages have been calculated by multiplying the hourly mean wage by a "year-round, full-time" hours figure of 2,080 hours; for those occupations where there is not an hourly wage published, the annual wage has been directly calculated from the reported survey data.
(3) The relative standard error (RSE) is a measure of the reliability of a survey statistic. The smaller the relative standard error, the more precise the estimate.
(8) Estimate not released.
(9) The location quotient is the ratio of the area concentration of occupational employment to the national average concentration. A location quotient greater than one indicates the occupation has a higher share of employment than average, and a location quotient less than one indicates the occupation is less prevalent in the area than average.
Other OEWS estimates and related information:
May 2021 National Occupational Employment and Wage Estimates
May 2021 State Occupational Employment and Wage Estimates
May 2021 Metropolitan and Nonmetropolitan Area Occupational Employment and Wage Estimates
May 2021 National Industry-Specific Occupational Employment and Wage Estimates
Last Modified Date: March 31, 2022