
An official website of the United States government
An official website of the United States government
The .gov means it's official.
Federal government websites often end in .gov or .mil. Before sharing sensitive information,
make sure you're on a federal government site.
The site is secure.
The
https:// ensures that you are connecting to the official website and that any
information you provide is encrypted and transmitted securely.
Examine budget estimates for completeness, accuracy, and conformance with procedures and regulations. Analyze budgeting and accounting reports. Excludes �Financial and Investment Analysts� (13-2051).
Employment estimate and mean wage estimates for Budget Analysts:
| Employment (1) | Employment RSE (3) |
Mean hourly wage |
Mean annual wage (2) |
Wage RSE (3) |
|---|---|---|---|---|
| 47,440 | 1.2 % | $ 40.50 | $ 84,240 | 0.4 % |
Percentile wage estimates for Budget Analysts:
| Percentile | 10% | 25% | 50% (Median) |
75% | 90% |
|---|---|---|---|---|---|
| Hourly Wage | $ 23.72 | $ 30.17 | $ 38.43 | $ 48.91 | $ 59.83 |
| Annual Wage (2) | $ 49,330 | $ 62,750 | $ 79,940 | $ 101,730 | $ 124,440 |
Industries with the highest published employment and wages for Budget Analysts are provided. For a list of all industries with employment in Budget Analysts, see the Create Customized Tables function.
Industries with the highest levels of employment in Budget Analysts:
| Industry | Employment (1) | Percent of industry employment | Hourly mean wage | Annual mean wage (2) |
|---|---|---|---|---|
| Federal Executive Branch (OEWS Designation) | 11,480 | 0.54 | $ 43.67 | $ 90,830 |
| State Government, excluding schools and hospitals (OEWS Designation) | 5,430 | 0.25 | $ 36.75 | $ 76,430 |
| Local Government, excluding schools and hospitals (OEWS Designation) | 5,300 | 0.10 | $ 38.55 | $ 80,190 |
| Colleges, Universities, and Professional Schools | 3,440 | 0.12 | $ 34.94 | $ 72,670 |
| Management of Companies and Enterprises | 3,170 | 0.12 | $ 42.06 | $ 87,480 |
Industries with the highest concentration of employment in Budget Analysts:
| Industry | Employment (1) | Percent of industry employment | Hourly mean wage | Annual mean wage (2) |
|---|---|---|---|---|
| Monetary Authorities-Central Bank | 160 | 0.77 | $ 43.70 | $ 90,900 |
| Federal Executive Branch (OEWS Designation) | 11,480 | 0.54 | $ 43.67 | $ 90,830 |
| State Government, excluding schools and hospitals (OEWS Designation) | 5,430 | 0.25 | $ 36.75 | $ 76,430 |
| Navigational, Measuring, Electromedical, and Control Instruments Manufacturing | 710 | 0.18 | $ 48.87 | $ 101,640 |
| Pipeline Transportation of Natural Gas | 50 | 0.17 | $ 27.38 | $ 56,940 |
Top paying industries for Budget Analysts:
| Industry | Employment (1) | Percent of industry employment | Hourly mean wage | Annual mean wage (2) |
|---|---|---|---|---|
| Natural Gas Distribution | 40 | 0.03 | $ 57.90 | $ 120,430 |
| Grantmaking and Giving Services | 140 | 0.10 | $ 54.22 | $ 112,770 |
| Traveler Accommodation | 540 | 0.04 | $ 51.28 | $ 106,670 |
| Data Processing, Hosting, and Related Services | 100 | 0.03 | $ 51.09 | $ 106,260 |
| Support Activities for Air Transportation | 50 | 0.03 | $ 49.46 | $ 102,880 |
States and areas with the highest published employment, location quotients, and wages for Budget Analysts are provided. For a list of all areas with employment in Budget Analysts, see the Create Customized Tables function.
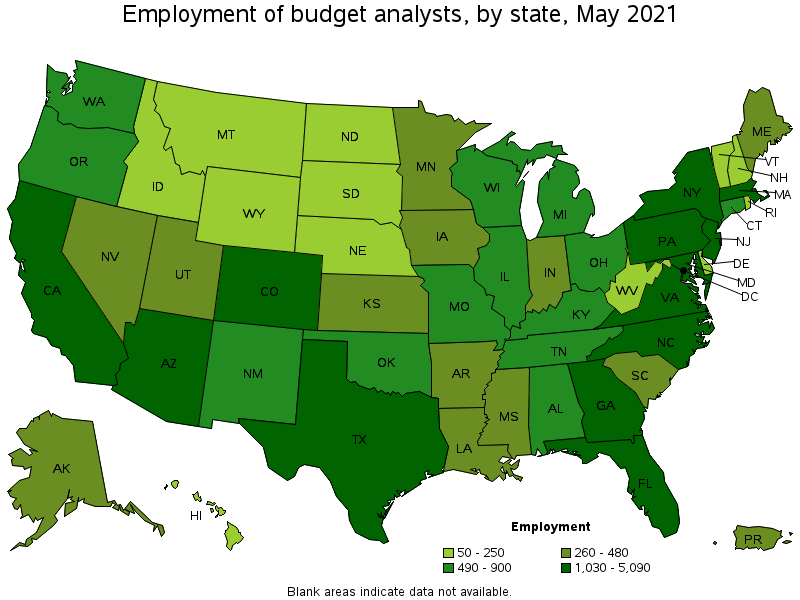
States with the highest employment level in Budget Analysts:
| State | Employment (1) | Employment per thousand jobs | Location quotient (9) | Hourly mean wage | Annual mean wage (2) |
|---|---|---|---|---|---|
| Texas | 5,090 | 0.42 | 1.24 | $ 37.04 | $ 77,030 |
| California | 4,570 | 0.28 | 0.82 | $ 44.91 | $ 93,400 |
| New York | 3,190 | 0.37 | 1.09 | $ 44.80 | $ 93,180 |
| Florida | 2,820 | 0.33 | 0.97 | $ 35.50 | $ 73,840 |
| Virginia | 2,790 | 0.74 | 2.21 | $ 45.65 | $ 94,950 |
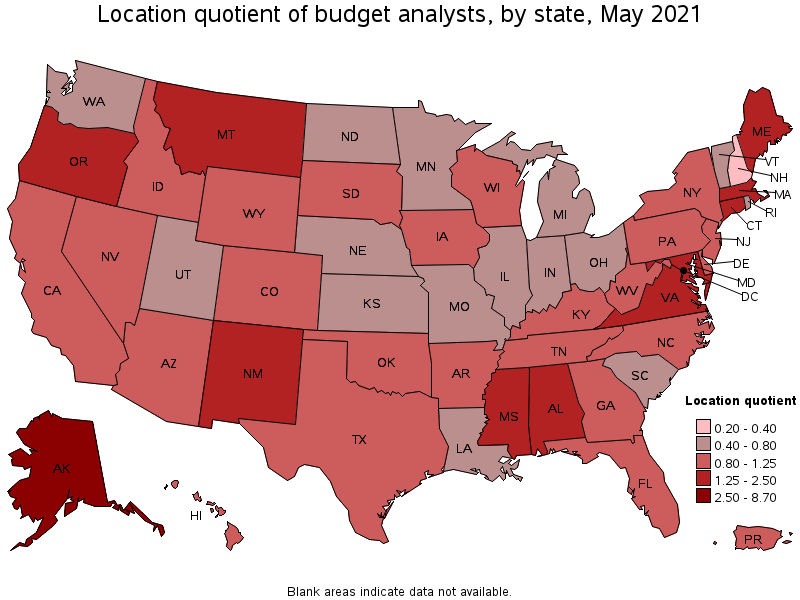
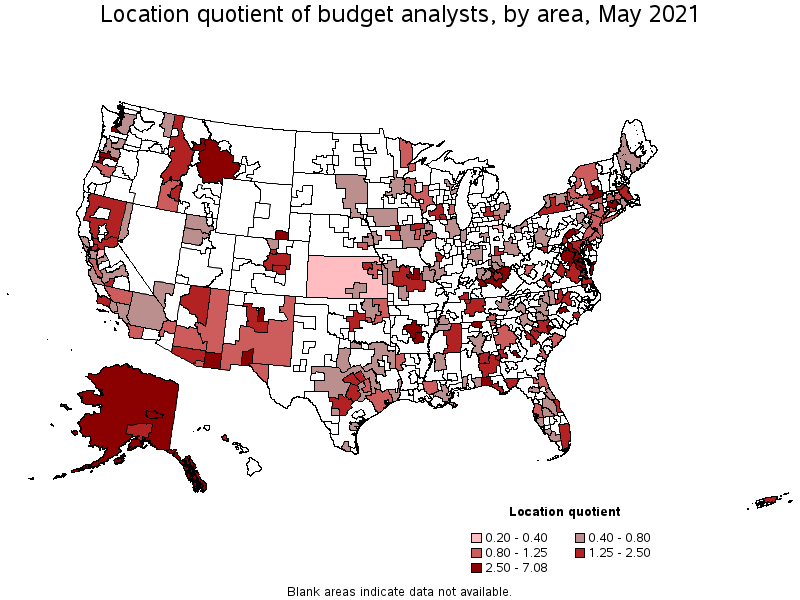
States with the highest concentration of jobs and location quotients in Budget Analysts:
| State | Employment (1) | Employment per thousand jobs | Location quotient (9) | Hourly mean wage | Annual mean wage (2) |
|---|---|---|---|---|---|
| District of Columbia | 1,940 | 2.93 | 8.70 | $ 51.15 | $ 106,380 |
| Alaska | 270 | 0.90 | 2.68 | $ 41.04 | $ 85,370 |
| Maryland | 2,040 | 0.80 | 2.38 | $ 47.92 | $ 99,670 |
| New Mexico | 620 | 0.80 | 2.37 | $ 38.54 | $ 80,160 |
| Virginia | 2,790 | 0.74 | 2.21 | $ 45.65 | $ 94,950 |
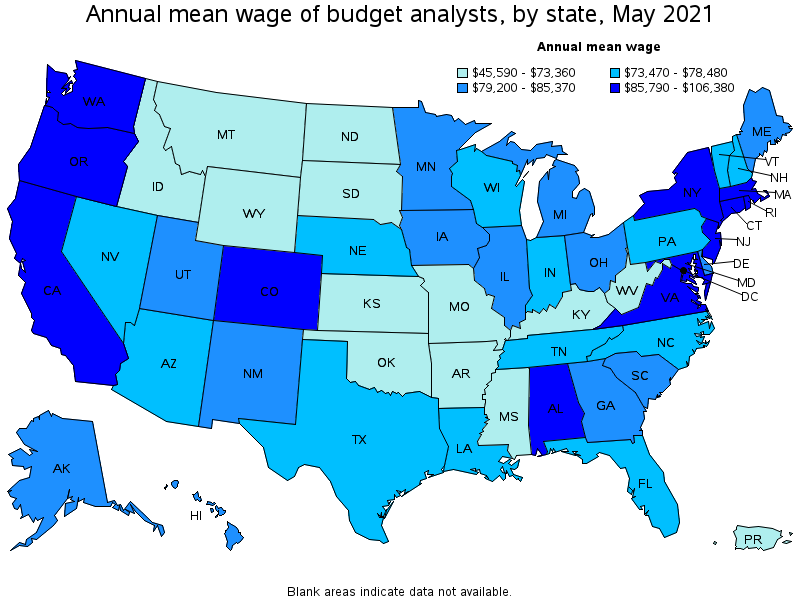
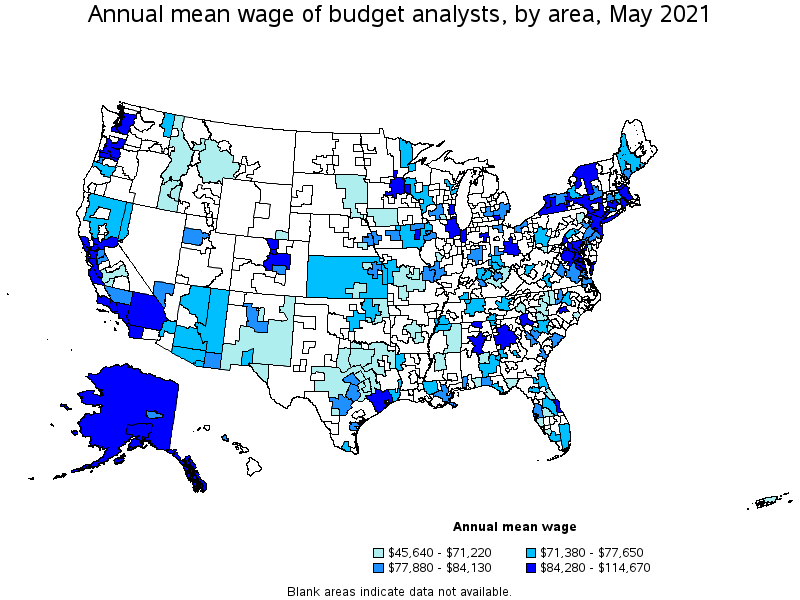
Top paying states for Budget Analysts:
| State | Employment (1) | Employment per thousand jobs | Location quotient (9) | Hourly mean wage | Annual mean wage (2) |
|---|---|---|---|---|---|
| District of Columbia | 1,940 | 2.93 | 8.70 | $ 51.15 | $ 106,380 |
| Maryland | 2,040 | 0.80 | 2.38 | $ 47.92 | $ 99,670 |
| Virginia | 2,790 | 0.74 | 2.21 | $ 45.65 | $ 94,950 |
| New Jersey | 1,030 | 0.27 | 0.80 | $ 45.55 | $ 94,750 |
| California | 4,570 | 0.28 | 0.82 | $ 44.91 | $ 93,400 |
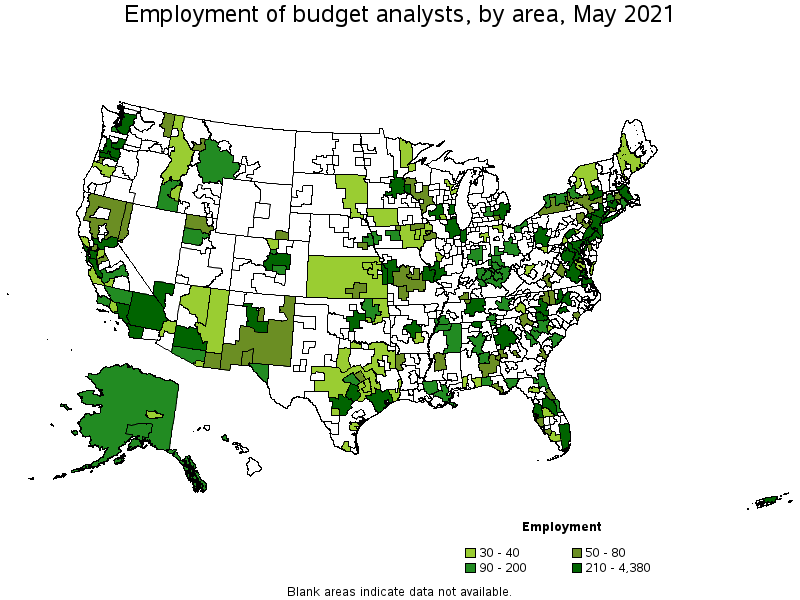
Metropolitan areas with the highest employment level in Budget Analysts:
| Metropolitan area | Employment (1) | Employment per thousand jobs | Location quotient (9) | Hourly mean wage | Annual mean wage (2) |
|---|---|---|---|---|---|
| Washington-Arlington-Alexandria, DC-VA-MD-WV | 4,380 | 1.49 | 4.44 | $ 51.14 | $ 106,380 |
| New York-Newark-Jersey City, NY-NJ-PA | 2,620 | 0.30 | 0.90 | $ 48.28 | $ 100,420 |
| Los Angeles-Long Beach-Anaheim, CA | 1,400 | 0.24 | 0.73 | $ 47.42 | $ 98,640 |
| Boston-Cambridge-Nashua, MA-NH | 1,220 | 0.47 | 1.40 | $ 44.47 | $ 92,500 |
| Miami-Fort Lauderdale-West Palm Beach, FL | 1,050 | 0.43 | 1.27 | $ 35.06 | $ 72,920 |
| Baltimore-Columbia-Towson, MD | 970 | 0.77 | 2.30 | $ 44.35 | $ 92,240 |
| Houston-The Woodlands-Sugar Land, TX | 970 | 0.33 | 0.99 | $ 44.13 | $ 91,780 |
| Atlanta-Sandy Springs-Roswell, GA | 870 | 0.34 | 1.00 | $ 40.52 | $ 84,280 |
| Philadelphia-Camden-Wilmington, PA-NJ-DE-MD | 840 | 0.32 | 0.94 | $ 37.88 | $ 78,790 |
| Austin-Round Rock, TX | 750 | 0.70 | 2.08 | $ 37.68 | $ 78,380 |
Metropolitan areas with the highest concentration of jobs and location quotients in Budget Analysts:
| Metropolitan area | Employment (1) | Employment per thousand jobs | Location quotient (9) | Hourly mean wage | Annual mean wage (2) |
|---|---|---|---|---|---|
| Carson City, NV | 70 | 2.38 | 7.08 | $ 37.17 | $ 77,310 |
| Huntsville, AL | 510 | 2.20 | 6.53 | $ 49.10 | $ 102,120 |
| Corvallis, OR | 70 | 1.90 | 5.64 | $ 38.37 | $ 79,800 |
| Elizabethtown-Fort Knox, KY | 100 | 1.84 | 5.47 | $ 37.44 | $ 77,880 |
| Fayetteville, NC | 210 | 1.67 | 4.95 | $ 41.16 | $ 85,610 |
| Salem, OR | 280 | 1.66 | 4.92 | $ 43.37 | $ 90,210 |
| Sierra Vista-Douglas, AZ | 60 | 1.65 | 4.90 | $ 38.53 | $ 80,140 |
| Olympia-Tumwater, WA | 170 | 1.55 | 4.61 | $ 40.81 | $ 84,880 |
| Washington-Arlington-Alexandria, DC-VA-MD-WV | 4,380 | 1.49 | 4.44 | $ 51.14 | $ 106,380 |
| Ames, IA | 70 | 1.46 | 4.35 | $ 34.83 | $ 72,440 |
Top paying metropolitan areas for Budget Analysts:
| Metropolitan area | Employment (1) | Employment per thousand jobs | Location quotient (9) | Hourly mean wage | Annual mean wage (2) |
|---|---|---|---|---|---|
| San Jose-Sunnyvale-Santa Clara, CA | 350 | 0.32 | 0.96 | $ 55.13 | $ 114,670 |
| Iowa City, IA | 40 | 0.42 | 1.23 | $ 52.34 | $ 108,870 |
| Washington-Arlington-Alexandria, DC-VA-MD-WV | 4,380 | 1.49 | 4.44 | $ 51.14 | $ 106,380 |
| Huntsville, AL | 510 | 2.20 | 6.53 | $ 49.10 | $ 102,120 |
| Birmingham-Hoover, AL | 90 | 0.19 | 0.56 | $ 48.57 | $ 101,030 |
| New York-Newark-Jersey City, NY-NJ-PA | 2,620 | 0.30 | 0.90 | $ 48.28 | $ 100,420 |
| Los Angeles-Long Beach-Anaheim, CA | 1,400 | 0.24 | 0.73 | $ 47.42 | $ 98,640 |
| San Francisco-Oakland-Hayward, CA | 590 | 0.26 | 0.78 | $ 47.14 | $ 98,050 |
| Salinas, CA | 40 | 0.27 | 0.79 | $ 47.06 | $ 97,880 |
| California-Lexington Park, MD | 50 | 1.13 | 3.37 | $ 46.39 | $ 96,500 |
Nonmetropolitan areas with the highest employment in Budget Analysts:
| Nonmetropolitan area | Employment (1) | Employment per thousand jobs | Location quotient (9) | Hourly mean wage | Annual mean wage (2) |
|---|---|---|---|---|---|
| Central Kentucky nonmetropolitan area | 190 | 1.08 | 3.20 | $ 27.06 | $ 56,280 |
| Northeast Mississippi nonmetropolitan area | 120 | 0.55 | 1.62 | $ 31.63 | $ 65,790 |
| Southwest Montana nonmetropolitan area | 120 | 0.85 | 2.54 | $ 32.62 | $ 67,860 |
| Alaska nonmetropolitan area | 90 | 0.90 | 2.66 | $ 42.86 | $ 89,140 |
| Southwest New York nonmetropolitan area | 80 | 0.50 | 1.49 | $ 44.08 | $ 91,690 |
Nonmetropolitan areas with the highest concentration of jobs and location quotients in Budget Analysts:
| Nonmetropolitan area | Employment (1) | Employment per thousand jobs | Location quotient (9) | Hourly mean wage | Annual mean wage (2) |
|---|---|---|---|---|---|
| Central Kentucky nonmetropolitan area | 190 | 1.08 | 3.20 | $ 27.06 | $ 56,280 |
| Northeast Virginia nonmetropolitan area | 40 | 0.91 | 2.70 | $ 48.35 | $ 100,570 |
| Alaska nonmetropolitan area | 90 | 0.90 | 2.66 | $ 42.86 | $ 89,140 |
| Southwest Montana nonmetropolitan area | 120 | 0.85 | 2.54 | $ 32.62 | $ 67,860 |
| Southeast Alabama nonmetropolitan area | 60 | 0.71 | 2.11 | $ 34.58 | $ 71,930 |
Top paying nonmetropolitan areas for Budget Analysts:
| Nonmetropolitan area | Employment (1) | Employment per thousand jobs | Location quotient (9) | Hourly mean wage | Annual mean wage (2) |
|---|---|---|---|---|---|
| Northeast Virginia nonmetropolitan area | 40 | 0.91 | 2.70 | $ 48.35 | $ 100,570 |
| Central East New York nonmetropolitan area | 50 | 0.34 | 1.02 | $ 45.41 | $ 94,450 |
| Southwest New York nonmetropolitan area | 80 | 0.50 | 1.49 | $ 44.08 | $ 91,690 |
| Capital/Northern New York nonmetropolitan area | 40 | 0.31 | 0.93 | $ 42.89 | $ 89,220 |
| Alaska nonmetropolitan area | 90 | 0.90 | 2.66 | $ 42.86 | $ 89,140 |
These estimates are calculated with data collected from employers in all industry sectors, all metropolitan and nonmetropolitan areas, and all states and the District of Columbia. The top employment and wage figures are provided above. The complete list is available in the downloadable XLS files.
The percentile wage estimate is the value of a wage below which a certain percent of workers fall. The median wage is the 50th percentile wage estimate—50 percent of workers earn less than the median and 50 percent of workers earn more than the median. More about percentile wages.
(1) Estimates for detailed occupations do not sum to the totals because the totals include occupations not shown separately. Estimates do not include self-employed workers.
(2) Annual wages have been calculated by multiplying the hourly mean wage by a "year-round, full-time" hours figure of 2,080 hours; for those occupations where there is not an hourly wage published, the annual wage has been directly calculated from the reported survey data.
(3) The relative standard error (RSE) is a measure of the reliability of a survey statistic. The smaller the relative standard error, the more precise the estimate.
(9) The location quotient is the ratio of the area concentration of occupational employment to the national average concentration. A location quotient greater than one indicates the occupation has a higher share of employment than average, and a location quotient less than one indicates the occupation is less prevalent in the area than average.
Other OEWS estimates and related information:
May 2021 National Occupational Employment and Wage Estimates
May 2021 State Occupational Employment and Wage Estimates
May 2021 Metropolitan and Nonmetropolitan Area Occupational Employment and Wage Estimates
May 2021 National Industry-Specific Occupational Employment and Wage Estimates
Last Modified Date: March 31, 2022