
An official website of the United States government
An official website of the United States government
The .gov means it's official.
Federal government websites often end in .gov or .mil. Before sharing sensitive information,
make sure you're on a federal government site.
The site is secure.
The
https:// ensures that you are connecting to the official website and that any
information you provide is encrypted and transmitted securely.
Enforce or ensure compliance with laws and regulations governing financial and securities institutions and financial and real estate transactions. May examine, verify, or authenticate records.
Employment estimate and mean wage estimates for Financial Examiners:
| Employment (1) | Employment RSE (3) |
Mean hourly wage |
Mean annual wage (2) |
Wage RSE (3) |
|---|---|---|---|---|
| 60,750 | 1.4 % | $ 46.24 | $ 96,180 | 0.6 % |
Percentile wage estimates for Financial Examiners:
| Percentile | 10% | 25% | 50% (Median) |
75% | 90% |
|---|---|---|---|---|---|
| Hourly Wage | $ 23.47 | $ 29.96 | $ 39.14 | $ 58.67 | $ 77.33 |
| Annual Wage (2) | $ 48,830 | $ 62,320 | $ 81,410 | $ 122,030 | $ 160,850 |
Industries with the highest published employment and wages for Financial Examiners are provided. For a list of all industries with employment in Financial Examiners, see the Create Customized Tables function.
Industries with the highest levels of employment in Financial Examiners:
| Industry | Employment (1) | Percent of industry employment | Hourly mean wage | Annual mean wage (2) |
|---|---|---|---|---|
| Credit Intermediation and Related Activities (5221 and 5223 only) | 21,730 | 1.09 | $ 40.24 | $ 83,690 |
| Securities, Commodity Contracts, and Other Financial Investments and Related Activities | 8,900 | 0.93 | $ 57.99 | $ 120,610 |
| Federal Executive Branch (OEWS Designation) | 6,320 | 0.30 | $ 63.51 | $ 132,090 |
| Management of Companies and Enterprises | 6,190 | 0.24 | $ 45.32 | $ 94,270 |
| State Government, excluding schools and hospitals (OEWS Designation) | 4,820 | 0.22 | $ 38.39 | $ 79,850 |
Industries with the highest concentration of employment in Financial Examiners:
| Industry | Employment (1) | Percent of industry employment | Hourly mean wage | Annual mean wage (2) |
|---|---|---|---|---|
| Monetary Authorities-Central Bank | 1,420 | 6.78 | $ 63.23 | $ 131,510 |
| Credit Intermediation and Related Activities (5221 and 5223 only) | 21,730 | 1.09 | $ 40.24 | $ 83,690 |
| Securities, Commodity Contracts, and Other Financial Investments and Related Activities | 8,900 | 0.93 | $ 57.99 | $ 120,610 |
| Nondepository Credit Intermediation | 3,910 | 0.63 | $ 39.66 | $ 82,500 |
| Federal Executive Branch (OEWS Designation) | 6,320 | 0.30 | $ 63.51 | $ 132,090 |
Top paying industries for Financial Examiners:
| Industry | Employment (1) | Percent of industry employment | Hourly mean wage | Annual mean wage (2) |
|---|---|---|---|---|
| Federal Executive Branch (OEWS Designation) | 6,320 | 0.30 | $ 63.51 | $ 132,090 |
| Monetary Authorities-Central Bank | 1,420 | 6.78 | $ 63.23 | $ 131,510 |
| Securities, Commodity Contracts, and Other Financial Investments and Related Activities | 8,900 | 0.93 | $ 57.99 | $ 120,610 |
| Business, Professional, Labor, Political, and Similar Organizations | 400 | 0.10 | $ 55.08 | $ 114,560 |
| Accounting, Tax Preparation, Bookkeeping, and Payroll Services | 410 | 0.04 | $ 47.93 | $ 99,700 |
States and areas with the highest published employment, location quotients, and wages for Financial Examiners are provided. For a list of all areas with employment in Financial Examiners, see the Create Customized Tables function.
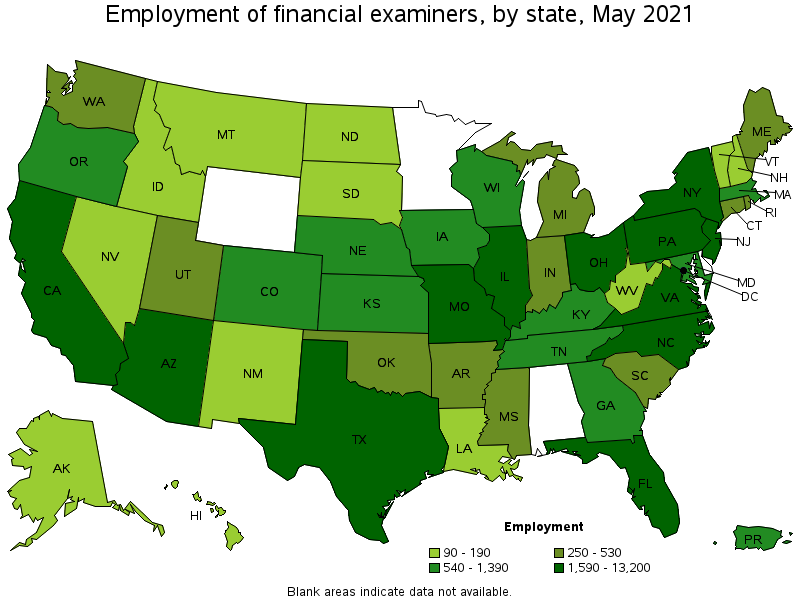
States with the highest employment level in Financial Examiners:
| State | Employment (1) | Employment per thousand jobs | Location quotient (9) | Hourly mean wage | Annual mean wage (2) |
|---|---|---|---|---|---|
| New York | 13,200 | 1.52 | 3.53 | $ 55.81 | $ 116,080 |
| Texas | 4,640 | 0.38 | 0.88 | $ 40.99 | $ 85,260 |
| California | 3,710 | 0.22 | 0.52 | $ 51.39 | $ 106,890 |
| Ohio | 2,610 | 0.50 | 1.16 | $ 37.43 | $ 77,850 |
| Florida | 2,580 | 0.30 | 0.70 | $ 36.31 | $ 75,520 |
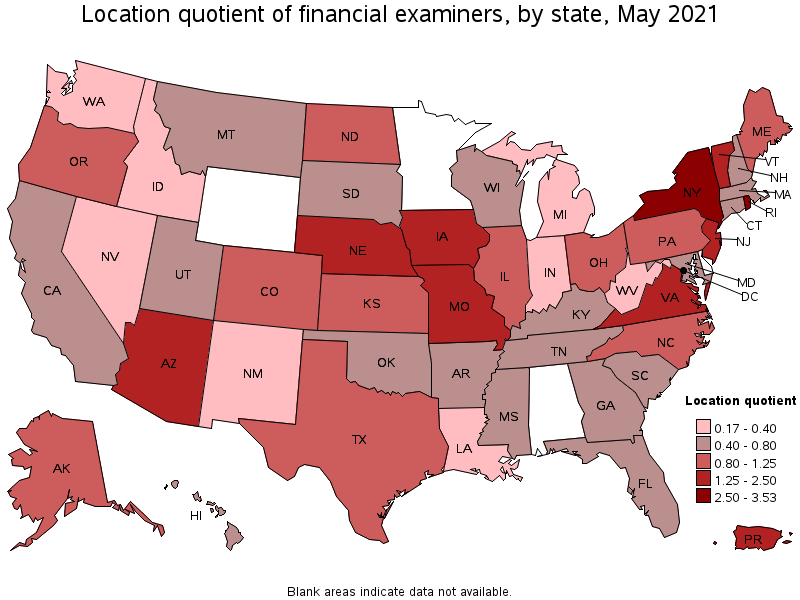
States with the highest concentration of jobs and location quotients in Financial Examiners:
| State | Employment (1) | Employment per thousand jobs | Location quotient (9) | Hourly mean wage | Annual mean wage (2) |
|---|---|---|---|---|---|
| New York | 13,200 | 1.52 | 3.53 | $ 55.81 | $ 116,080 |
| Rhode Island | 530 | 1.15 | 2.66 | $ 42.01 | $ 87,380 |
| Missouri | 2,100 | 0.77 | 1.78 | $ 43.54 | $ 90,560 |
| Iowa | 1,110 | 0.75 | 1.73 | $ 39.96 | $ 83,130 |
| District of Columbia | 460 | 0.70 | 1.62 | $ 79.24 | $ 164,820 |
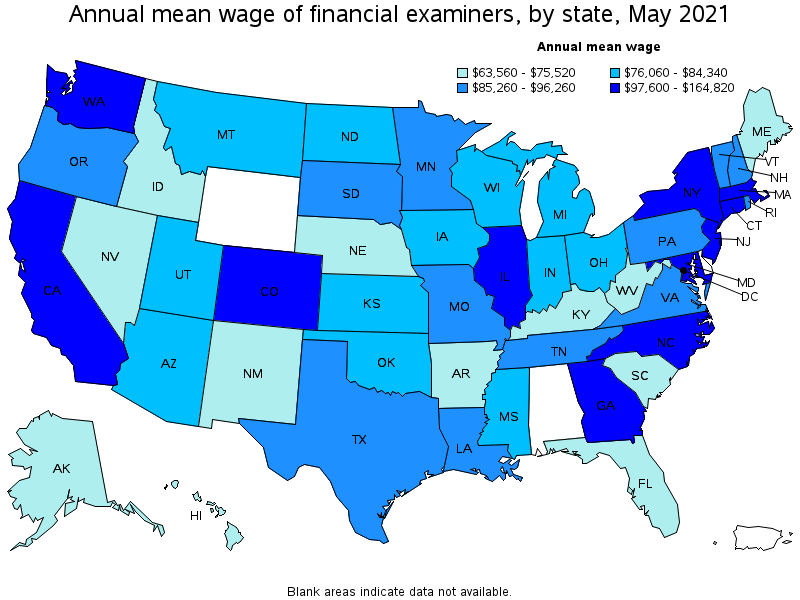
Top paying states for Financial Examiners:
| State | Employment (1) | Employment per thousand jobs | Location quotient (9) | Hourly mean wage | Annual mean wage (2) |
|---|---|---|---|---|---|
| District of Columbia | 460 | 0.70 | 1.62 | $ 79.24 | $ 164,820 |
| New York | 13,200 | 1.52 | 3.53 | $ 55.81 | $ 116,080 |
| New Jersey | 2,410 | 0.63 | 1.45 | $ 52.18 | $ 108,520 |
| Massachusetts | 1,100 | 0.32 | 0.75 | $ 51.98 | $ 108,110 |
| Maryland | 610 | 0.24 | 0.55 | $ 51.95 | $ 108,060 |
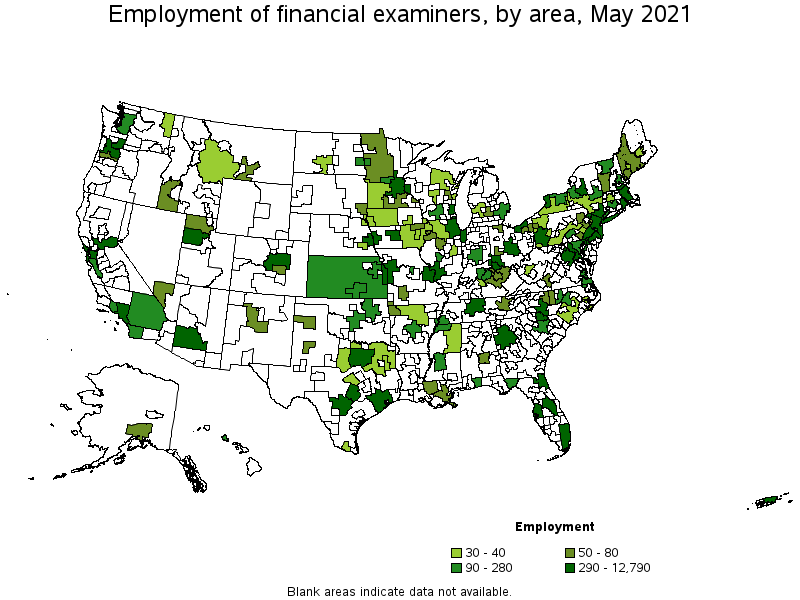
Metropolitan areas with the highest employment level in Financial Examiners:
| Metropolitan area | Employment (1) | Employment per thousand jobs | Location quotient (9) | Hourly mean wage | Annual mean wage (2) |
|---|---|---|---|---|---|
| New York-Newark-Jersey City, NY-NJ-PA | 12,790 | 1.47 | 3.42 | $ 58.99 | $ 122,690 |
| Minneapolis-St. Paul-Bloomington, MN-WI | 2,120 | 1.17 | 2.70 | $ 46.56 | $ 96,850 |
| Dallas-Fort Worth-Arlington, TX | 2,050 | 0.57 | 1.33 | $ 44.35 | $ 92,240 |
| Chicago-Naperville-Elgin, IL-IN-WI | 1,710 | 0.40 | 0.94 | $ 51.77 | $ 107,690 |
| Philadelphia-Camden-Wilmington, PA-NJ-DE-MD | 1,690 | 0.64 | 1.48 | $ 44.57 | $ 92,700 |
| Phoenix-Mesa-Scottsdale, AZ | 1,540 | 0.73 | 1.69 | $ 36.81 | $ 76,560 |
| Los Angeles-Long Beach-Anaheim, CA | 1,470 | 0.26 | 0.60 | $ 47.26 | $ 98,290 |
| Washington-Arlington-Alexandria, DC-VA-MD-WV | 1,460 | 0.50 | 1.15 | $ 60.38 | $ 125,590 |
| St. Louis, MO-IL | 1,280 | 1.00 | 2.33 | $ 43.74 | $ 90,970 |
| Charlotte-Concord-Gastonia, NC-SC | 1,250 | 1.03 | 2.39 | $ 54.59 | $ 113,540 |
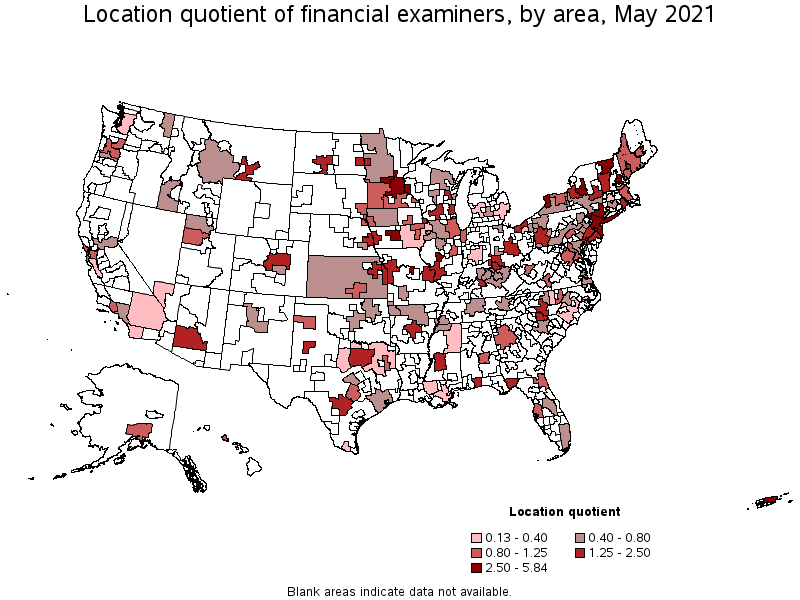
Metropolitan areas with the highest concentration of jobs and location quotients in Financial Examiners:
| Metropolitan area | Employment (1) | Employment per thousand jobs | Location quotient (9) | Hourly mean wage | Annual mean wage (2) |
|---|---|---|---|---|---|
| Utica-Rome, NY | 290 | 2.52 | 5.84 | $ 27.87 | $ 57,970 |
| Des Moines-West Des Moines, IA | 720 | 2.02 | 4.68 | $ 42.25 | $ 87,870 |
| Buffalo-Cheektowaga-Niagara Falls, NY | 960 | 1.91 | 4.44 | $ 34.63 | $ 72,040 |
| Springfield, IL | 150 | 1.53 | 3.54 | $ 36.64 | $ 76,210 |
| New York-Newark-Jersey City, NY-NJ-PA | 12,790 | 1.47 | 3.42 | $ 58.99 | $ 122,690 |
| Columbia, MO | 130 | 1.44 | 3.35 | $ 31.44 | $ 65,400 |
| St. Cloud, MN | 130 | 1.31 | 3.03 | $ 29.83 | $ 62,050 |
| Minneapolis-St. Paul-Bloomington, MN-WI | 2,120 | 1.17 | 2.70 | $ 46.56 | $ 96,850 |
| Charlotte-Concord-Gastonia, NC-SC | 1,250 | 1.03 | 2.39 | $ 54.59 | $ 113,540 |
| St. Louis, MO-IL | 1,280 | 1.00 | 2.33 | $ 43.74 | $ 90,970 |
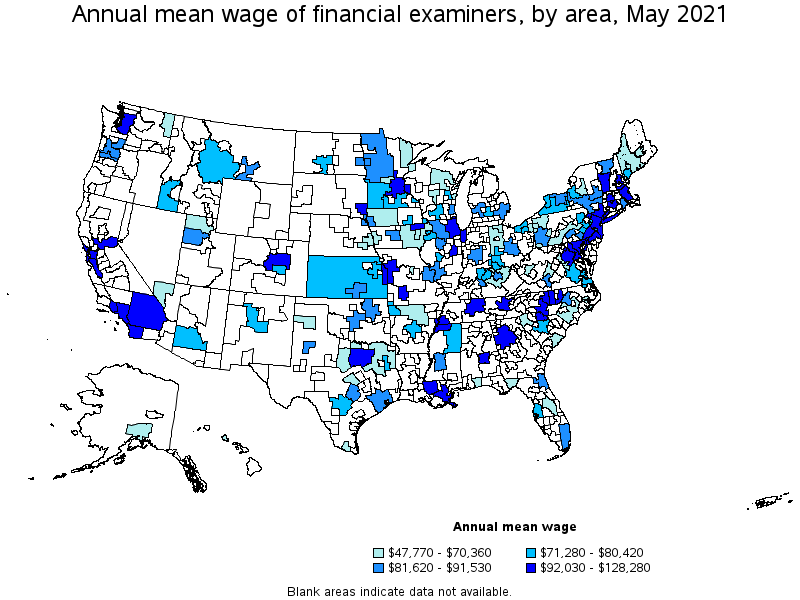
Top paying metropolitan areas for Financial Examiners:
| Metropolitan area | Employment (1) | Employment per thousand jobs | Location quotient (9) | Hourly mean wage | Annual mean wage (2) |
|---|---|---|---|---|---|
| San Francisco-Oakland-Hayward, CA | 980 | 0.44 | 1.01 | $ 61.67 | $ 128,280 |
| Washington-Arlington-Alexandria, DC-VA-MD-WV | 1,460 | 0.50 | 1.15 | $ 60.38 | $ 125,590 |
| San Jose-Sunnyvale-Santa Clara, CA | 90 | 0.09 | 0.20 | $ 59.65 | $ 124,070 |
| New York-Newark-Jersey City, NY-NJ-PA | 12,790 | 1.47 | 3.42 | $ 58.99 | $ 122,690 |
| Bridgeport-Stamford-Norwalk, CT | 130 | 0.33 | 0.77 | $ 55.45 | $ 115,340 |
| Springfield, MA-CT | 40 | 0.14 | 0.32 | $ 55.36 | $ 115,140 |
| Charlotte-Concord-Gastonia, NC-SC | 1,250 | 1.03 | 2.39 | $ 54.59 | $ 113,540 |
| Seattle-Tacoma-Bellevue, WA | 220 | 0.11 | 0.26 | $ 53.81 | $ 111,930 |
| Baltimore-Columbia-Towson, MD | 280 | 0.22 | 0.52 | $ 52.90 | $ 110,030 |
| Oxnard-Thousand Oaks-Ventura, CA | 120 | 0.42 | 0.97 | $ 52.83 | $ 109,890 |
Nonmetropolitan areas with the highest employment in Financial Examiners:
| Nonmetropolitan area | Employment (1) | Employment per thousand jobs | Location quotient (9) | Hourly mean wage | Annual mean wage (2) |
|---|---|---|---|---|---|
| Kansas nonmetropolitan area | 120 | 0.33 | 0.76 | $ 35.55 | $ 73,940 |
| Central New Hampshire nonmetropolitan area | 110 | 1.26 | 2.91 | $ 45.47 | $ 94,580 |
| Northern Vermont nonmetropolitan area | 90 | 1.38 | 3.20 | $ 43.36 | $ 90,180 |
| Southwest Maine nonmetropolitan area | 70 | 0.40 | 0.93 | $ 29.54 | $ 61,450 |
| Southern Vermont nonmetropolitan area | 60 | 0.58 | 1.35 | $ 47.82 | $ 99,460 |
Nonmetropolitan areas with the highest concentration of jobs and location quotients in Financial Examiners:
| Nonmetropolitan area | Employment (1) | Employment per thousand jobs | Location quotient (9) | Hourly mean wage | Annual mean wage (2) |
|---|---|---|---|---|---|
| Northern Vermont nonmetropolitan area | 90 | 1.38 | 3.20 | $ 43.36 | $ 90,180 |
| Central New Hampshire nonmetropolitan area | 110 | 1.26 | 2.91 | $ 45.47 | $ 94,580 |
| Southern Vermont nonmetropolitan area | 60 | 0.58 | 1.35 | $ 47.82 | $ 99,460 |
| Southwest Maine nonmetropolitan area | 70 | 0.40 | 0.93 | $ 29.54 | $ 61,450 |
| Southeast Minnesota nonmetropolitan area | 50 | 0.36 | 0.84 | $ 36.41 | $ 75,730 |
Top paying nonmetropolitan areas for Financial Examiners:
| Nonmetropolitan area | Employment (1) | Employment per thousand jobs | Location quotient (9) | Hourly mean wage | Annual mean wage (2) |
|---|---|---|---|---|---|
| Southern Vermont nonmetropolitan area | 60 | 0.58 | 1.35 | $ 47.82 | $ 99,460 |
| Central New Hampshire nonmetropolitan area | 110 | 1.26 | 2.91 | $ 45.47 | $ 94,580 |
| Northwest Illinois nonmetropolitan area | 40 | 0.30 | 0.69 | $ 43.98 | $ 91,480 |
| Northern Vermont nonmetropolitan area | 90 | 1.38 | 3.20 | $ 43.36 | $ 90,180 |
| Northwest Minnesota nonmetropolitan area | 50 | 0.26 | 0.60 | $ 42.27 | $ 87,920 |
These estimates are calculated with data collected from employers in all industry sectors, all metropolitan and nonmetropolitan areas, and all states and the District of Columbia. The top employment and wage figures are provided above. The complete list is available in the downloadable XLS files.
The percentile wage estimate is the value of a wage below which a certain percent of workers fall. The median wage is the 50th percentile wage estimate—50 percent of workers earn less than the median and 50 percent of workers earn more than the median. More about percentile wages.
(1) Estimates for detailed occupations do not sum to the totals because the totals include occupations not shown separately. Estimates do not include self-employed workers.
(2) Annual wages have been calculated by multiplying the hourly mean wage by a "year-round, full-time" hours figure of 2,080 hours; for those occupations where there is not an hourly wage published, the annual wage has been directly calculated from the reported survey data.
(3) The relative standard error (RSE) is a measure of the reliability of a survey statistic. The smaller the relative standard error, the more precise the estimate.
(9) The location quotient is the ratio of the area concentration of occupational employment to the national average concentration. A location quotient greater than one indicates the occupation has a higher share of employment than average, and a location quotient less than one indicates the occupation is less prevalent in the area than average.
Other OEWS estimates and related information:
May 2021 National Occupational Employment and Wage Estimates
May 2021 State Occupational Employment and Wage Estimates
May 2021 Metropolitan and Nonmetropolitan Area Occupational Employment and Wage Estimates
May 2021 National Industry-Specific Occupational Employment and Wage Estimates
Last Modified Date: March 31, 2022