
An official website of the United States government
An official website of the United States government
The .gov means it's official.
Federal government websites often end in .gov or .mil. Before sharing sensitive information,
make sure you're on a federal government site.
The site is secure.
The
https:// ensures that you are connecting to the official website and that any
information you provide is encrypted and transmitted securely.
Advise and educate individuals or organizations on acquiring and managing debt. May provide guidance in determining the best type of loan and explain loan requirements or restrictions. May help develop debt management plans or student financial aid packages. May advise on credit issues, or provide budget, mortgage, bankruptcy, or student financial aid counseling.
Employment estimate and mean wage estimates for Credit Counselors:
| Employment (1) | Employment RSE (3) |
Mean hourly wage |
Mean annual wage (2) |
Wage RSE (3) |
|---|---|---|---|---|
| 31,230 | 3.6 % | $ 24.25 | $ 50,430 | 1.0 % |
Percentile wage estimates for Credit Counselors:
| Percentile | 10% | 25% | 50% (Median) |
75% | 90% |
|---|---|---|---|---|---|
| Hourly Wage | $ 16.94 | $ 18.22 | $ 22.87 | $ 28.55 | $ 36.17 |
| Annual Wage (2) | $ 35,240 | $ 37,900 | $ 47,580 | $ 59,390 | $ 75,230 |
Industries with the highest published employment and wages for Credit Counselors are provided. For a list of all industries with employment in Credit Counselors, see the Create Customized Tables function.
Industries with the highest levels of employment in Credit Counselors:
| Industry | Employment (1) | Percent of industry employment | Hourly mean wage | Annual mean wage (2) |
|---|---|---|---|---|
| Colleges, Universities, and Professional Schools | 7,920 | 0.27 | $ 23.97 | $ 49,850 |
| Other Professional, Scientific, and Technical Services | 4,030 | 0.53 | $ 20.05 | $ 41,700 |
| Credit Intermediation and Related Activities (5221 and 5223 only) | 2,940 | 0.15 | $ 27.69 | $ 57,600 |
| Nondepository Credit Intermediation | 2,830 | 0.45 | $ 25.58 | $ 53,200 |
| Management of Companies and Enterprises | 2,400 | 0.09 | $ 23.18 | $ 48,210 |
Industries with the highest concentration of employment in Credit Counselors:
| Industry | Employment (1) | Percent of industry employment | Hourly mean wage | Annual mean wage (2) |
|---|---|---|---|---|
| Technical and Trade Schools | 1,310 | 1.00 | $ 22.88 | $ 47,590 |
| Other Professional, Scientific, and Technical Services | 4,030 | 0.53 | $ 20.05 | $ 41,700 |
| Nondepository Credit Intermediation | 2,830 | 0.45 | $ 25.58 | $ 53,200 |
| Junior Colleges | 2,380 | 0.38 | $ 24.99 | $ 51,980 |
| Colleges, Universities, and Professional Schools | 7,920 | 0.27 | $ 23.97 | $ 49,850 |
Top paying industries for Credit Counselors:
| Industry | Employment (1) | Percent of industry employment | Hourly mean wage | Annual mean wage (2) |
|---|---|---|---|---|
| Agencies, Brokerages, and Other Insurance Related Activities | (8) | (8) | $ 47.90 | $ 99,640 |
| Automobile Dealers | 450 | 0.04 | $ 43.49 | $ 90,450 |
| State Government, excluding schools and hospitals (OEWS Designation) | 60 | (7) | $ 35.50 | $ 73,840 |
| Securities, Commodity Contracts, and Other Financial Investments and Related Activities | 280 | 0.03 | $ 35.19 | $ 73,200 |
| Insurance Carriers | 150 | 0.01 | $ 34.80 | $ 72,380 |
States and areas with the highest published employment, location quotients, and wages for Credit Counselors are provided. For a list of all areas with employment in Credit Counselors, see the Create Customized Tables function.
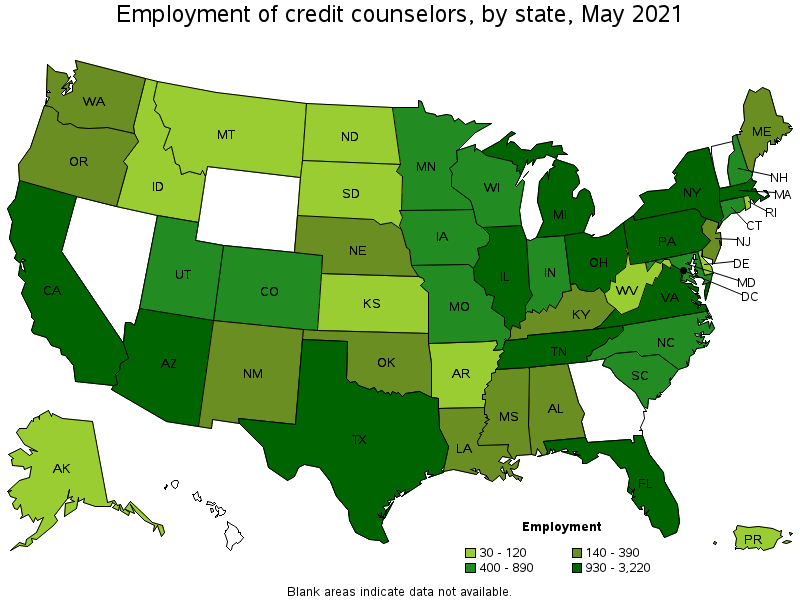
States with the highest employment level in Credit Counselors:
| State | Employment (1) | Employment per thousand jobs | Location quotient (9) | Hourly mean wage | Annual mean wage (2) |
|---|---|---|---|---|---|
| Texas | 3,220 | 0.26 | 1.19 | $ 20.68 | $ 43,010 |
| Florida | 2,350 | 0.27 | 1.23 | $ 21.53 | $ 44,790 |
| Arizona | 2,090 | 0.72 | 3.27 | $ 22.52 | $ 46,840 |
| California | 1,930 | 0.12 | 0.53 | $ 27.53 | $ 57,260 |
| Illinois | 1,650 | 0.29 | 1.33 | $ 22.84 | $ 47,500 |
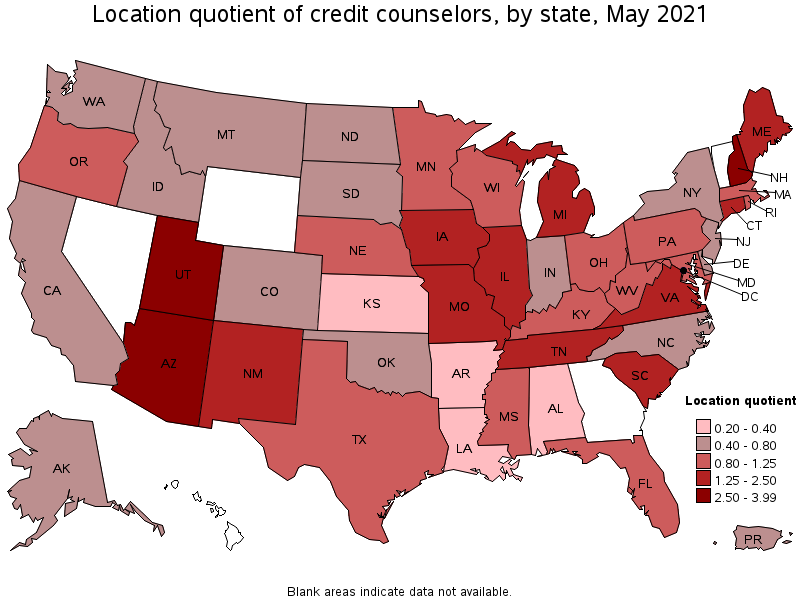
States with the highest concentration of jobs and location quotients in Credit Counselors:
| State | Employment (1) | Employment per thousand jobs | Location quotient (9) | Hourly mean wage | Annual mean wage (2) |
|---|---|---|---|---|---|
| New Hampshire | 560 | 0.88 | 3.99 | $ 22.01 | $ 45,770 |
| Arizona | 2,090 | 0.72 | 3.27 | $ 22.52 | $ 46,840 |
| Utah | 890 | 0.57 | 2.59 | $ 21.62 | $ 44,960 |
| Connecticut | 750 | 0.47 | 2.14 | $ 22.85 | $ 47,520 |
| New Mexico | 320 | 0.41 | 1.83 | $ 24.52 | $ 51,010 |
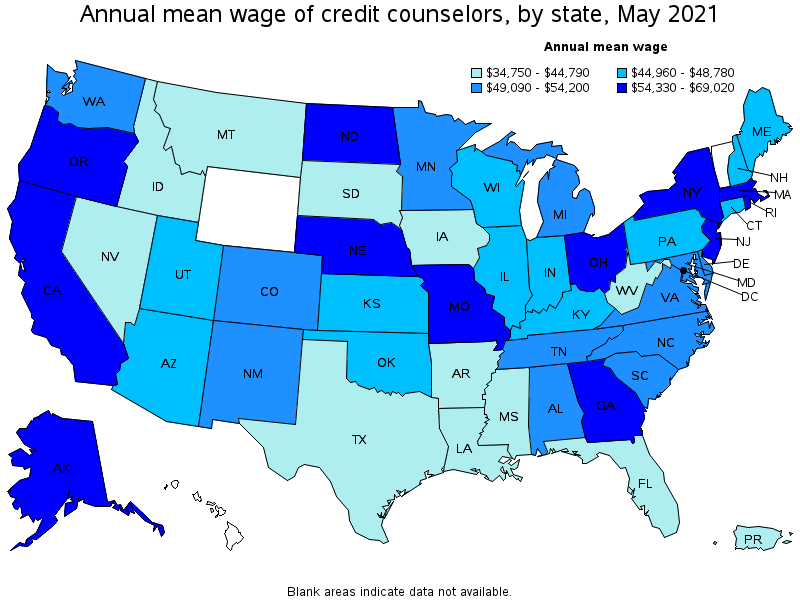
Top paying states for Credit Counselors:
| State | Employment (1) | Employment per thousand jobs | Location quotient (9) | Hourly mean wage | Annual mean wage (2) |
|---|---|---|---|---|---|
| District of Columbia | 110 | 0.17 | 0.75 | $ 33.18 | $ 69,020 |
| Rhode Island | 120 | 0.26 | 1.15 | $ 30.97 | $ 64,420 |
| Nebraska | 250 | 0.26 | 1.16 | $ 30.73 | $ 63,910 |
| New York | 1,470 | 0.17 | 0.77 | $ 30.63 | $ 63,710 |
| Massachusetts | 930 | 0.27 | 1.24 | $ 29.73 | $ 61,830 |
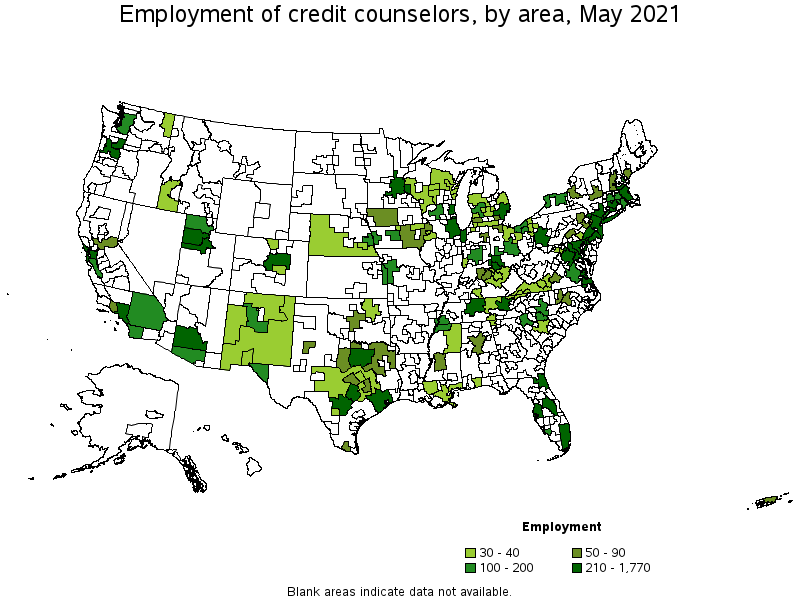
Metropolitan areas with the highest employment level in Credit Counselors:
| Metropolitan area | Employment (1) | Employment per thousand jobs | Location quotient (9) | Hourly mean wage | Annual mean wage (2) |
|---|---|---|---|---|---|
| Phoenix-Mesa-Scottsdale, AZ | 1,770 | 0.84 | 3.77 | $ 22.70 | $ 47,220 |
| Chicago-Naperville-Elgin, IL-IN-WI | 1,410 | 0.33 | 1.50 | $ 23.41 | $ 48,700 |
| New York-Newark-Jersey City, NY-NJ-PA | 1,200 | 0.14 | 0.62 | $ 31.93 | $ 66,410 |
| Dallas-Fort Worth-Arlington, TX | 1,040 | 0.29 | 1.30 | $ 22.82 | $ 47,460 |
| Miami-Fort Lauderdale-West Palm Beach, FL | 810 | 0.33 | 1.50 | $ 18.76 | $ 39,030 |
| Philadelphia-Camden-Wilmington, PA-NJ-DE-MD | 730 | 0.28 | 1.24 | $ 24.62 | $ 51,210 |
| Washington-Arlington-Alexandria, DC-VA-MD-WV | 720 | 0.25 | 1.11 | $ 28.72 | $ 59,730 |
| Los Angeles-Long Beach-Anaheim, CA | 700 | 0.12 | 0.55 | $ 28.66 | $ 59,620 |
| Houston-The Woodlands-Sugar Land, TX | 690 | 0.24 | 1.08 | $ 20.32 | $ 42,270 |
| Boston-Cambridge-Nashua, MA-NH | 680 | 0.26 | 1.18 | $ 29.94 | $ 62,280 |
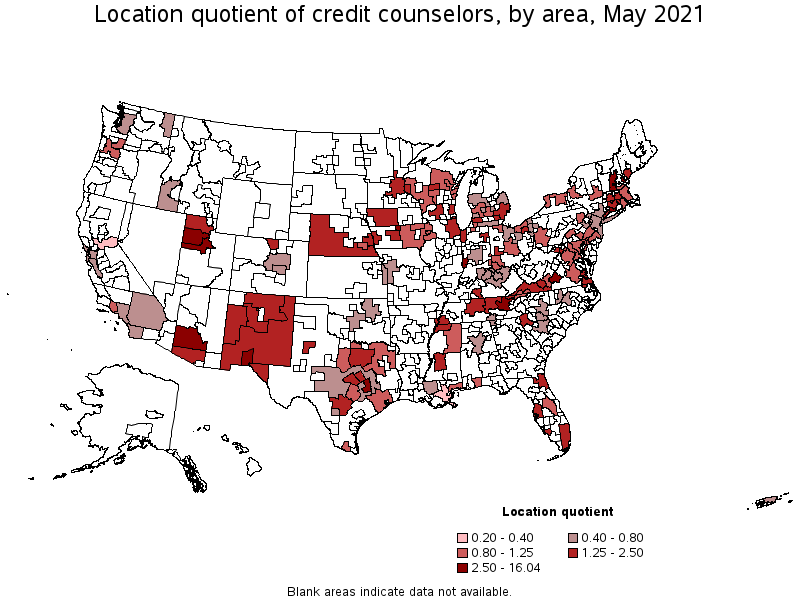
Metropolitan areas with the highest concentration of jobs and location quotients in Credit Counselors:
| Metropolitan area | Employment (1) | Employment per thousand jobs | Location quotient (9) | Hourly mean wage | Annual mean wage (2) |
|---|---|---|---|---|---|
| Dover-Durham, NH-ME | 180 | 3.56 | 16.04 | $ 21.40 | $ 44,510 |
| Provo-Orem, UT | 310 | 1.14 | 5.16 | $ 20.08 | $ 41,770 |
| Knoxville, TN | 370 | 0.96 | 4.33 | $ 24.80 | $ 51,590 |
| Phoenix-Mesa-Scottsdale, AZ | 1,770 | 0.84 | 3.77 | $ 22.70 | $ 47,220 |
| College Station-Bryan, TX | 90 | 0.80 | 3.61 | $ 17.31 | $ 35,990 |
| New Haven, CT | 210 | 0.75 | 3.36 | $ 24.06 | $ 50,030 |
| Ames, IA | 30 | 0.69 | 3.10 | $ 20.68 | $ 43,020 |
| Las Cruces, NM | 40 | 0.62 | 2.81 | $ 20.70 | $ 43,050 |
| Terre Haute, IN | 40 | 0.60 | 2.72 | $ 19.67 | $ 40,910 |
| Lynchburg, VA | 60 | 0.59 | 2.66 | $ 21.52 | $ 44,750 |
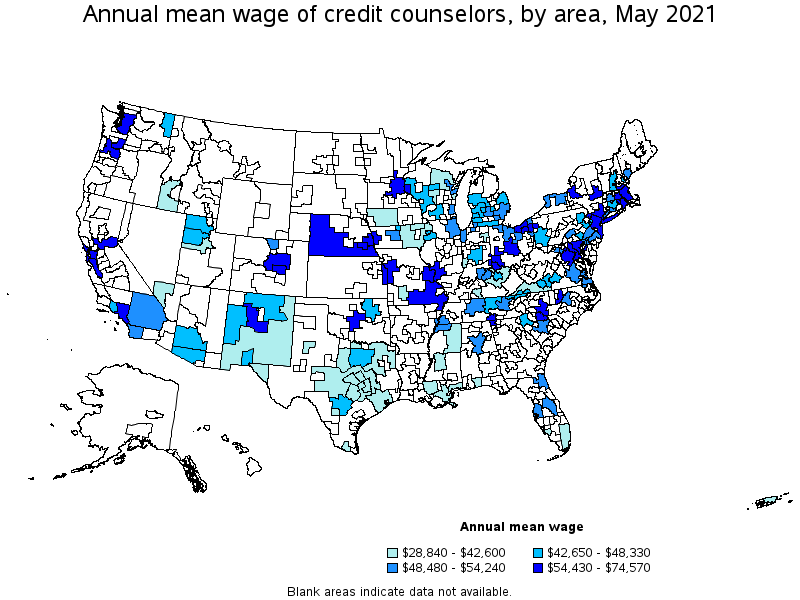
Top paying metropolitan areas for Credit Counselors:
| Metropolitan area | Employment (1) | Employment per thousand jobs | Location quotient (9) | Hourly mean wage | Annual mean wage (2) |
|---|---|---|---|---|---|
| Durham-Chapel Hill, NC | 50 | 0.15 | 0.68 | $ 35.85 | $ 74,570 |
| Lincoln, NE | 30 | 0.18 | 0.83 | $ 33.65 | $ 69,990 |
| New York-Newark-Jersey City, NY-NJ-PA | 1,200 | 0.14 | 0.62 | $ 31.93 | $ 66,410 |
| Providence-Warwick, RI-MA | 140 | 0.25 | 1.14 | $ 31.18 | $ 64,860 |
| San Jose-Sunnyvale-Santa Clara, CA | 120 | 0.11 | 0.51 | $ 30.26 | $ 62,930 |
| Youngstown-Warren-Boardman, OH-PA | 30 | 0.17 | 0.75 | $ 30.23 | $ 62,880 |
| Boston-Cambridge-Nashua, MA-NH | 680 | 0.26 | 1.18 | $ 29.94 | $ 62,280 |
| Omaha-Council Bluffs, NE-IA | 130 | 0.29 | 1.29 | $ 29.86 | $ 62,110 |
| Cleveland-Elyria, OH | 180 | 0.18 | 0.83 | $ 29.80 | $ 61,990 |
| Sacramento--Roseville--Arden-Arcade, CA | 80 | 0.08 | 0.35 | $ 29.79 | $ 61,970 |
Nonmetropolitan areas with the highest employment in Credit Counselors:
| Nonmetropolitan area | Employment (1) | Employment per thousand jobs | Location quotient (9) | Hourly mean wage | Annual mean wage (2) |
|---|---|---|---|---|---|
| West Central-Southwest New Hampshire nonmetropolitan area | 50 | 0.56 | 2.54 | $ 23.16 | $ 48,180 |
| Southeast Iowa nonmetropolitan area | 50 | 0.25 | 1.11 | $ 19.48 | $ 40,520 |
| North Texas Region of Texas nonmetropolitan area | 50 | 0.19 | 0.86 | $ 17.41 | $ 36,220 |
| Northwest Iowa nonmetropolitan area | 50 | 0.38 | 1.74 | $ 18.21 | $ 37,880 |
| North Northeastern Ohio nonmetropolitan area (noncontiguous) | 40 | 0.14 | 0.64 | $ 26.08 | $ 54,240 |
Nonmetropolitan areas with the highest concentration of jobs and location quotients in Credit Counselors:
| Nonmetropolitan area | Employment (1) | Employment per thousand jobs | Location quotient (9) | Hourly mean wage | Annual mean wage (2) |
|---|---|---|---|---|---|
| West Central-Southwest New Hampshire nonmetropolitan area | 50 | 0.56 | 2.54 | $ 23.16 | $ 48,180 |
| Northern New Mexico nonmetropolitan area | 30 | 0.41 | 1.86 | $ 20.73 | $ 43,110 |
| Northwest Iowa nonmetropolitan area | 50 | 0.38 | 1.74 | $ 18.21 | $ 37,880 |
| Eastern New Mexico nonmetropolitan area | 40 | 0.29 | 1.30 | $ 20.48 | $ 42,600 |
| North Central Tennessee nonmetropolitan area | 30 | 0.28 | 1.28 | $ 22.90 | $ 47,630 |
Top paying nonmetropolitan areas for Credit Counselors:
| Nonmetropolitan area | Employment (1) | Employment per thousand jobs | Location quotient (9) | Hourly mean wage | Annual mean wage (2) |
|---|---|---|---|---|---|
| Southeast Missouri nonmetropolitan area | (8) | (8) | (8) | $ 34.61 | $ 71,980 |
| South Nebraska nonmetropolitan area | 40 | 0.28 | 1.25 | $ 28.56 | $ 59,410 |
| North Northeastern Ohio nonmetropolitan area (noncontiguous) | 40 | 0.14 | 0.64 | $ 26.08 | $ 54,240 |
| West Central-Southwest New Hampshire nonmetropolitan area | 50 | 0.56 | 2.54 | $ 23.16 | $ 48,180 |
| North Central Tennessee nonmetropolitan area | 30 | 0.28 | 1.28 | $ 22.90 | $ 47,630 |
These estimates are calculated with data collected from employers in all industry sectors, all metropolitan and nonmetropolitan areas, and all states and the District of Columbia. The top employment and wage figures are provided above. The complete list is available in the downloadable XLS files.
The percentile wage estimate is the value of a wage below which a certain percent of workers fall. The median wage is the 50th percentile wage estimate—50 percent of workers earn less than the median and 50 percent of workers earn more than the median. More about percentile wages.
(1) Estimates for detailed occupations do not sum to the totals because the totals include occupations not shown separately. Estimates do not include self-employed workers.
(2) Annual wages have been calculated by multiplying the hourly mean wage by a "year-round, full-time" hours figure of 2,080 hours; for those occupations where there is not an hourly wage published, the annual wage has been directly calculated from the reported survey data.
(3) The relative standard error (RSE) is a measure of the reliability of a survey statistic. The smaller the relative standard error, the more precise the estimate.
(7) The value is less than .005 percent of industry employment.
(8) Estimate not released.
(9) The location quotient is the ratio of the area concentration of occupational employment to the national average concentration. A location quotient greater than one indicates the occupation has a higher share of employment than average, and a location quotient less than one indicates the occupation is less prevalent in the area than average.
Other OEWS estimates and related information:
May 2021 National Occupational Employment and Wage Estimates
May 2021 State Occupational Employment and Wage Estimates
May 2021 Metropolitan and Nonmetropolitan Area Occupational Employment and Wage Estimates
May 2021 National Industry-Specific Occupational Employment and Wage Estimates
Last Modified Date: March 31, 2022