
An official website of the United States government
An official website of the United States government
The .gov means it's official.
Federal government websites often end in .gov or .mil. Before sharing sensitive information,
make sure you're on a federal government site.
The site is secure.
The
https:// ensures that you are connecting to the official website and that any
information you provide is encrypted and transmitted securely.
Administer, test, and implement computer databases, applying knowledge of database management systems. Coordinate changes to computer databases. Identify, investigate, and resolve database performance issues, database capacity, and database scalability. May plan, coordinate, and implement security measures to safeguard computer databases. Excludes �Information Security Analysts� (15-1212) and �Database Architects� (15-1243).
Employment estimate and mean wage estimates for Database Administrators:
| Employment (1) | Employment RSE (3) |
Mean hourly wage |
Mean annual wage (2) |
Wage RSE (3) |
|---|---|---|---|---|
| 85,870 | 1.5 % | $ 46.42 | $ 96,550 | 0.9 % |
Percentile wage estimates for Database Administrators:
| Percentile | 10% | 25% | 50% (Median) |
75% | 90% |
|---|---|---|---|---|---|
| Hourly Wage | $ 23.50 | $ 30.36 | $ 46.50 | $ 59.88 | $ 72.79 |
| Annual Wage (2) | $ 48,880 | $ 63,160 | $ 96,710 | $ 124,550 | $ 151,400 |
Industries with the highest published employment and wages for Database Administrators are provided. For a list of all industries with employment in Database Administrators, see the Create Customized Tables function.
Industries with the highest levels of employment in Database Administrators:
| Industry | Employment (1) | Percent of industry employment | Hourly mean wage | Annual mean wage (2) |
|---|---|---|---|---|
| Computer Systems Design and Related Services | 11,720 | 0.52 | $ 49.80 | $ 103,570 |
| Management of Companies and Enterprises | 7,240 | 0.29 | $ 50.24 | $ 104,500 |
| Colleges, Universities, and Professional Schools | 4,110 | 0.14 | $ 39.85 | $ 82,890 |
| Data Processing, Hosting, and Related Services | 4,030 | 1.07 | $ 46.60 | $ 96,930 |
| Management, Scientific, and Technical Consulting Services | 3,230 | 0.21 | $ 43.85 | $ 91,200 |
Industries with the highest concentration of employment in Database Administrators:
| Industry | Employment (1) | Percent of industry employment | Hourly mean wage | Annual mean wage (2) |
|---|---|---|---|---|
| Data Processing, Hosting, and Related Services | 4,030 | 1.07 | $ 46.60 | $ 96,930 |
| Monetary Authorities-Central Bank | 130 | 0.64 | $ 66.73 | $ 138,800 |
| Cable and Other Subscription Programming | 290 | 0.60 | $ 34.52 | $ 71,810 |
| Computer Systems Design and Related Services | 11,720 | 0.52 | $ 49.80 | $ 103,570 |
| Grantmaking and Giving Services | 640 | 0.46 | $ 31.32 | $ 65,150 |
Top paying industries for Database Administrators:
| Industry | Employment (1) | Percent of industry employment | Hourly mean wage | Annual mean wage (2) |
|---|---|---|---|---|
| Monetary Authorities-Central Bank | 130 | 0.64 | $ 66.73 | $ 138,800 |
| Merchant Wholesalers, Nondurable Goods (4242 and 4246 only) | 320 | 0.09 | $ 62.96 | $ 130,950 |
| Computer and Peripheral Equipment Manufacturing | 240 | 0.16 | $ 61.75 | $ 128,440 |
| Securities, Commodity Contracts, and Other Financial Investments and Related Activities | 2,110 | 0.22 | $ 59.38 | $ 123,500 |
| Petroleum and Coal Products Manufacturing | 30 | 0.03 | $ 58.43 | $ 121,530 |
States and areas with the highest published employment, location quotients, and wages for Database Administrators are provided. For a list of all areas with employment in Database Administrators, see the Create Customized Tables function.
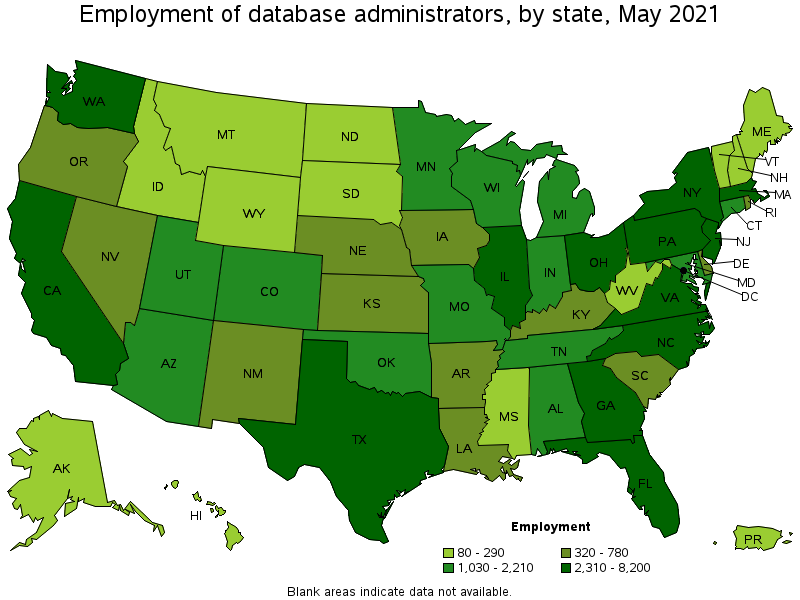
States with the highest employment level in Database Administrators:
| State | Employment (1) | Employment per thousand jobs | Location quotient (9) | Hourly mean wage | Annual mean wage (2) |
|---|---|---|---|---|---|
| California | 8,200 | 0.50 | 0.81 | $ 51.08 | $ 106,250 |
| Texas | 7,070 | 0.58 | 0.95 | $ 47.56 | $ 98,910 |
| Illinois | 5,380 | 0.96 | 1.57 | $ 46.97 | $ 97,700 |
| Virginia | 5,230 | 1.39 | 2.28 | $ 48.52 | $ 100,930 |
| New York | 4,940 | 0.57 | 0.93 | $ 51.57 | $ 107,260 |
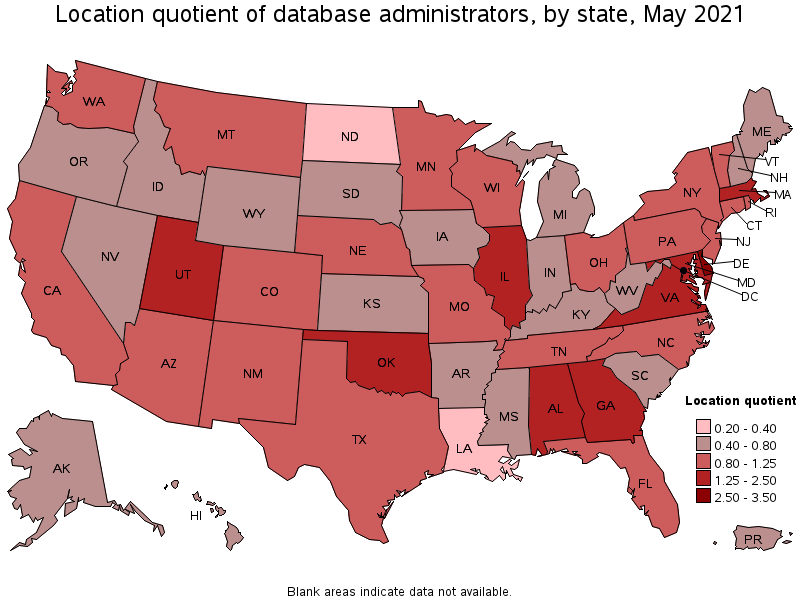
States with the highest concentration of jobs and location quotients in Database Administrators:
| State | Employment (1) | Employment per thousand jobs | Location quotient (9) | Hourly mean wage | Annual mean wage (2) |
|---|---|---|---|---|---|
| Delaware | 730 | 1.69 | 2.76 | $ 45.49 | $ 94,630 |
| Virginia | 5,230 | 1.39 | 2.28 | $ 48.52 | $ 100,930 |
| Alabama | 2,210 | 1.15 | 1.88 | $ 39.78 | $ 82,730 |
| Illinois | 5,380 | 0.96 | 1.57 | $ 46.97 | $ 97,700 |
| Utah | 1,400 | 0.90 | 1.48 | $ 43.68 | $ 90,850 |
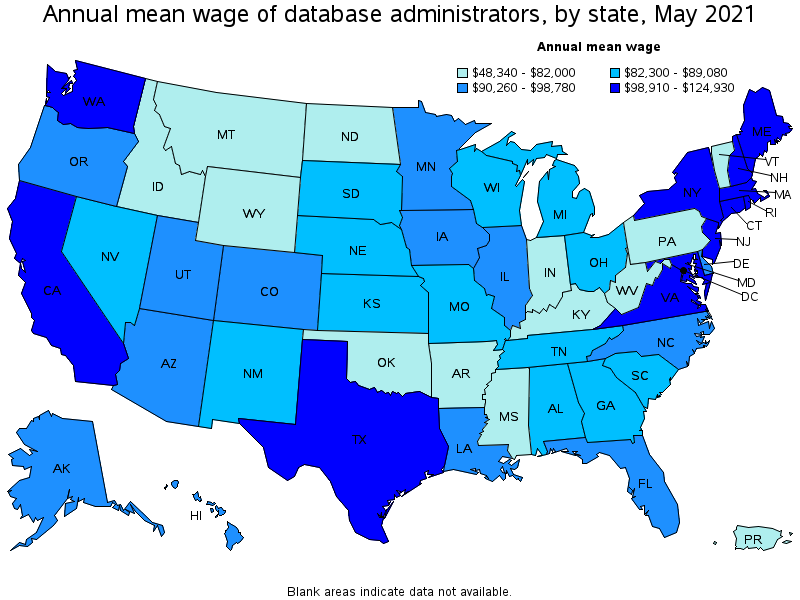
Top paying states for Database Administrators:
| State | Employment (1) | Employment per thousand jobs | Location quotient (9) | Hourly mean wage | Annual mean wage (2) |
|---|---|---|---|---|---|
| New Jersey | 2,320 | 0.60 | 0.99 | $ 60.06 | $ 124,930 |
| Massachusetts | 2,670 | 0.79 | 1.29 | $ 54.69 | $ 113,750 |
| Washington | 2,310 | 0.72 | 1.18 | $ 52.64 | $ 109,490 |
| New York | 4,940 | 0.57 | 0.93 | $ 51.57 | $ 107,260 |
| Rhode Island | 320 | 0.71 | 1.16 | $ 51.46 | $ 107,040 |
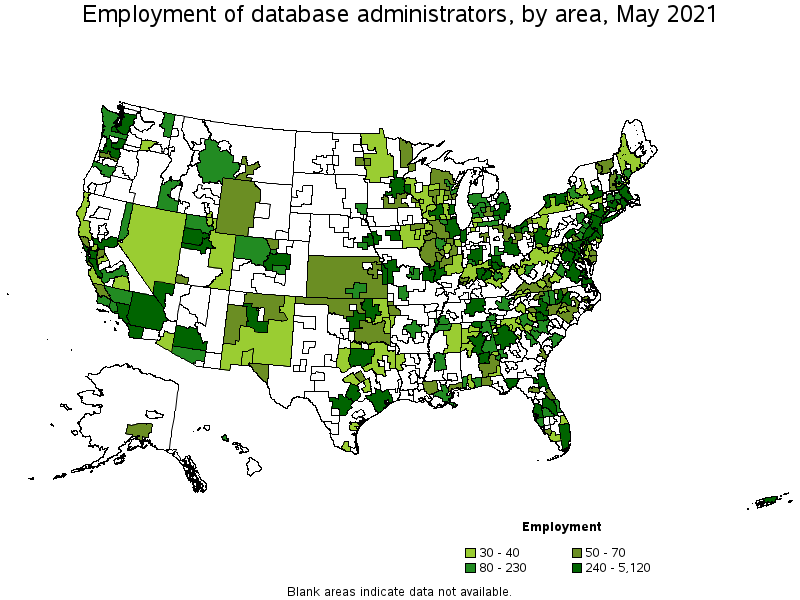
Metropolitan areas with the highest employment level in Database Administrators:
| Metropolitan area | Employment (1) | Employment per thousand jobs | Location quotient (9) | Hourly mean wage | Annual mean wage (2) |
|---|---|---|---|---|---|
| New York-Newark-Jersey City, NY-NJ-PA | 5,120 | 0.59 | 0.97 | $ 57.44 | $ 119,470 |
| Washington-Arlington-Alexandria, DC-VA-MD-WV | 4,490 | 1.53 | 2.51 | $ 50.83 | $ 105,730 |
| Chicago-Naperville-Elgin, IL-IN-WI | 4,360 | 1.03 | 1.69 | $ 48.06 | $ 99,960 |
| Atlanta-Sandy Springs-Roswell, GA | 3,010 | 1.16 | 1.91 | $ 43.14 | $ 89,720 |
| Los Angeles-Long Beach-Anaheim, CA | 2,680 | 0.47 | 0.77 | $ 49.27 | $ 102,480 |
| Dallas-Fort Worth-Arlington, TX | 2,620 | 0.73 | 1.20 | $ 49.55 | $ 103,070 |
| Boston-Cambridge-Nashua, MA-NH | 2,330 | 0.90 | 1.48 | $ 56.12 | $ 116,720 |
| Philadelphia-Camden-Wilmington, PA-NJ-DE-MD | 2,300 | 0.87 | 1.42 | $ 43.99 | $ 91,510 |
| Houston-The Woodlands-Sugar Land, TX | 1,710 | 0.59 | 0.97 | $ 48.22 | $ 100,290 |
| Seattle-Tacoma-Bellevue, WA | 1,610 | 0.84 | 1.38 | $ 57.35 | $ 119,280 |
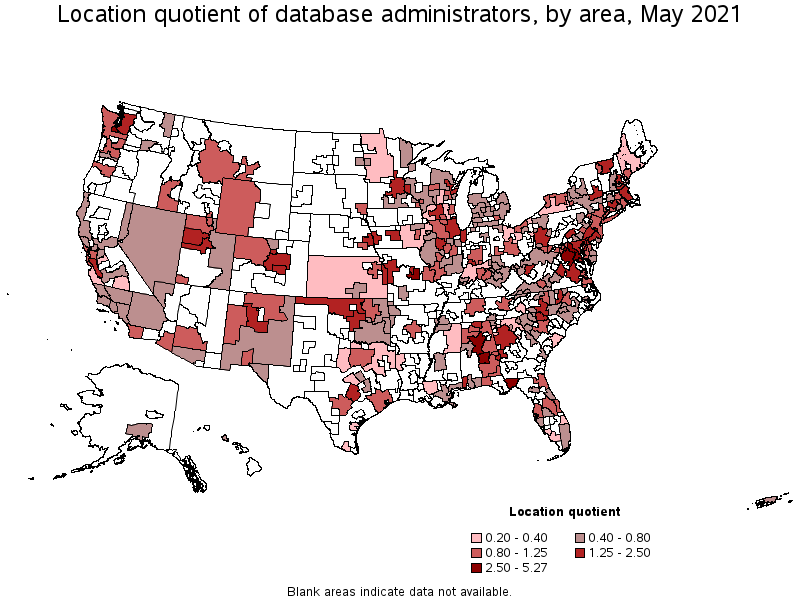
Metropolitan areas with the highest concentration of jobs and location quotients in Database Administrators:
| Metropolitan area | Employment (1) | Employment per thousand jobs | Location quotient (9) | Hourly mean wage | Annual mean wage (2) |
|---|---|---|---|---|---|
| Montgomery, AL | 490 | 3.21 | 5.27 | $ 39.25 | $ 81,630 |
| Olympia-Tumwater, WA | 290 | 2.62 | 4.29 | $ 46.46 | $ 96,630 |
| Jefferson City, MO | 150 | 2.04 | 3.35 | $ 35.13 | $ 73,070 |
| Trenton, NJ | 360 | 1.57 | 2.58 | $ 59.39 | $ 123,540 |
| Washington-Arlington-Alexandria, DC-VA-MD-WV | 4,490 | 1.53 | 2.51 | $ 50.83 | $ 105,730 |
| Birmingham-Hoover, AL | 740 | 1.53 | 2.51 | $ 42.40 | $ 88,200 |
| Tallahassee, FL | 260 | 1.53 | 2.50 | $ 33.56 | $ 69,810 |
| Huntsville, AL | 320 | 1.40 | 2.29 | $ 43.77 | $ 91,040 |
| Columbus, GA-AL | 150 | 1.34 | 2.21 | $ 46.65 | $ 97,040 |
| California-Lexington Park, MD | 60 | 1.28 | 2.11 | $ 48.84 | $ 101,580 |
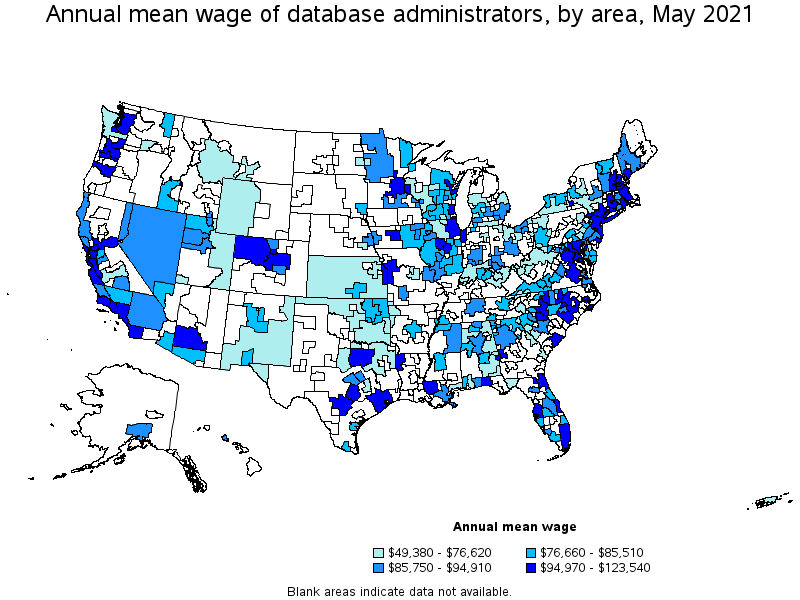
Top paying metropolitan areas for Database Administrators:
| Metropolitan area | Employment (1) | Employment per thousand jobs | Location quotient (9) | Hourly mean wage | Annual mean wage (2) |
|---|---|---|---|---|---|
| Trenton, NJ | 360 | 1.57 | 2.58 | $ 59.39 | $ 123,540 |
| San Jose-Sunnyvale-Santa Clara, CA | 1,050 | 0.98 | 1.61 | $ 58.38 | $ 121,430 |
| San Francisco-Oakland-Hayward, CA | 1,540 | 0.69 | 1.13 | $ 57.83 | $ 120,280 |
| New York-Newark-Jersey City, NY-NJ-PA | 5,120 | 0.59 | 0.97 | $ 57.44 | $ 119,470 |
| Seattle-Tacoma-Bellevue, WA | 1,610 | 0.84 | 1.38 | $ 57.35 | $ 119,280 |
| Boston-Cambridge-Nashua, MA-NH | 2,330 | 0.90 | 1.48 | $ 56.12 | $ 116,720 |
| Manchester, NH | 30 | 0.30 | 0.49 | $ 55.75 | $ 115,960 |
| Shreveport-Bossier City, LA | 30 | 0.19 | 0.31 | $ 54.94 | $ 114,280 |
| Portland-South Portland, ME | 110 | 0.56 | 0.91 | $ 54.83 | $ 114,040 |
| Bridgeport-Stamford-Norwalk, CT | 210 | 0.55 | 0.91 | $ 53.97 | $ 112,270 |
Nonmetropolitan areas with the highest employment in Database Administrators:
| Nonmetropolitan area | Employment (1) | Employment per thousand jobs | Location quotient (9) | Hourly mean wage | Annual mean wage (2) |
|---|---|---|---|---|---|
| Southwest Montana nonmetropolitan area | 100 | 0.70 | 1.14 | $ 35.08 | $ 72,970 |
| Northwest Colorado nonmetropolitan area | 80 | 0.73 | 1.19 | $ 54.43 | $ 113,220 |
| Northeast Alabama nonmetropolitan area | 80 | 0.57 | 0.94 | $ 32.24 | $ 67,060 |
| Western Washington nonmetropolitan area | 80 | 0.68 | 1.11 | $ 28.33 | $ 58,920 |
| Central New Hampshire nonmetropolitan area | 80 | 0.89 | 1.46 | $ 45.82 | $ 95,300 |
Nonmetropolitan areas with the highest concentration of jobs and location quotients in Database Administrators:
| Nonmetropolitan area | Employment (1) | Employment per thousand jobs | Location quotient (9) | Hourly mean wage | Annual mean wage (2) |
|---|---|---|---|---|---|
| Central New Hampshire nonmetropolitan area | 80 | 0.89 | 1.46 | $ 45.82 | $ 95,300 |
| Northern Vermont nonmetropolitan area | 50 | 0.83 | 1.37 | $ 38.30 | $ 79,660 |
| Northwest Oklahoma nonmetropolitan area | 70 | 0.78 | 1.29 | $ 32.28 | $ 67,150 |
| Northwest Colorado nonmetropolitan area | 80 | 0.73 | 1.19 | $ 54.43 | $ 113,220 |
| Southwest Montana nonmetropolitan area | 100 | 0.70 | 1.14 | $ 35.08 | $ 72,970 |
Top paying nonmetropolitan areas for Database Administrators:
| Nonmetropolitan area | Employment (1) | Employment per thousand jobs | Location quotient (9) | Hourly mean wage | Annual mean wage (2) |
|---|---|---|---|---|---|
| Northwest Colorado nonmetropolitan area | 80 | 0.73 | 1.19 | $ 54.43 | $ 113,220 |
| Southeast Coastal North Carolina nonmetropolitan area | 60 | 0.27 | 0.44 | $ 45.97 | $ 95,610 |
| Central New Hampshire nonmetropolitan area | 80 | 0.89 | 1.46 | $ 45.82 | $ 95,300 |
| West Central-Southwest New Hampshire nonmetropolitan area | 50 | 0.47 | 0.76 | $ 45.75 | $ 95,160 |
| Northwest Minnesota nonmetropolitan area | 30 | 0.18 | 0.30 | $ 44.04 | $ 91,600 |
These estimates are calculated with data collected from employers in all industry sectors, all metropolitan and nonmetropolitan areas, and all states and the District of Columbia. The top employment and wage figures are provided above. The complete list is available in the downloadable XLS files.
The percentile wage estimate is the value of a wage below which a certain percent of workers fall. The median wage is the 50th percentile wage estimate—50 percent of workers earn less than the median and 50 percent of workers earn more than the median. More about percentile wages.
(1) Estimates for detailed occupations do not sum to the totals because the totals include occupations not shown separately. Estimates do not include self-employed workers.
(2) Annual wages have been calculated by multiplying the hourly mean wage by a "year-round, full-time" hours figure of 2,080 hours; for those occupations where there is not an hourly wage published, the annual wage has been directly calculated from the reported survey data.
(3) The relative standard error (RSE) is a measure of the reliability of a survey statistic. The smaller the relative standard error, the more precise the estimate.
(9) The location quotient is the ratio of the area concentration of occupational employment to the national average concentration. A location quotient greater than one indicates the occupation has a higher share of employment than average, and a location quotient less than one indicates the occupation is less prevalent in the area than average.
Other OEWS estimates and related information:
May 2021 National Occupational Employment and Wage Estimates
May 2021 State Occupational Employment and Wage Estimates
May 2021 Metropolitan and Nonmetropolitan Area Occupational Employment and Wage Estimates
May 2021 National Industry-Specific Occupational Employment and Wage Estimates
Last Modified Date: March 31, 2022