
An official website of the United States government
An official website of the United States government
The .gov means it's official.
Federal government websites often end in .gov or .mil. Before sharing sensitive information,
make sure you're on a federal government site.
The site is secure.
The
https:// ensures that you are connecting to the official website and that any
information you provide is encrypted and transmitted securely.
Research, design, and develop computer and network software or specialized utility programs. Analyze user needs and develop software solutions, applying principles and techniques of computer science, engineering, and mathematical analysis. Update software or enhance existing software capabilities. May work with computer hardware engineers to integrate hardware and software systems, and develop specifications and performance requirements. May maintain databases within an application area, working individually or coordinating database development as part of a team.
Employment estimate and mean wage estimates for Software Developers:
| Employment (1) | Employment RSE (3) |
Mean hourly wage |
Mean annual wage (2) |
Wage RSE (3) |
|---|---|---|---|---|
| 1,364,180 | 0.7 % | $ 58.17 | $ 120,990 | 0.4 % |
Percentile wage estimates for Software Developers:
| Percentile | 10% | 25% | 50% (Median) |
75% | 90% |
|---|---|---|---|---|---|
| Hourly Wage | $ 30.99 | $ 43.69 | $ 58.05 | $ 73.06 | $ 81.04 |
| Annual Wage (2) | $ 64,470 | $ 90,870 | $ 120,730 | $ 151,960 | $ 168,570 |
Industries with the highest published employment and wages for Software Developers are provided. For a list of all industries with employment in Software Developers, see the Create Customized Tables function.
Industries with the highest levels of employment in Software Developers:
| Industry | Employment (1) | Percent of industry employment | Hourly mean wage | Annual mean wage (2) |
|---|---|---|---|---|
| Computer Systems Design and Related Services | 455,050 | 20.08 | $ 55.56 | $ 115,550 |
| Software Publishers | 133,340 | 25.34 | $ 62.99 | $ 131,020 |
| Management of Companies and Enterprises | 70,070 | 2.76 | $ 56.92 | $ 118,380 |
| Other Information Services | 58,420 | 16.10 | $ 75.39 | $ 156,800 |
| Data Processing, Hosting, and Related Services | 52,690 | 13.91 | $ 59.63 | $ 124,040 |
Industries with the highest concentration of employment in Software Developers:
| Industry | Employment (1) | Percent of industry employment | Hourly mean wage | Annual mean wage (2) |
|---|---|---|---|---|
| Software Publishers | 133,340 | 25.34 | $ 62.99 | $ 131,020 |
| Computer Systems Design and Related Services | 455,050 | 20.08 | $ 55.56 | $ 115,550 |
| Other Information Services | 58,420 | 16.10 | $ 75.39 | $ 156,800 |
| Computer and Peripheral Equipment Manufacturing | 23,080 | 14.82 | $ 73.48 | $ 152,840 |
| Data Processing, Hosting, and Related Services | 52,690 | 13.91 | $ 59.63 | $ 124,040 |
Top paying industries for Software Developers:
| Industry | Employment (1) | Percent of industry employment | Hourly mean wage | Annual mean wage (2) |
|---|---|---|---|---|
| Other Information Services | 58,420 | 16.10 | $ 75.39 | $ 156,800 |
| Computer and Peripheral Equipment Manufacturing | 23,080 | 14.82 | $ 73.48 | $ 152,840 |
| Independent Artists, Writers, and Performers | (8) | (8) | $ 72.13 | $ 150,030 |
| Scientific Research and Development Services | 39,960 | 5.02 | $ 68.30 | $ 142,070 |
| Personal Care Services | 90 | 0.01 | $ 67.35 | $ 140,080 |
States and areas with the highest published employment, location quotients, and wages for Software Developers are provided. For a list of all areas with employment in Software Developers, see the Create Customized Tables function.
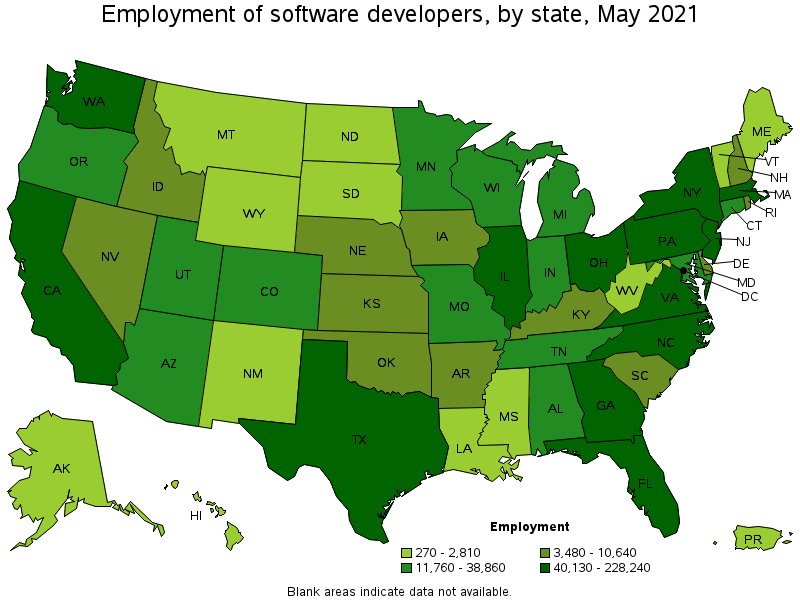
States with the highest employment level in Software Developers:
| State | Employment (1) | Employment per thousand jobs | Location quotient (9) | Hourly mean wage | Annual mean wage (2) |
|---|---|---|---|---|---|
| California | 228,240 | 13.81 | 1.43 | $ 70.56 | $ 146,770 |
| Texas | 103,510 | 8.47 | 0.87 | $ 53.77 | $ 111,830 |
| Washington | 81,520 | 25.43 | 2.63 | $ 69.78 | $ 145,150 |
| New York | 75,790 | 8.74 | 0.90 | $ 62.48 | $ 129,950 |
| Virginia | 68,250 | 18.18 | 1.88 | $ 61.46 | $ 127,830 |
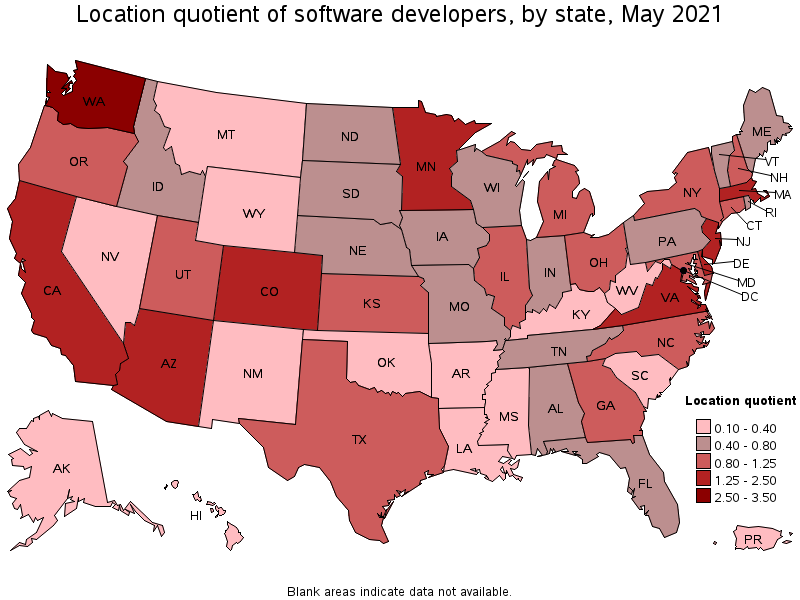
States with the highest concentration of jobs and location quotients in Software Developers:
| State | Employment (1) | Employment per thousand jobs | Location quotient (9) | Hourly mean wage | Annual mean wage (2) |
|---|---|---|---|---|---|
| Washington | 81,520 | 25.43 | 2.63 | $ 69.78 | $ 145,150 |
| Virginia | 68,250 | 18.18 | 1.88 | $ 61.46 | $ 127,830 |
| Massachusetts | 58,980 | 17.38 | 1.79 | $ 61.63 | $ 128,190 |
| Colorado | 38,860 | 14.83 | 1.53 | $ 57.76 | $ 120,140 |
| District of Columbia | 9,460 | 14.29 | 1.48 | $ 59.99 | $ 124,770 |
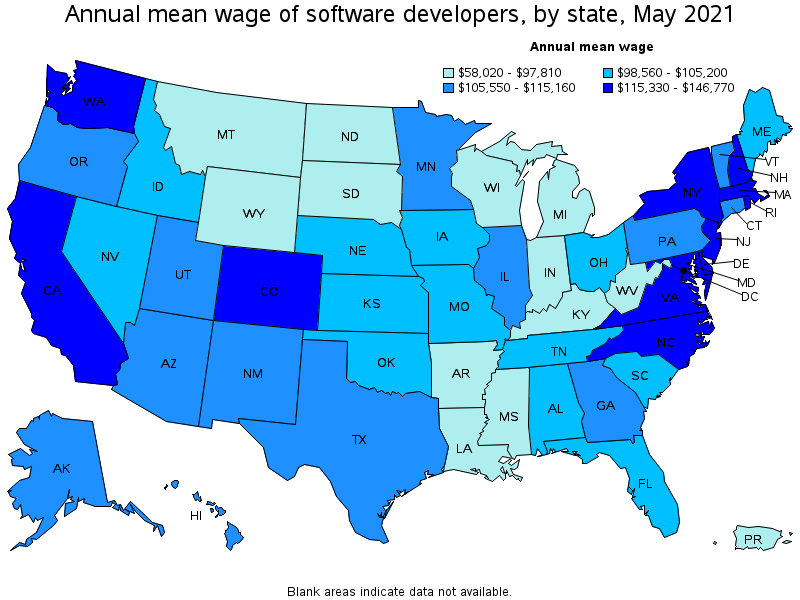
Top paying states for Software Developers:
| State | Employment (1) | Employment per thousand jobs | Location quotient (9) | Hourly mean wage | Annual mean wage (2) |
|---|---|---|---|---|---|
| California | 228,240 | 13.81 | 1.43 | $ 70.56 | $ 146,770 |
| Washington | 81,520 | 25.43 | 2.63 | $ 69.78 | $ 145,150 |
| Maryland | 25,710 | 10.10 | 1.04 | $ 63.09 | $ 131,240 |
| New York | 75,790 | 8.74 | 0.90 | $ 62.48 | $ 129,950 |
| Rhode Island | 3,490 | 7.63 | 0.79 | $ 61.92 | $ 128,790 |
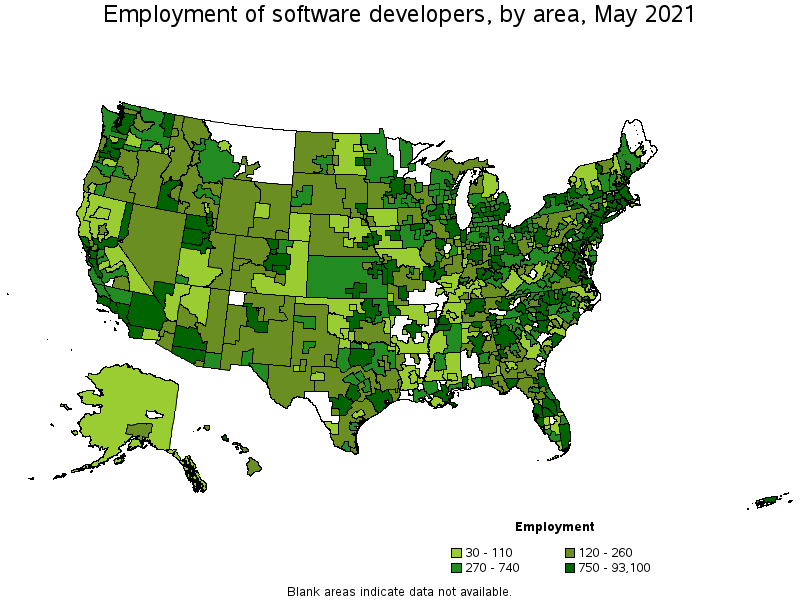
Metropolitan areas with the highest employment level in Software Developers:
| Metropolitan area | Employment (1) | Employment per thousand jobs | Location quotient (9) | Hourly mean wage | Annual mean wage (2) |
|---|---|---|---|---|---|
| New York-Newark-Jersey City, NY-NJ-PA | 93,100 | 10.73 | 1.11 | $ 64.24 | $ 133,620 |
| Seattle-Tacoma-Bellevue, WA | 73,860 | 38.52 | 3.98 | $ 71.26 | $ 148,220 |
| San Jose-Sunnyvale-Santa Clara, CA | 67,780 | 63.43 | 6.55 | $ 80.49 | $ 167,420 |
| San Francisco-Oakland-Hayward, CA | 64,460 | 28.75 | 2.97 | $ 76.12 | $ 158,320 |
| Washington-Arlington-Alexandria, DC-VA-MD-WV | 63,360 | 21.61 | 2.23 | $ 64.35 | $ 133,850 |
| Boston-Cambridge-Nashua, MA-NH | 55,690 | 21.54 | 2.22 | $ 62.21 | $ 129,400 |
| Los Angeles-Long Beach-Anaheim, CA | 49,020 | 8.57 | 0.89 | $ 60.20 | $ 125,210 |
| Dallas-Fort Worth-Arlington, TX | 42,880 | 11.95 | 1.23 | $ 56.30 | $ 117,100 |
| Chicago-Naperville-Elgin, IL-IN-WI | 38,110 | 9.00 | 0.93 | $ 54.81 | $ 114,000 |
| Atlanta-Sandy Springs-Roswell, GA | 36,080 | 13.94 | 1.44 | $ 56.78 | $ 118,100 |
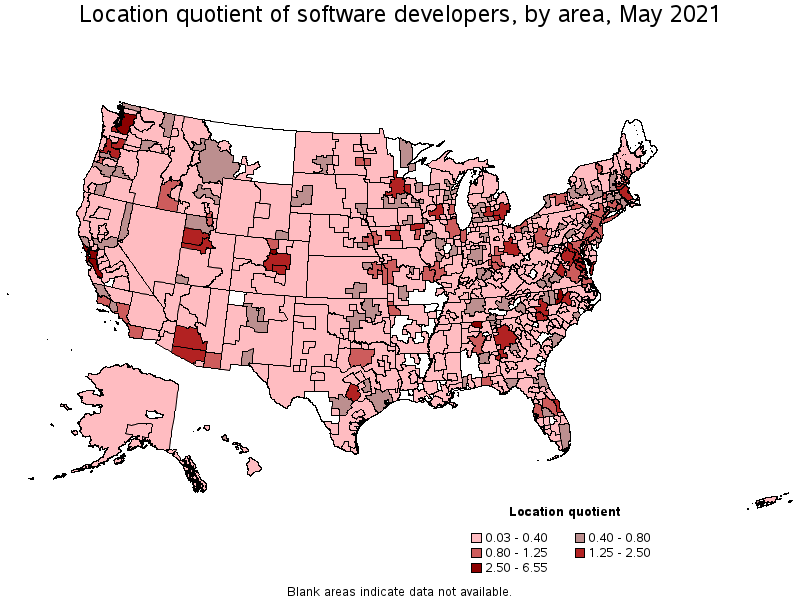
Metropolitan areas with the highest concentration of jobs and location quotients in Software Developers:
| Metropolitan area | Employment (1) | Employment per thousand jobs | Location quotient (9) | Hourly mean wage | Annual mean wage (2) |
|---|---|---|---|---|---|
| San Jose-Sunnyvale-Santa Clara, CA | 67,780 | 63.43 | 6.55 | $ 80.49 | $ 167,420 |
| Seattle-Tacoma-Bellevue, WA | 73,860 | 38.52 | 3.98 | $ 71.26 | $ 148,220 |
| Boulder, CO | 5,480 | 30.14 | 3.11 | $ 60.09 | $ 124,990 |
| San Francisco-Oakland-Hayward, CA | 64,460 | 28.75 | 2.97 | $ 76.12 | $ 158,320 |
| Huntsville, AL | 6,540 | 28.39 | 2.93 | $ 54.60 | $ 113,570 |
| Durham-Chapel Hill, NC | 8,260 | 26.47 | 2.73 | $ 58.16 | $ 120,980 |
| Cedar Rapids, IA | 3,010 | 22.11 | 2.28 | $ 54.69 | $ 113,750 |
| Washington-Arlington-Alexandria, DC-VA-MD-WV | 63,360 | 21.61 | 2.23 | $ 64.35 | $ 133,850 |
| Boston-Cambridge-Nashua, MA-NH | 55,690 | 21.54 | 2.22 | $ 62.21 | $ 129,400 |
| Raleigh, NC | 13,110 | 20.70 | 2.14 | $ 58.36 | $ 121,400 |
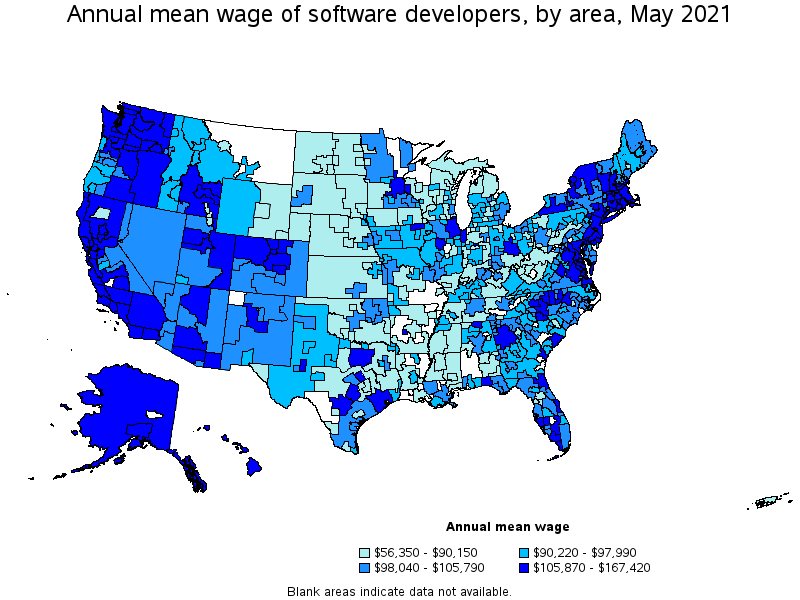
Top paying metropolitan areas for Software Developers:
| Metropolitan area | Employment (1) | Employment per thousand jobs | Location quotient (9) | Hourly mean wage | Annual mean wage (2) |
|---|---|---|---|---|---|
| San Jose-Sunnyvale-Santa Clara, CA | 67,780 | 63.43 | 6.55 | $ 80.49 | $ 167,420 |
| San Francisco-Oakland-Hayward, CA | 64,460 | 28.75 | 2.97 | $ 76.12 | $ 158,320 |
| Seattle-Tacoma-Bellevue, WA | 73,860 | 38.52 | 3.98 | $ 71.26 | $ 148,220 |
| Baltimore-Columbia-Towson, MD | 13,060 | 10.40 | 1.07 | $ 66.11 | $ 137,510 |
| Santa Cruz-Watsonville, CA | 490 | 5.29 | 0.55 | $ 64.75 | $ 134,680 |
| Washington-Arlington-Alexandria, DC-VA-MD-WV | 63,360 | 21.61 | 2.23 | $ 64.35 | $ 133,850 |
| New York-Newark-Jersey City, NY-NJ-PA | 93,100 | 10.73 | 1.11 | $ 64.24 | $ 133,620 |
| San Diego-Carlsbad, CA | 16,510 | 11.87 | 1.23 | $ 64.22 | $ 133,580 |
| Napa, CA | 150 | 2.14 | 0.22 | $ 63.43 | $ 131,930 |
| Sacramento--Roseville--Arden-Arcade, CA | 6,440 | 6.56 | 0.68 | $ 62.83 | $ 130,690 |
Nonmetropolitan areas with the highest employment in Software Developers:
| Nonmetropolitan area | Employment (1) | Employment per thousand jobs | Location quotient (9) | Hourly mean wage | Annual mean wage (2) |
|---|---|---|---|---|---|
| Kansas nonmetropolitan area | 730 | 1.93 | 0.20 | $ 42.66 | $ 88,730 |
| Northeastern Wisconsin nonmetropolitan area | 720 | 3.76 | 0.39 | $ 42.67 | $ 88,760 |
| Piedmont North Carolina nonmetropolitan area | 700 | 2.85 | 0.29 | $ 47.92 | $ 99,680 |
| Southeast Minnesota nonmetropolitan area | 660 | 4.42 | 0.46 | $ 48.06 | $ 99,960 |
| West Central-Southwest New Hampshire nonmetropolitan area | 650 | 6.71 | 0.69 | $ 51.39 | $ 106,890 |
Nonmetropolitan areas with the highest concentration of jobs and location quotients in Software Developers:
| Nonmetropolitan area | Employment (1) | Employment per thousand jobs | Location quotient (9) | Hourly mean wage | Annual mean wage (2) |
|---|---|---|---|---|---|
| Northeast Virginia nonmetropolitan area | 610 | 12.59 | 1.30 | $ 51.01 | $ 106,100 |
| West Central-Southwest New Hampshire nonmetropolitan area | 650 | 6.71 | 0.69 | $ 51.39 | $ 106,890 |
| Southeast Minnesota nonmetropolitan area | 660 | 4.42 | 0.46 | $ 48.06 | $ 99,960 |
| Southwest Montana nonmetropolitan area | 590 | 4.24 | 0.44 | $ 43.85 | $ 91,200 |
| Eastern Washington nonmetropolitan area | 360 | 3.80 | 0.39 | $ 51.02 | $ 106,120 |
Top paying nonmetropolitan areas for Software Developers:
| Nonmetropolitan area | Employment (1) | Employment per thousand jobs | Location quotient (9) | Hourly mean wage | Annual mean wage (2) |
|---|---|---|---|---|---|
| Southern Vermont nonmetropolitan area | 290 | 3.01 | 0.31 | $ 63.97 | $ 133,050 |
| Eastern Oregon nonmetropolitan area | 220 | 3.19 | 0.33 | $ 60.24 | $ 125,310 |
| Western Washington nonmetropolitan area | 330 | 2.78 | 0.29 | $ 57.50 | $ 119,610 |
| Hawaii / Kauai nonmetropolitan area | 190 | 2.17 | 0.22 | $ 55.66 | $ 115,770 |
| Massachusetts nonmetropolitan area | 60 | 1.10 | 0.11 | $ 55.41 | $ 115,260 |
These estimates are calculated with data collected from employers in all industry sectors, all metropolitan and nonmetropolitan areas, and all states and the District of Columbia. The top employment and wage figures are provided above. The complete list is available in the downloadable XLS files.
The percentile wage estimate is the value of a wage below which a certain percent of workers fall. The median wage is the 50th percentile wage estimate—50 percent of workers earn less than the median and 50 percent of workers earn more than the median. More about percentile wages.
(1) Estimates for detailed occupations do not sum to the totals because the totals include occupations not shown separately. Estimates do not include self-employed workers.
(2) Annual wages have been calculated by multiplying the hourly mean wage by a "year-round, full-time" hours figure of 2,080 hours; for those occupations where there is not an hourly wage published, the annual wage has been directly calculated from the reported survey data.
(3) The relative standard error (RSE) is a measure of the reliability of a survey statistic. The smaller the relative standard error, the more precise the estimate.
(8) Estimate not released.
(9) The location quotient is the ratio of the area concentration of occupational employment to the national average concentration. A location quotient greater than one indicates the occupation has a higher share of employment than average, and a location quotient less than one indicates the occupation is less prevalent in the area than average.
Other OEWS estimates and related information:
May 2021 National Occupational Employment and Wage Estimates
May 2021 State Occupational Employment and Wage Estimates
May 2021 Metropolitan and Nonmetropolitan Area Occupational Employment and Wage Estimates
May 2021 National Industry-Specific Occupational Employment and Wage Estimates
Last Modified Date: March 31, 2022