
An official website of the United States government
An official website of the United States government
The .gov means it's official.
Federal government websites often end in .gov or .mil. Before sharing sensitive information,
make sure you're on a federal government site.
The site is secure.
The
https:// ensures that you are connecting to the official website and that any
information you provide is encrypted and transmitted securely.
Develop and execute software tests to identify software problems and their causes. Test system modifications to prepare for implementation. Document software and application defects using a bug tracking system and report defects to software or web developers. Create and maintain databases of known defects. May participate in software design reviews to provide input on functional requirements, operational characteristics, product designs, and schedules.
Employment estimate and mean wage estimates for Software Quality Assurance Analysts and Testers:
| Employment (1) | Employment RSE (3) |
Mean hourly wage |
Mean annual wage (2) |
Wage RSE (3) |
|---|---|---|---|---|
| 190,120 | 1.7 % | $ 46.97 | $ 97,710 | 0.7 % |
Percentile wage estimates for Software Quality Assurance Analysts and Testers:
| Percentile | 10% | 25% | 50% (Median) |
75% | 90% |
|---|---|---|---|---|---|
| Hourly Wage | $ 23.54 | $ 34.57 | $ 47.22 | $ 59.88 | $ 73.68 |
| Annual Wage (2) | $ 48,960 | $ 71,910 | $ 98,220 | $ 124,550 | $ 153,250 |
Industries with the highest published employment and wages for Software Quality Assurance Analysts and Testers are provided. For a list of all industries with employment in Software Quality Assurance Analysts and Testers, see the Create Customized Tables function.
Industries with the highest levels of employment in Software Quality Assurance Analysts and Testers:
| Industry | Employment (1) | Percent of industry employment | Hourly mean wage | Annual mean wage (2) |
|---|---|---|---|---|
| Computer Systems Design and Related Services | 63,670 | 2.81 | $ 47.09 | $ 97,950 |
| Software Publishers | 16,240 | 3.09 | $ 46.92 | $ 97,600 |
| Employment Services | 11,260 | 0.32 | $ 43.84 | $ 91,190 |
| Management of Companies and Enterprises | 10,880 | 0.43 | $ 47.82 | $ 99,460 |
| Data Processing, Hosting, and Related Services | 7,800 | 2.06 | $ 41.05 | $ 85,380 |
Industries with the highest concentration of employment in Software Quality Assurance Analysts and Testers:
| Industry | Employment (1) | Percent of industry employment | Hourly mean wage | Annual mean wage (2) |
|---|---|---|---|---|
| Software Publishers | 16,240 | 3.09 | $ 46.92 | $ 97,600 |
| Computer Systems Design and Related Services | 63,670 | 2.81 | $ 47.09 | $ 97,950 |
| Computer and Peripheral Equipment Manufacturing | 3,260 | 2.10 | $ 56.39 | $ 117,280 |
| Data Processing, Hosting, and Related Services | 7,800 | 2.06 | $ 41.05 | $ 85,380 |
| Other Information Services | 6,760 | 1.86 | $ 58.71 | $ 122,110 |
Top paying industries for Software Quality Assurance Analysts and Testers:
| Industry | Employment (1) | Percent of industry employment | Hourly mean wage | Annual mean wage (2) |
|---|---|---|---|---|
| Automobile Dealers | 100 | 0.01 | $ 70.13 | $ 145,860 |
| Semiconductor and Other Electronic Component Manufacturing | 2,090 | 0.59 | $ 60.46 | $ 125,750 |
| Other Information Services | 6,760 | 1.86 | $ 58.71 | $ 122,110 |
| Natural Gas Distribution | 220 | 0.20 | $ 57.51 | $ 119,610 |
| Computer and Peripheral Equipment Manufacturing | 3,260 | 2.10 | $ 56.39 | $ 117,280 |
States and areas with the highest published employment, location quotients, and wages for Software Quality Assurance Analysts and Testers are provided. For a list of all areas with employment in Software Quality Assurance Analysts and Testers, see the Create Customized Tables function.
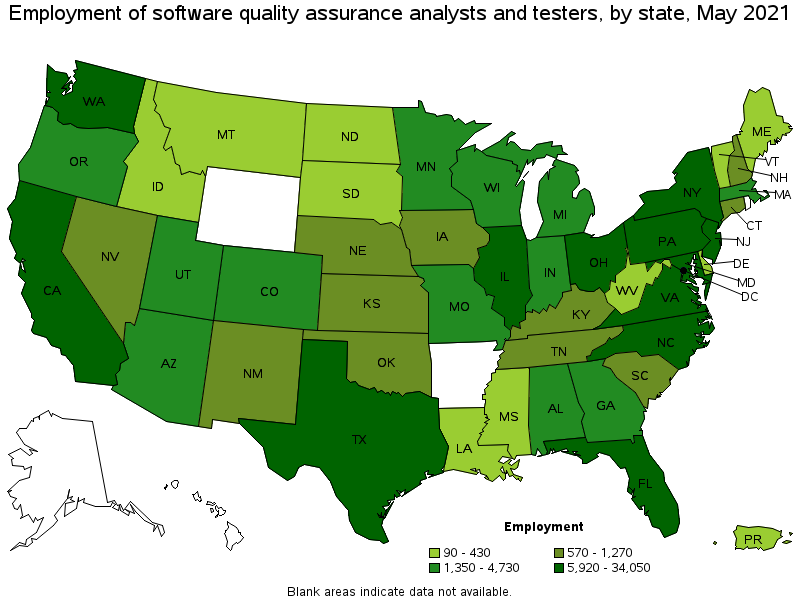
States with the highest employment level in Software Quality Assurance Analysts and Testers:
| State | Employment (1) | Employment per thousand jobs | Location quotient (9) | Hourly mean wage | Annual mean wage (2) |
|---|---|---|---|---|---|
| California | 34,050 | 2.06 | 1.53 | $ 55.49 | $ 115,420 |
| Texas | 17,960 | 1.47 | 1.09 | $ 43.45 | $ 90,370 |
| Florida | 10,740 | 1.25 | 0.92 | $ 38.25 | $ 79,550 |
| Washington | 10,240 | 3.19 | 2.37 | $ 50.43 | $ 104,900 |
| Maryland | 10,210 | 4.01 | 2.97 | $ 53.34 | $ 110,950 |
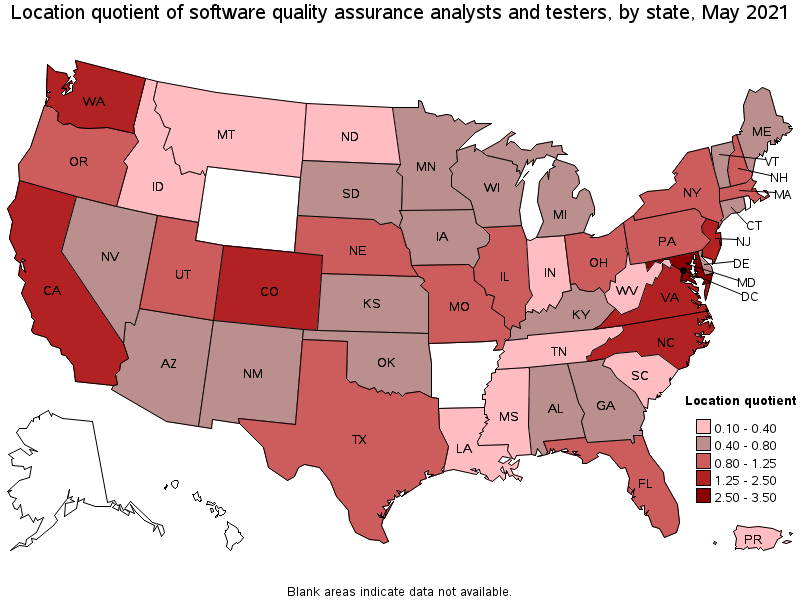
States with the highest concentration of jobs and location quotients in Software Quality Assurance Analysts and Testers:
| State | Employment (1) | Employment per thousand jobs | Location quotient (9) | Hourly mean wage | Annual mean wage (2) |
|---|---|---|---|---|---|
| Maryland | 10,210 | 4.01 | 2.97 | $ 53.34 | $ 110,950 |
| Washington | 10,240 | 3.19 | 2.37 | $ 50.43 | $ 104,900 |
| Virginia | 9,310 | 2.48 | 1.84 | $ 49.16 | $ 102,250 |
| California | 34,050 | 2.06 | 1.53 | $ 55.49 | $ 115,420 |
| New Jersey | 7,770 | 2.02 | 1.50 | $ 51.86 | $ 107,870 |
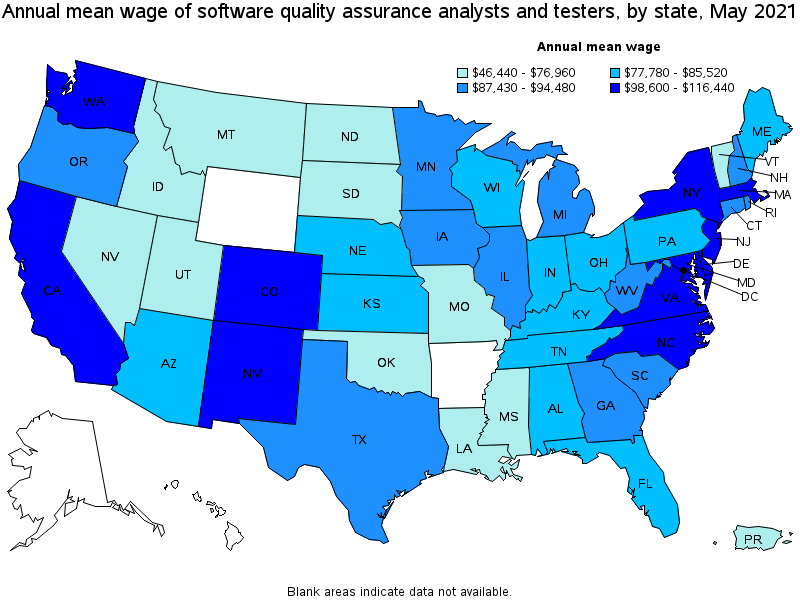
Top paying states for Software Quality Assurance Analysts and Testers:
| State | Employment (1) | Employment per thousand jobs | Location quotient (9) | Hourly mean wage | Annual mean wage (2) |
|---|---|---|---|---|---|
| New York | 9,630 | 1.11 | 0.82 | $ 55.98 | $ 116,440 |
| California | 34,050 | 2.06 | 1.53 | $ 55.49 | $ 115,420 |
| Maryland | 10,210 | 4.01 | 2.97 | $ 53.34 | $ 110,950 |
| New Mexico | 570 | 0.73 | 0.54 | $ 53.06 | $ 110,370 |
| Massachusetts | 4,400 | 1.30 | 0.96 | $ 52.08 | $ 108,320 |
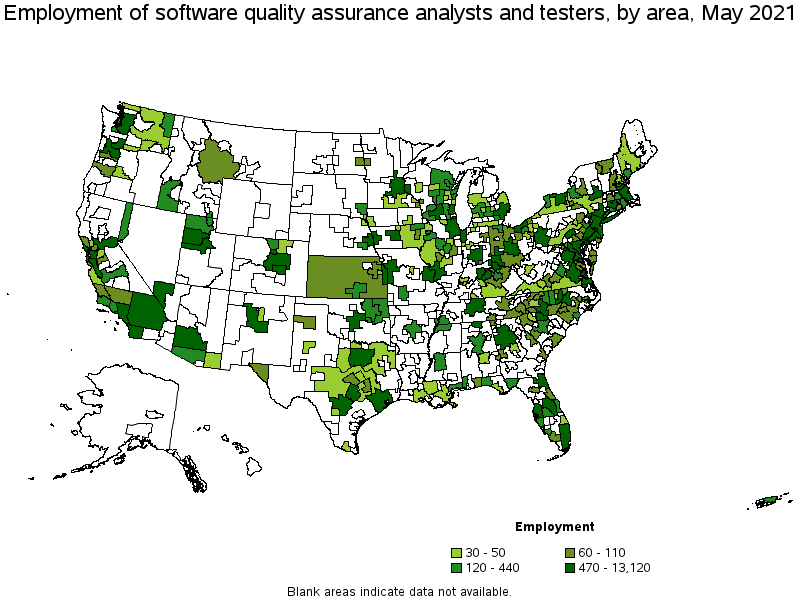
Metropolitan areas with the highest employment level in Software Quality Assurance Analysts and Testers:
| Metropolitan area | Employment (1) | Employment per thousand jobs | Location quotient (9) | Hourly mean wage | Annual mean wage (2) |
|---|---|---|---|---|---|
| New York-Newark-Jersey City, NY-NJ-PA | 13,120 | 1.51 | 1.12 | $ 57.08 | $ 118,730 |
| Washington-Arlington-Alexandria, DC-VA-MD-WV | 11,600 | 3.96 | 2.93 | $ 50.87 | $ 105,810 |
| San Jose-Sunnyvale-Santa Clara, CA | 9,480 | 8.88 | 6.58 | $ 66.52 | $ 138,360 |
| Seattle-Tacoma-Bellevue, WA | 9,110 | 4.75 | 3.52 | $ 51.33 | $ 106,760 |
| San Francisco-Oakland-Hayward, CA | 7,920 | 3.53 | 2.62 | $ 60.89 | $ 126,640 |
| Dallas-Fort Worth-Arlington, TX | 7,850 | 2.19 | 1.62 | $ 43.92 | $ 91,360 |
| Los Angeles-Long Beach-Anaheim, CA | 7,300 | 1.28 | 0.95 | $ 47.59 | $ 98,980 |
| Chicago-Naperville-Elgin, IL-IN-WI | 6,300 | 1.49 | 1.10 | $ 45.35 | $ 94,330 |
| Baltimore-Columbia-Towson, MD | 4,840 | 3.85 | 2.86 | $ 55.74 | $ 115,940 |
| Boston-Cambridge-Nashua, MA-NH | 4,300 | 1.66 | 1.23 | $ 52.42 | $ 109,040 |
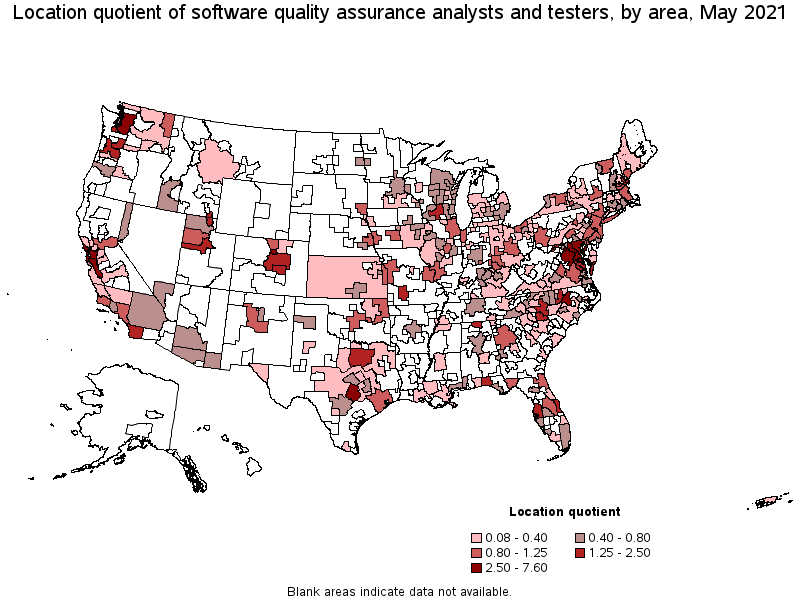
Metropolitan areas with the highest concentration of jobs and location quotients in Software Quality Assurance Analysts and Testers:
| Metropolitan area | Employment (1) | Employment per thousand jobs | Location quotient (9) | Hourly mean wage | Annual mean wage (2) |
|---|---|---|---|---|---|
| California-Lexington Park, MD | 480 | 10.26 | 7.60 | $ 59.02 | $ 122,750 |
| San Jose-Sunnyvale-Santa Clara, CA | 9,480 | 8.88 | 6.58 | $ 66.52 | $ 138,360 |
| Seattle-Tacoma-Bellevue, WA | 9,110 | 4.75 | 3.52 | $ 51.33 | $ 106,760 |
| Boulder, CO | 780 | 4.27 | 3.16 | $ 48.26 | $ 100,380 |
| Washington-Arlington-Alexandria, DC-VA-MD-WV | 11,600 | 3.96 | 2.93 | $ 50.87 | $ 105,810 |
| Baltimore-Columbia-Towson, MD | 4,840 | 3.85 | 2.86 | $ 55.74 | $ 115,940 |
| Raleigh, NC | 2,320 | 3.66 | 2.71 | $ 51.79 | $ 107,720 |
| San Francisco-Oakland-Hayward, CA | 7,920 | 3.53 | 2.62 | $ 60.89 | $ 126,640 |
| Austin-Round Rock, TX | 3,770 | 3.51 | 2.60 | $ 44.39 | $ 92,320 |
| Durham-Chapel Hill, NC | 1,010 | 3.24 | 2.40 | $ 48.01 | $ 99,860 |
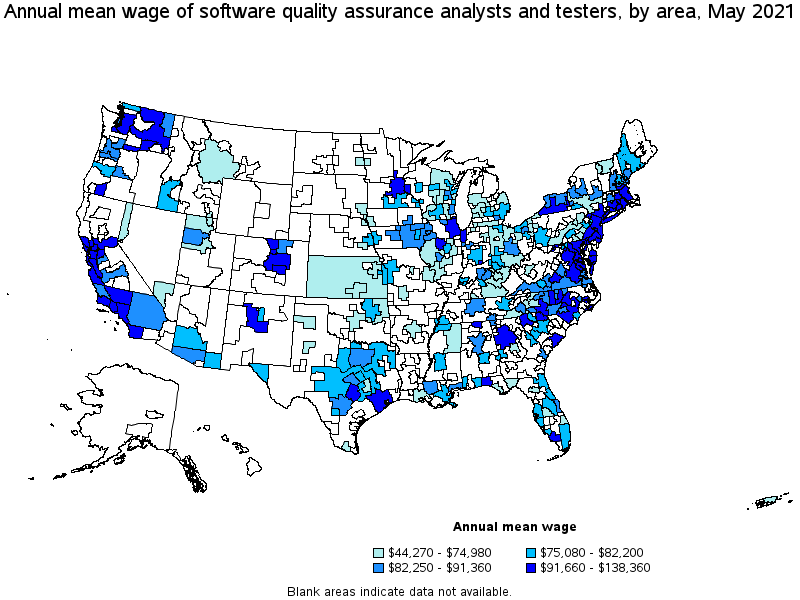
Top paying metropolitan areas for Software Quality Assurance Analysts and Testers:
| Metropolitan area | Employment (1) | Employment per thousand jobs | Location quotient (9) | Hourly mean wage | Annual mean wage (2) |
|---|---|---|---|---|---|
| San Jose-Sunnyvale-Santa Clara, CA | 9,480 | 8.88 | 6.58 | $ 66.52 | $ 138,360 |
| San Francisco-Oakland-Hayward, CA | 7,920 | 3.53 | 2.62 | $ 60.89 | $ 126,640 |
| California-Lexington Park, MD | 480 | 10.26 | 7.60 | $ 59.02 | $ 122,750 |
| New York-Newark-Jersey City, NY-NJ-PA | 13,120 | 1.51 | 1.12 | $ 57.08 | $ 118,730 |
| Baltimore-Columbia-Towson, MD | 4,840 | 3.85 | 2.86 | $ 55.74 | $ 115,940 |
| Albuquerque, NM | 480 | 1.31 | 0.97 | $ 55.28 | $ 114,990 |
| Kennewick-Richland, WA | 50 | 0.44 | 0.33 | $ 53.87 | $ 112,050 |
| Santa Rosa, CA | 100 | 0.53 | 0.39 | $ 53.46 | $ 111,200 |
| Santa Cruz-Watsonville, CA | 80 | 0.86 | 0.63 | $ 53.43 | $ 111,130 |
| Boston-Cambridge-Nashua, MA-NH | 4,300 | 1.66 | 1.23 | $ 52.42 | $ 109,040 |
Nonmetropolitan areas with the highest employment in Software Quality Assurance Analysts and Testers:
| Nonmetropolitan area | Employment (1) | Employment per thousand jobs | Location quotient (9) | Hourly mean wage | Annual mean wage (2) |
|---|---|---|---|---|---|
| Northeastern Wisconsin nonmetropolitan area | 160 | 0.82 | 0.61 | $ 34.89 | $ 72,580 |
| Northeast Oklahoma nonmetropolitan area | 140 | 1.28 | 0.95 | $ 21.29 | $ 44,270 |
| South Central Wisconsin nonmetropolitan area | 120 | 0.61 | 0.45 | $ 33.14 | $ 68,940 |
| Northeast Virginia nonmetropolitan area | 100 | 2.08 | 1.54 | $ 44.54 | $ 92,640 |
| Southeast Coastal North Carolina nonmetropolitan area | 100 | 0.41 | 0.30 | $ 44.29 | $ 92,120 |
Nonmetropolitan areas with the highest concentration of jobs and location quotients in Software Quality Assurance Analysts and Testers:
| Nonmetropolitan area | Employment (1) | Employment per thousand jobs | Location quotient (9) | Hourly mean wage | Annual mean wage (2) |
|---|---|---|---|---|---|
| Northeast Virginia nonmetropolitan area | 100 | 2.08 | 1.54 | $ 44.54 | $ 92,640 |
| Northern Vermont nonmetropolitan area | 90 | 1.31 | 0.97 | $ 36.05 | $ 74,980 |
| Northeast Oklahoma nonmetropolitan area | 140 | 1.28 | 0.95 | $ 21.29 | $ 44,270 |
| Northeastern Wisconsin nonmetropolitan area | 160 | 0.82 | 0.61 | $ 34.89 | $ 72,580 |
| Mountain North Carolina nonmetropolitan area | 90 | 0.74 | 0.55 | $ 26.14 | $ 54,370 |
Top paying nonmetropolitan areas for Software Quality Assurance Analysts and Testers:
| Nonmetropolitan area | Employment (1) | Employment per thousand jobs | Location quotient (9) | Hourly mean wage | Annual mean wage (2) |
|---|---|---|---|---|---|
| Southwest New York nonmetropolitan area | 40 | 0.26 | 0.19 | $ 45.31 | $ 94,250 |
| Northeast Virginia nonmetropolitan area | 100 | 2.08 | 1.54 | $ 44.54 | $ 92,640 |
| Southeast Coastal North Carolina nonmetropolitan area | 100 | 0.41 | 0.30 | $ 44.29 | $ 92,120 |
| Eastern Washington nonmetropolitan area | 40 | 0.40 | 0.29 | $ 44.14 | $ 91,820 |
| West Central-Southwest New Hampshire nonmetropolitan area | 70 | 0.72 | 0.53 | $ 43.19 | $ 89,840 |
These estimates are calculated with data collected from employers in all industry sectors, all metropolitan and nonmetropolitan areas, and all states and the District of Columbia. The top employment and wage figures are provided above. The complete list is available in the downloadable XLS files.
The percentile wage estimate is the value of a wage below which a certain percent of workers fall. The median wage is the 50th percentile wage estimate—50 percent of workers earn less than the median and 50 percent of workers earn more than the median. More about percentile wages.
(1) Estimates for detailed occupations do not sum to the totals because the totals include occupations not shown separately. Estimates do not include self-employed workers.
(2) Annual wages have been calculated by multiplying the hourly mean wage by a "year-round, full-time" hours figure of 2,080 hours; for those occupations where there is not an hourly wage published, the annual wage has been directly calculated from the reported survey data.
(3) The relative standard error (RSE) is a measure of the reliability of a survey statistic. The smaller the relative standard error, the more precise the estimate.
(9) The location quotient is the ratio of the area concentration of occupational employment to the national average concentration. A location quotient greater than one indicates the occupation has a higher share of employment than average, and a location quotient less than one indicates the occupation is less prevalent in the area than average.
Other OEWS estimates and related information:
May 2021 National Occupational Employment and Wage Estimates
May 2021 State Occupational Employment and Wage Estimates
May 2021 Metropolitan and Nonmetropolitan Area Occupational Employment and Wage Estimates
May 2021 National Industry-Specific Occupational Employment and Wage Estimates
Last Modified Date: March 31, 2022