
An official website of the United States government
An official website of the United States government
The .gov means it's official.
Federal government websites often end in .gov or .mil. Before sharing sensitive information,
make sure you're on a federal government site.
The site is secure.
The
https:// ensures that you are connecting to the official website and that any
information you provide is encrypted and transmitted securely.
Design digital user interfaces or websites. Develop and test layouts, interfaces, functionality, and navigation menus to ensure compatibility and usability across browsers or devices. May use web framework applications as well as client-side code and processes. May evaluate web design following web and accessibility standards, and may analyze web use metrics and optimize websites for marketability and search engine ranking. May design and test interfaces that facilitate the human-computer interaction and maximize the usability of digital devices, websites, and software with a focus on aesthetics and design. May create graphics used in websites and manage website content and links. Excludes �Special Effects Artists and Animators� (27-1014) and �Graphic Designers� (27-1024).
Employment estimate and mean wage estimates for Web and Digital Interface Designers:
| Employment (1) | Employment RSE (3) |
Mean hourly wage |
Mean annual wage (2) |
Wage RSE (3) |
|---|---|---|---|---|
| 82,380 | 2.8 % | $ 45.90 | $ 95,460 | 2.3 % |
Percentile wage estimates for Web and Digital Interface Designers:
| Percentile | 10% | 25% | 50% (Median) |
75% | 90% |
|---|---|---|---|---|---|
| Hourly Wage | $ 18.53 | $ 27.51 | $ 38.41 | $ 60.63 | $ 80.87 |
| Annual Wage (2) | $ 38,550 | $ 57,220 | $ 79,890 | $ 126,110 | $ 168,200 |
Industries with the highest published employment and wages for Web and Digital Interface Designers are provided. For a list of all industries with employment in Web and Digital Interface Designers, see the Create Customized Tables function.
Industries with the highest levels of employment in Web and Digital Interface Designers:
| Industry | Employment (1) | Percent of industry employment | Hourly mean wage | Annual mean wage (2) |
|---|---|---|---|---|
| Computer Systems Design and Related Services | 16,080 | 0.71 | $ 48.33 | $ 100,530 |
| Software Publishers | 12,390 | 2.35 | $ 70.90 | $ 147,470 |
| Advertising, Public Relations, and Related Services | 4,320 | 0.99 | $ 35.34 | $ 73,500 |
| Other Information Services | 4,140 | 1.14 | $ 50.07 | $ 104,140 |
| Management of Companies and Enterprises | 3,690 | 0.15 | $ 44.03 | $ 91,580 |
Industries with the highest concentration of employment in Web and Digital Interface Designers:
| Industry | Employment (1) | Percent of industry employment | Hourly mean wage | Annual mean wage (2) |
|---|---|---|---|---|
| Software Publishers | 12,390 | 2.35 | $ 70.90 | $ 147,470 |
| Other Information Services | 4,140 | 1.14 | $ 50.07 | $ 104,140 |
| Advertising, Public Relations, and Related Services | 4,320 | 0.99 | $ 35.34 | $ 73,500 |
| Sound Recording Industries | 160 | 0.89 | $ 26.26 | $ 54,630 |
| Electronic Shopping and Mail-Order Houses | 3,380 | 0.73 | $ 38.84 | $ 80,780 |
Top paying industries for Web and Digital Interface Designers:
| Industry | Employment (1) | Percent of industry employment | Hourly mean wage | Annual mean wage (2) |
|---|---|---|---|---|
| Software Publishers | 12,390 | 2.35 | $ 70.90 | $ 147,470 |
| Computer and Peripheral Equipment Manufacturing | 210 | 0.13 | $ 54.62 | $ 113,620 |
| Securities, Commodity Contracts, and Other Financial Investments and Related Activities | 900 | 0.09 | $ 54.57 | $ 113,500 |
| Personal Care Services | (8) | (8) | $ 52.88 | $ 109,990 |
| Credit Intermediation and Related Activities (5221 and 5223 only) | 1,290 | 0.06 | $ 51.54 | $ 107,200 |
States and areas with the highest published employment, location quotients, and wages for Web and Digital Interface Designers are provided. For a list of all areas with employment in Web and Digital Interface Designers, see the Create Customized Tables function.
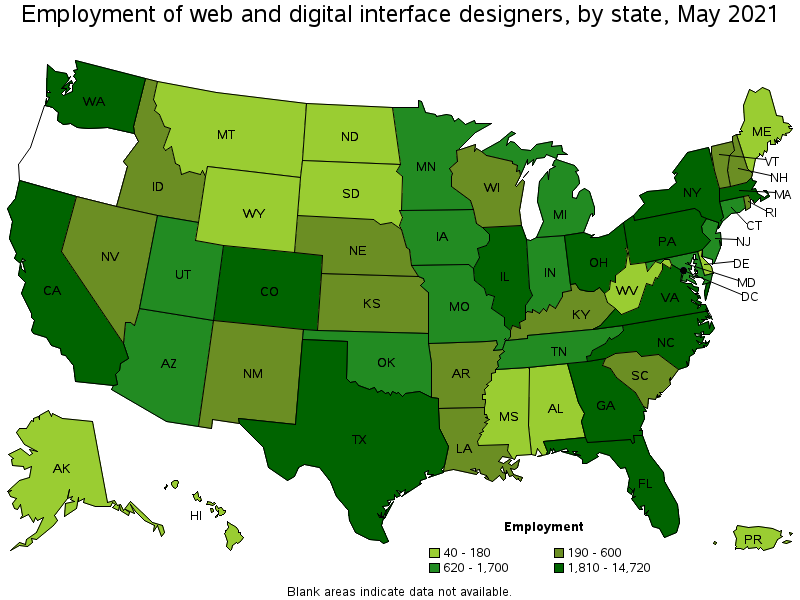
States with the highest employment level in Web and Digital Interface Designers:
| State | Employment (1) | Employment per thousand jobs | Location quotient (9) | Hourly mean wage | Annual mean wage (2) |
|---|---|---|---|---|---|
| Washington | 14,720 | 4.59 | 7.85 | $ 67.87 | $ 141,170 |
| California | 11,180 | 0.68 | 1.16 | $ 52.07 | $ 108,310 |
| New York | 8,060 | 0.93 | 1.59 | $ 57.58 | $ 119,770 |
| Texas | 4,820 | 0.39 | 0.67 | $ 40.51 | $ 84,270 |
| North Carolina | 3,320 | 0.75 | 1.29 | $ 34.68 | $ 72,130 |
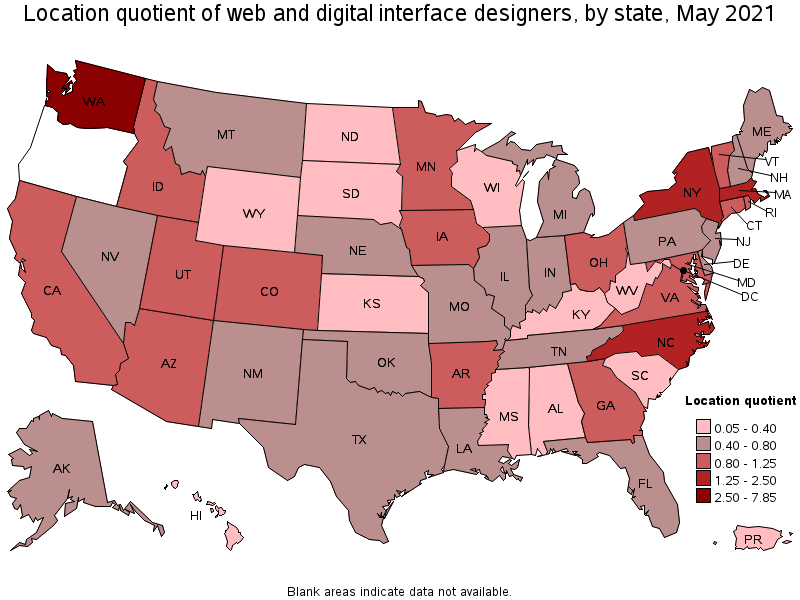
States with the highest concentration of jobs and location quotients in Web and Digital Interface Designers:
| State | Employment (1) | Employment per thousand jobs | Location quotient (9) | Hourly mean wage | Annual mean wage (2) |
|---|---|---|---|---|---|
| Washington | 14,720 | 4.59 | 7.85 | $ 67.87 | $ 141,170 |
| District of Columbia | 620 | 0.94 | 1.61 | $ 40.90 | $ 85,070 |
| New York | 8,060 | 0.93 | 1.59 | $ 57.58 | $ 119,770 |
| Massachusetts | 2,570 | 0.76 | 1.29 | $ 40.00 | $ 83,190 |
| North Carolina | 3,320 | 0.75 | 1.29 | $ 34.68 | $ 72,130 |
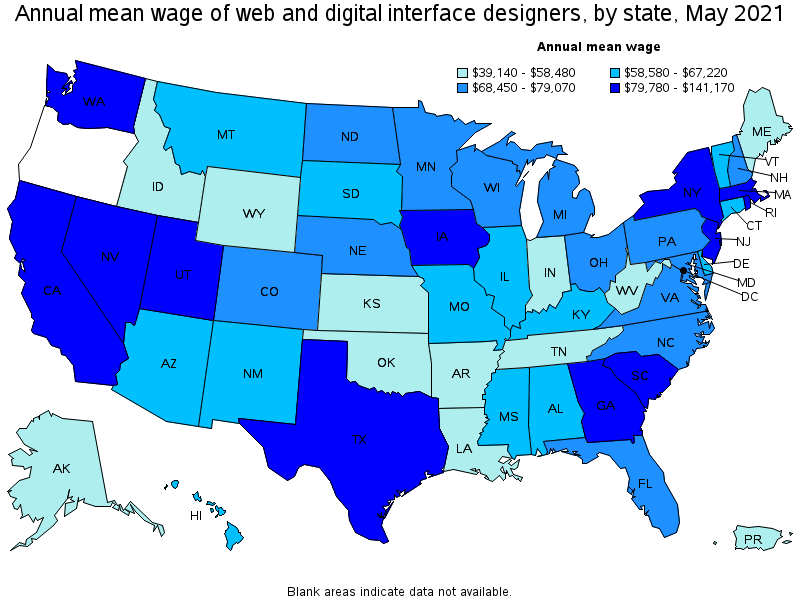
Top paying states for Web and Digital Interface Designers:
| State | Employment (1) | Employment per thousand jobs | Location quotient (9) | Hourly mean wage | Annual mean wage (2) |
|---|---|---|---|---|---|
| Washington | 14,720 | 4.59 | 7.85 | $ 67.87 | $ 141,170 |
| New York | 8,060 | 0.93 | 1.59 | $ 57.58 | $ 119,770 |
| Iowa | 930 | 0.62 | 1.07 | $ 53.46 | $ 111,200 |
| California | 11,180 | 0.68 | 1.16 | $ 52.07 | $ 108,310 |
| New Jersey | 1,430 | 0.37 | 0.63 | $ 41.16 | $ 85,610 |
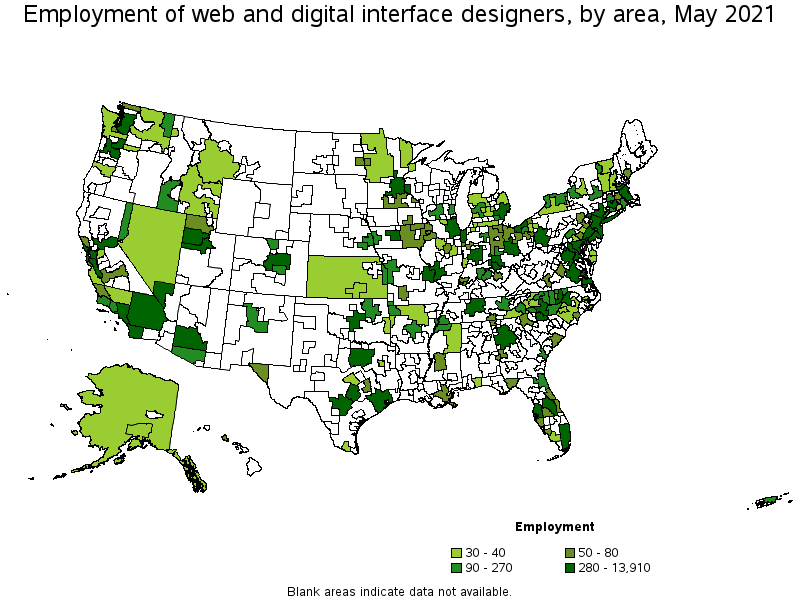
Metropolitan areas with the highest employment level in Web and Digital Interface Designers:
| Metropolitan area | Employment (1) | Employment per thousand jobs | Location quotient (9) | Hourly mean wage | Annual mean wage (2) |
|---|---|---|---|---|---|
| Seattle-Tacoma-Bellevue, WA | 13,910 | 7.25 | 12.40 | $ 69.58 | $ 144,720 |
| New York-Newark-Jersey City, NY-NJ-PA | 7,680 | 0.89 | 1.51 | $ 57.82 | $ 120,270 |
| Los Angeles-Long Beach-Anaheim, CA | 3,390 | 0.59 | 1.01 | $ 44.21 | $ 91,950 |
| San Francisco-Oakland-Hayward, CA | 3,240 | 1.44 | 2.47 | $ 62.38 | $ 129,760 |
| Washington-Arlington-Alexandria, DC-VA-MD-WV | 2,510 | 0.86 | 1.46 | $ 42.09 | $ 87,560 |
| Boston-Cambridge-Nashua, MA-NH | 2,310 | 0.89 | 1.53 | $ 40.27 | $ 83,760 |
| Dallas-Fort Worth-Arlington, TX | 1,860 | 0.52 | 0.89 | $ 44.89 | $ 93,370 |
| Atlanta-Sandy Springs-Roswell, GA | 1,670 | 0.65 | 1.11 | $ 41.64 | $ 86,600 |
| Chicago-Naperville-Elgin, IL-IN-WI | 1,620 | 0.38 | 0.65 | $ 32.05 | $ 66,670 |
| San Jose-Sunnyvale-Santa Clara, CA | 1,470 | 1.38 | 2.36 | $ 66.21 | $ 137,720 |
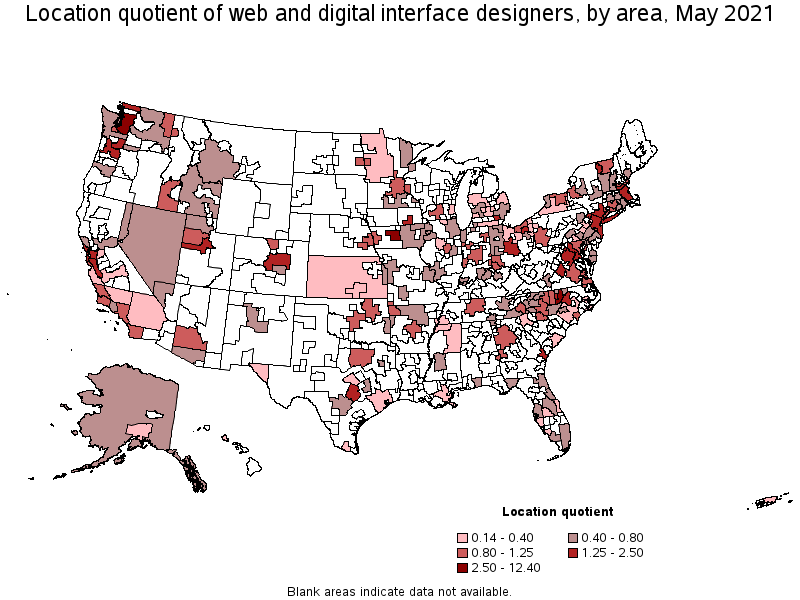
Metropolitan areas with the highest concentration of jobs and location quotients in Web and Digital Interface Designers:
| Metropolitan area | Employment (1) | Employment per thousand jobs | Location quotient (9) | Hourly mean wage | Annual mean wage (2) |
|---|---|---|---|---|---|
| Seattle-Tacoma-Bellevue, WA | 13,910 | 7.25 | 12.40 | $ 69.58 | $ 144,720 |
| Durham-Chapel Hill, NC | 490 | 1.58 | 2.71 | $ 46.53 | $ 96,790 |
| Des Moines-West Des Moines, IA | 550 | 1.53 | 2.61 | (8) | (8) |
| San Francisco-Oakland-Hayward, CA | 3,240 | 1.44 | 2.47 | $ 62.38 | $ 129,760 |
| San Jose-Sunnyvale-Santa Clara, CA | 1,470 | 1.38 | 2.36 | $ 66.21 | $ 137,720 |
| Columbus, OH | 1,400 | 1.37 | 2.34 | $ 35.95 | $ 74,780 |
| Provo-Orem, UT | 320 | 1.16 | 1.99 | $ 38.10 | $ 79,240 |
| Raleigh, NC | 640 | 1.00 | 1.72 | $ 36.94 | $ 76,840 |
| Bellingham, WA | 80 | 1.00 | 1.70 | $ 41.96 | $ 87,280 |
| Burlington-South Burlington, VT | 110 | 0.96 | 1.64 | $ 30.60 | $ 63,650 |
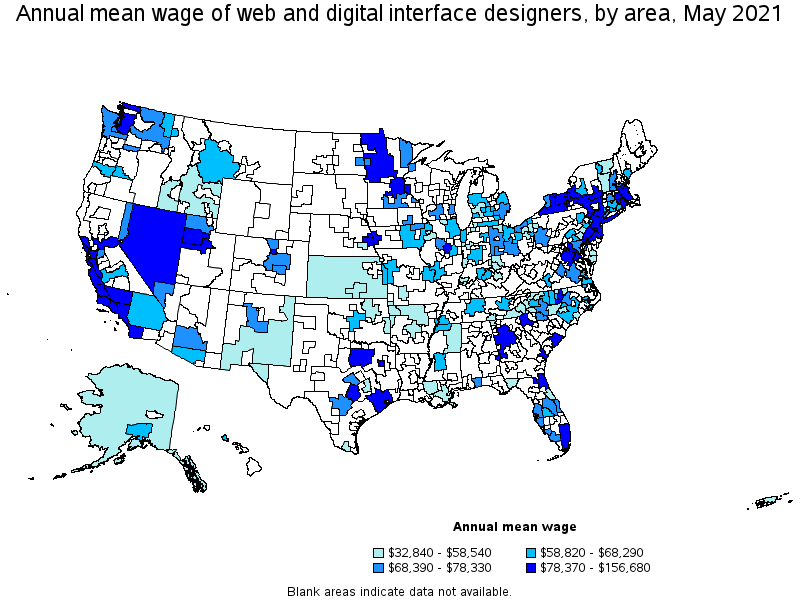
Top paying metropolitan areas for Web and Digital Interface Designers:
| Metropolitan area | Employment (1) | Employment per thousand jobs | Location quotient (9) | Hourly mean wage | Annual mean wage (2) |
|---|---|---|---|---|---|
| Seattle-Tacoma-Bellevue, WA | 13,910 | 7.25 | 12.40 | $ 69.58 | $ 144,720 |
| San Jose-Sunnyvale-Santa Clara, CA | 1,470 | 1.38 | 2.36 | $ 66.21 | $ 137,720 |
| San Francisco-Oakland-Hayward, CA | 3,240 | 1.44 | 2.47 | $ 62.38 | $ 129,760 |
| Rochester, NY | 270 | 0.57 | 0.97 | $ 58.33 | $ 121,330 |
| New York-Newark-Jersey City, NY-NJ-PA | 7,680 | 0.89 | 1.51 | $ 57.82 | $ 120,270 |
| Syracuse, NY | 150 | 0.55 | 0.95 | $ 54.65 | $ 113,680 |
| Santa Maria-Santa Barbara, CA | 100 | 0.50 | 0.85 | $ 47.34 | $ 98,460 |
| Durham-Chapel Hill, NC | 490 | 1.58 | 2.71 | $ 46.53 | $ 96,790 |
| Austin-Round Rock, TX | 950 | 0.88 | 1.51 | $ 46.30 | $ 96,300 |
| San Diego-Carlsbad, CA | 880 | 0.63 | 1.08 | $ 45.12 | $ 93,840 |
Nonmetropolitan areas with the highest employment in Web and Digital Interface Designers:
| Nonmetropolitan area | Employment (1) | Employment per thousand jobs | Location quotient (9) | Hourly mean wage | Annual mean wage (2) |
|---|---|---|---|---|---|
| Piedmont North Carolina nonmetropolitan area | 110 | 0.44 | 0.75 | $ 23.52 | $ 48,930 |
| West Northwestern Ohio nonmetropolitan area | 60 | 0.26 | 0.45 | $ 35.85 | $ 74,560 |
| Southeast Minnesota nonmetropolitan area | 60 | 0.42 | 0.72 | $ 33.13 | $ 68,910 |
| Southeast Iowa nonmetropolitan area | 60 | 0.28 | 0.48 | $ 30.55 | $ 63,550 |
| North Northeastern Ohio nonmetropolitan area (noncontiguous) | 50 | 0.17 | 0.29 | $ 32.42 | $ 67,440 |
Nonmetropolitan areas with the highest concentration of jobs and location quotients in Web and Digital Interface Designers:
| Nonmetropolitan area | Employment (1) | Employment per thousand jobs | Location quotient (9) | Hourly mean wage | Annual mean wage (2) |
|---|---|---|---|---|---|
| Northern Vermont nonmetropolitan area | 40 | 0.63 | 1.09 | $ 28.11 | $ 58,470 |
| Southern Vermont nonmetropolitan area | 40 | 0.46 | 0.79 | $ 25.43 | $ 52,900 |
| Piedmont North Carolina nonmetropolitan area | 110 | 0.44 | 0.75 | $ 23.52 | $ 48,930 |
| Southeast Minnesota nonmetropolitan area | 60 | 0.42 | 0.72 | $ 33.13 | $ 68,910 |
| Nevada nonmetropolitan area | 40 | 0.41 | 0.71 | $ 75.33 | $ 156,680 |
Top paying nonmetropolitan areas for Web and Digital Interface Designers:
| Nonmetropolitan area | Employment (1) | Employment per thousand jobs | Location quotient (9) | Hourly mean wage | Annual mean wage (2) |
|---|---|---|---|---|---|
| Nevada nonmetropolitan area | 40 | 0.41 | 0.71 | $ 75.33 | $ 156,680 |
| Southwest New York nonmetropolitan area | 40 | 0.21 | 0.36 | $ 69.81 | $ 145,200 |
| Central East New York nonmetropolitan area | (8) | (8) | (8) | $ 51.65 | $ 107,430 |
| Northwest Minnesota nonmetropolitan area | 30 | 0.18 | 0.31 | $ 38.05 | $ 79,140 |
| Western Washington nonmetropolitan area | 40 | 0.30 | 0.52 | $ 36.91 | $ 76,770 |
These estimates are calculated with data collected from employers in all industry sectors, all metropolitan and nonmetropolitan areas, and all states and the District of Columbia. The top employment and wage figures are provided above. The complete list is available in the downloadable XLS files.
The percentile wage estimate is the value of a wage below which a certain percent of workers fall. The median wage is the 50th percentile wage estimate—50 percent of workers earn less than the median and 50 percent of workers earn more than the median. More about percentile wages.
(1) Estimates for detailed occupations do not sum to the totals because the totals include occupations not shown separately. Estimates do not include self-employed workers.
(2) Annual wages have been calculated by multiplying the hourly mean wage by a "year-round, full-time" hours figure of 2,080 hours; for those occupations where there is not an hourly wage published, the annual wage has been directly calculated from the reported survey data.
(3) The relative standard error (RSE) is a measure of the reliability of a survey statistic. The smaller the relative standard error, the more precise the estimate.
(8) Estimate not released.
(9) The location quotient is the ratio of the area concentration of occupational employment to the national average concentration. A location quotient greater than one indicates the occupation has a higher share of employment than average, and a location quotient less than one indicates the occupation is less prevalent in the area than average.
Other OEWS estimates and related information:
May 2021 National Occupational Employment and Wage Estimates
May 2021 State Occupational Employment and Wage Estimates
May 2021 Metropolitan and Nonmetropolitan Area Occupational Employment and Wage Estimates
May 2021 National Industry-Specific Occupational Employment and Wage Estimates
Last Modified Date: March 31, 2022