
An official website of the United States government
An official website of the United States government
The .gov means it's official.
Federal government websites often end in .gov or .mil. Before sharing sensitive information,
make sure you're on a federal government site.
The site is secure.
The
https:// ensures that you are connecting to the official website and that any
information you provide is encrypted and transmitted securely.
Develop and implement a set of techniques or analytics applications to transform raw data into meaningful information using data-oriented programming languages and visualization software. Apply data mining, data modeling, natural language processing, and machine learning to extract and analyze information from large structured and unstructured datasets. Visualize, interpret, and report data findings. May create dynamic data reports. Excludes �Statisticians� (15-2041), �Cartographers and Photogrammetrists� (17-1021), and �Health Information Technologists and Medical Registrars� (29-9021).
Employment estimate and mean wage estimates for Data Scientists:
| Employment (1) | Employment RSE (3) |
Mean hourly wage |
Mean annual wage (2) |
Wage RSE (3) |
|---|---|---|---|---|
| 105,980 | 2.4 % | $ 52.24 | $ 108,660 | 1.1 % |
Percentile wage estimates for Data Scientists:
| Percentile | 10% | 25% | 50% (Median) |
75% | 90% |
|---|---|---|---|---|---|
| Hourly Wage | $ 28.57 | $ 37.32 | $ 48.52 | $ 62.87 | $ 80.31 |
| Annual Wage (2) | $ 59,430 | $ 77,620 | $ 100,910 | $ 130,770 | $ 167,040 |
Industries with the highest published employment and wages for Data Scientists are provided. For a list of all industries with employment in Data Scientists, see the Create Customized Tables function.
Industries with the highest levels of employment in Data Scientists:
| Industry | Employment (1) | Percent of industry employment | Hourly mean wage | Annual mean wage (2) |
|---|---|---|---|---|
| Computer Systems Design and Related Services | 16,620 | 0.73 | $ 55.91 | $ 116,300 |
| Management of Companies and Enterprises | 12,570 | 0.50 | $ 51.95 | $ 108,060 |
| Management, Scientific, and Technical Consulting Services | 7,270 | 0.47 | $ 51.99 | $ 108,150 |
| Scientific Research and Development Services | 5,840 | 0.73 | $ 54.53 | $ 113,430 |
| Credit Intermediation and Related Activities (5221 and 5223 only) | 5,690 | 0.28 | $ 56.34 | $ 117,190 |
Industries with the highest concentration of employment in Data Scientists:
| Industry | Employment (1) | Percent of industry employment | Hourly mean wage | Annual mean wage (2) |
|---|---|---|---|---|
| Other Information Services | 3,720 | 1.03 | $ 67.12 | $ 139,600 |
| Scientific Research and Development Services | 5,840 | 0.73 | $ 54.53 | $ 113,430 |
| Computer Systems Design and Related Services | 16,620 | 0.73 | $ 55.91 | $ 116,300 |
| Software Publishers | 3,710 | 0.70 | $ 52.92 | $ 110,070 |
| Data Processing, Hosting, and Related Services | 2,570 | 0.68 | $ 60.65 | $ 126,160 |
Top paying industries for Data Scientists:
| Industry | Employment (1) | Percent of industry employment | Hourly mean wage | Annual mean wage (2) |
|---|---|---|---|---|
| Computer and Peripheral Equipment Manufacturing | 400 | 0.26 | $ 71.29 | $ 148,290 |
| Semiconductor and Other Electronic Component Manufacturing | 620 | 0.17 | $ 68.34 | $ 142,150 |
| Other Information Services | 3,720 | 1.03 | $ 67.12 | $ 139,600 |
| Data Processing, Hosting, and Related Services | 2,570 | 0.68 | $ 60.65 | $ 126,160 |
| Accounting, Tax Preparation, Bookkeeping, and Payroll Services | 1,110 | 0.11 | $ 59.83 | $ 124,440 |
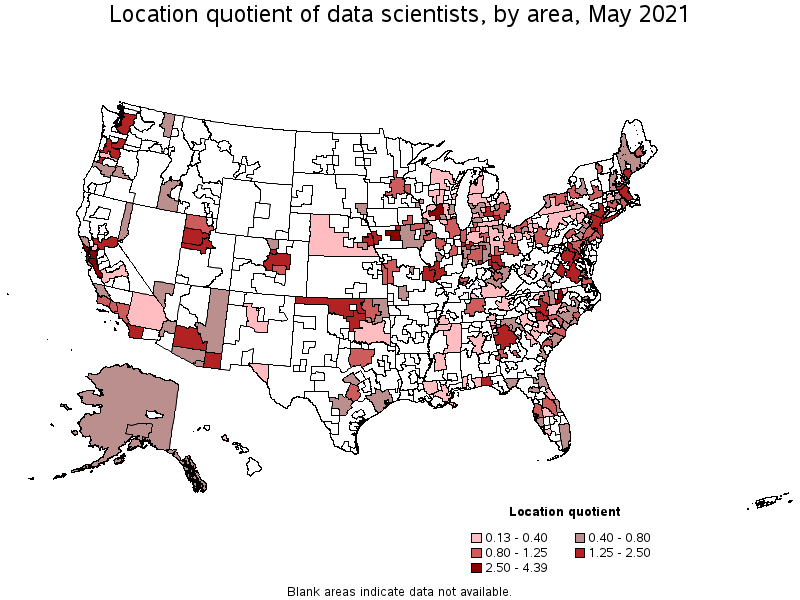
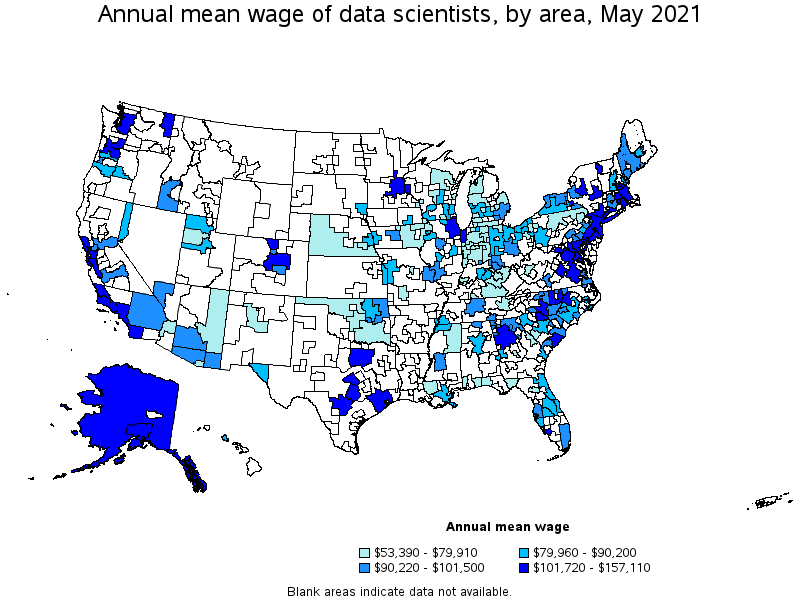
States and areas with the highest published employment, location quotients, and wages for Data Scientists are provided. For a list of all areas with employment in Data Scientists, see the Create Customized Tables function.
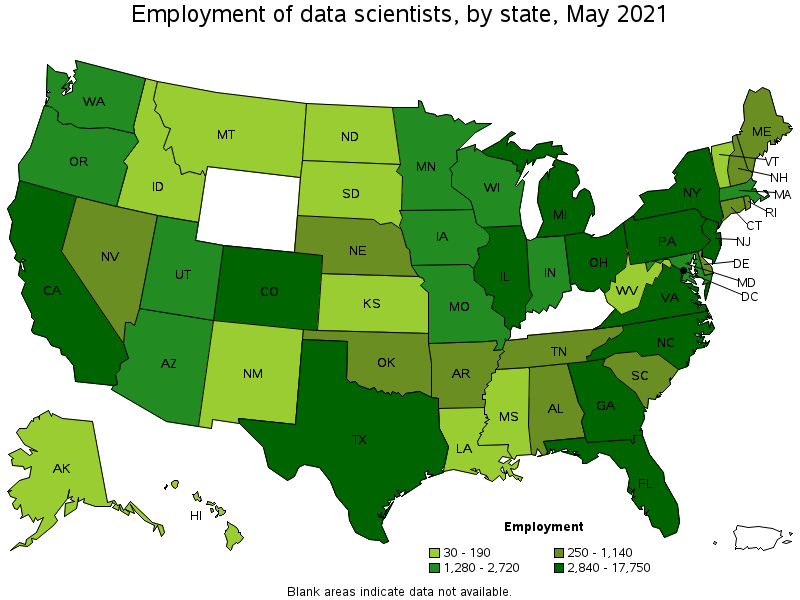
States with the highest employment level in Data Scientists:
| State | Employment (1) | Employment per thousand jobs | Location quotient (9) | Hourly mean wage | Annual mean wage (2) |
|---|---|---|---|---|---|
| California | 17,750 | 1.07 | 1.43 | $ 64.00 | $ 133,110 |
| New York | 10,050 | 1.16 | 1.54 | $ 58.91 | $ 122,540 |
| Texas | 5,850 | 0.48 | 0.64 | $ 54.98 | $ 114,360 |
| North Carolina | 5,050 | 1.14 | 1.52 | $ 54.80 | $ 113,980 |
| Illinois | 4,670 | 0.83 | 1.10 | $ 50.00 | $ 104,010 |
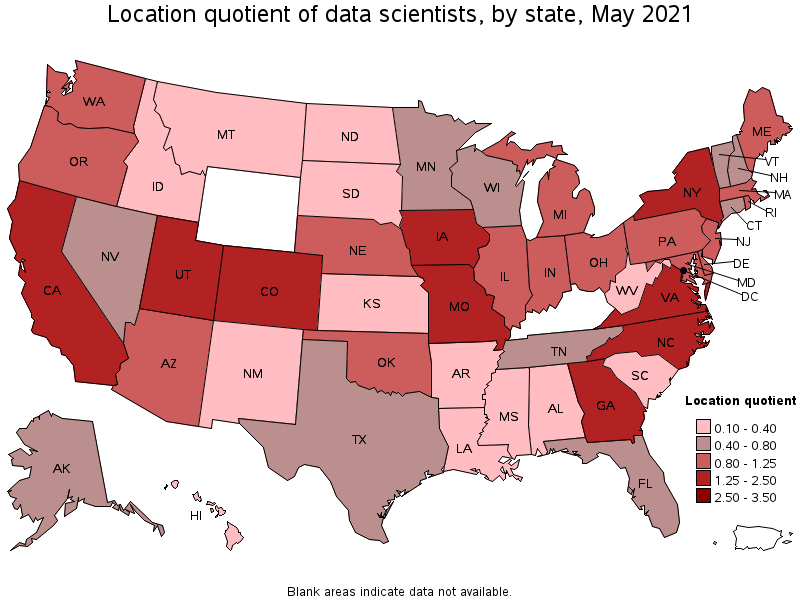
States with the highest concentration of jobs and location quotients in Data Scientists:
| State | Employment (1) | Employment per thousand jobs | Location quotient (9) | Hourly mean wage | Annual mean wage (2) |
|---|---|---|---|---|---|
| District of Columbia | 1,380 | 2.09 | 2.77 | $ 56.48 | $ 117,470 |
| Colorado | 3,070 | 1.17 | 1.56 | $ 50.86 | $ 105,790 |
| New York | 10,050 | 1.16 | 1.54 | $ 58.91 | $ 122,540 |
| Utah | 1,790 | 1.15 | 1.53 | $ 38.38 | $ 79,830 |
| North Carolina | 5,050 | 1.14 | 1.52 | $ 54.80 | $ 113,980 |
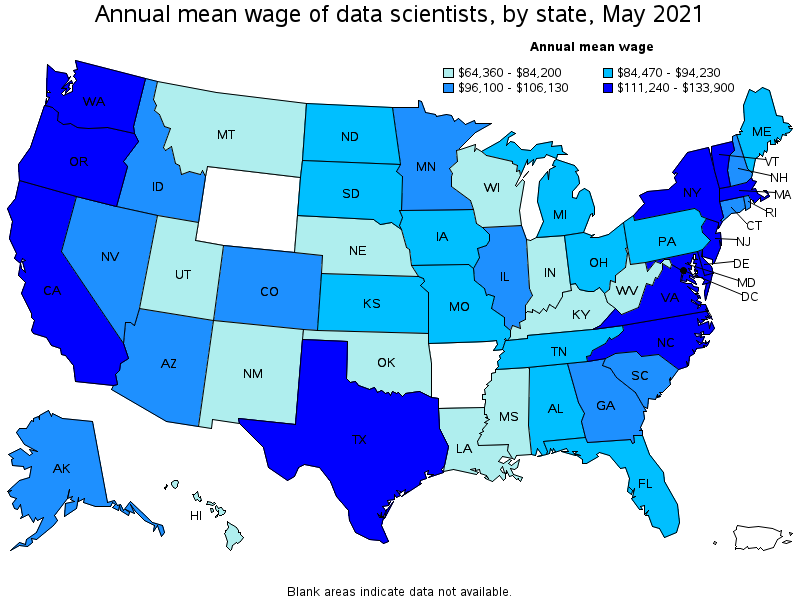
Top paying states for Data Scientists:
| State | Employment (1) | Employment per thousand jobs | Location quotient (9) | Hourly mean wage | Annual mean wage (2) |
|---|---|---|---|---|---|
| Washington | 2,460 | 0.77 | 1.02 | $ 64.38 | $ 133,900 |
| California | 17,750 | 1.07 | 1.43 | $ 64.00 | $ 133,110 |
| Delaware | 370 | 0.85 | 1.13 | $ 61.45 | $ 127,810 |
| New York | 10,050 | 1.16 | 1.54 | $ 58.91 | $ 122,540 |
| New Jersey | 2,840 | 0.74 | 0.98 | $ 57.81 | $ 120,240 |
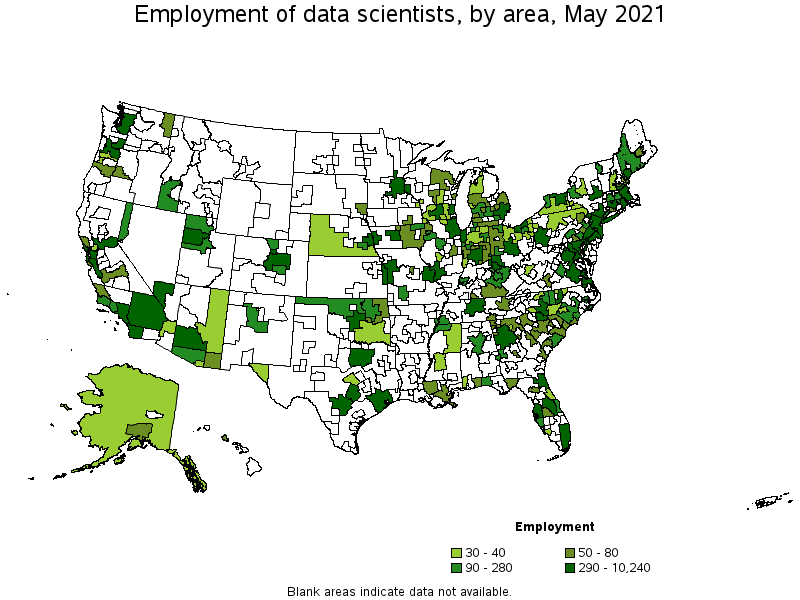
Metropolitan areas with the highest employment level in Data Scientists:
| Metropolitan area | Employment (1) | Employment per thousand jobs | Location quotient (9) | Hourly mean wage | Annual mean wage (2) |
|---|---|---|---|---|---|
| New York-Newark-Jersey City, NY-NJ-PA | 10,240 | 1.18 | 1.57 | $ 61.66 | $ 128,250 |
| San Francisco-Oakland-Hayward, CA | 5,290 | 2.36 | 3.13 | $ 73.65 | $ 153,180 |
| Washington-Arlington-Alexandria, DC-VA-MD-WV | 4,160 | 1.42 | 1.89 | $ 59.01 | $ 122,740 |
| Los Angeles-Long Beach-Anaheim, CA | 3,830 | 0.67 | 0.89 | $ 57.33 | $ 119,240 |
| Chicago-Naperville-Elgin, IL-IN-WI | 3,580 | 0.85 | 1.12 | $ 49.89 | $ 103,780 |
| San Jose-Sunnyvale-Santa Clara, CA | 3,530 | 3.30 | 4.39 | $ 75.53 | $ 157,110 |
| Atlanta-Sandy Springs-Roswell, GA | 3,410 | 1.32 | 1.75 | $ 51.90 | $ 107,950 |
| Dallas-Fort Worth-Arlington, TX | 2,700 | 0.75 | 1.00 | $ 55.47 | $ 115,380 |
| Boston-Cambridge-Nashua, MA-NH | 2,470 | 0.96 | 1.27 | $ 54.05 | $ 112,420 |
| Denver-Aurora-Lakewood, CO | 2,350 | 1.60 | 2.13 | $ 51.71 | $ 107,550 |
Metropolitan areas with the highest concentration of jobs and location quotients in Data Scientists:
| Metropolitan area | Employment (1) | Employment per thousand jobs | Location quotient (9) | Hourly mean wage | Annual mean wage (2) |
|---|---|---|---|---|---|
| San Jose-Sunnyvale-Santa Clara, CA | 3,530 | 3.30 | 4.39 | $ 75.53 | $ 157,110 |
| Des Moines-West Des Moines, IA | 1,040 | 2.91 | 3.87 | $ 47.37 | $ 98,530 |
| Durham-Chapel Hill, NC | 820 | 2.62 | 3.48 | $ 55.33 | $ 115,080 |
| San Francisco-Oakland-Hayward, CA | 5,290 | 2.36 | 3.13 | $ 73.65 | $ 153,180 |
| Madison, WI | 710 | 1.88 | 2.50 | (8) | (8) |
| Sacramento--Roseville--Arden-Arcade, CA | 1,660 | 1.69 | 2.24 | $ 44.94 | $ 93,470 |
| Charlotte-Concord-Gastonia, NC-SC | 2,010 | 1.66 | 2.21 | $ 58.24 | $ 121,130 |
| Sierra Vista-Douglas, AZ | 60 | 1.65 | 2.20 | $ 43.73 | $ 90,960 |
| Lafayette-West Lafayette, IN | 150 | 1.64 | 2.18 | $ 35.14 | $ 73,090 |
| Salt Lake City, UT | 1,200 | 1.61 | 2.15 | $ 37.83 | $ 78,680 |
Top paying metropolitan areas for Data Scientists:
| Metropolitan area | Employment (1) | Employment per thousand jobs | Location quotient (9) | Hourly mean wage | Annual mean wage (2) |
|---|---|---|---|---|---|
| San Jose-Sunnyvale-Santa Clara, CA | 3,530 | 3.30 | 4.39 | $ 75.53 | $ 157,110 |
| San Francisco-Oakland-Hayward, CA | 5,290 | 2.36 | 3.13 | $ 73.65 | $ 153,180 |
| Seattle-Tacoma-Bellevue, WA | 2,120 | 1.11 | 1.47 | $ 65.34 | $ 135,900 |
| New York-Newark-Jersey City, NY-NJ-PA | 10,240 | 1.18 | 1.57 | $ 61.66 | $ 128,250 |
| Santa Cruz-Watsonville, CA | 50 | 0.53 | 0.70 | $ 59.42 | $ 123,600 |
| Austin-Round Rock, TX | 940 | 0.88 | 1.17 | $ 59.39 | $ 123,530 |
| Washington-Arlington-Alexandria, DC-VA-MD-WV | 4,160 | 1.42 | 1.89 | $ 59.01 | $ 122,740 |
| Santa Maria-Santa Barbara, CA | 140 | 0.74 | 0.99 | $ 58.96 | $ 122,640 |
| Charlotte-Concord-Gastonia, NC-SC | 2,010 | 1.66 | 2.21 | $ 58.24 | $ 121,130 |
| Los Angeles-Long Beach-Anaheim, CA | 3,830 | 0.67 | 0.89 | $ 57.33 | $ 119,240 |
Nonmetropolitan areas with the highest employment in Data Scientists:
| Nonmetropolitan area | Employment (1) | Employment per thousand jobs | Location quotient (9) | Hourly mean wage | Annual mean wage (2) |
|---|---|---|---|---|---|
| Southeast Coastal North Carolina nonmetropolitan area | 110 | 0.48 | 0.64 | $ 42.85 | $ 89,130 |
| Southwest Maine nonmetropolitan area | 100 | 0.55 | 0.73 | $ 45.32 | $ 94,270 |
| Central Kentucky nonmetropolitan area | 90 | 0.52 | 0.69 | $ 37.28 | $ 77,540 |
| Northwest Oklahoma nonmetropolitan area | 90 | 0.98 | 1.30 | $ 30.60 | $ 63,650 |
| North Georgia nonmetropolitan area | 80 | 0.47 | 0.63 | $ 46.76 | $ 97,250 |
Nonmetropolitan areas with the highest concentration of jobs and location quotients in Data Scientists:
| Nonmetropolitan area | Employment (1) | Employment per thousand jobs | Location quotient (9) | Hourly mean wage | Annual mean wage (2) |
|---|---|---|---|---|---|
| Northwest Oklahoma nonmetropolitan area | 90 | 0.98 | 1.30 | $ 30.60 | $ 63,650 |
| Northeast South Carolina nonmetropolitan area | 60 | 0.63 | 0.83 | $ 45.65 | $ 94,950 |
| Southwest Maine nonmetropolitan area | 100 | 0.55 | 0.73 | $ 45.32 | $ 94,270 |
| Central Kentucky nonmetropolitan area | 90 | 0.52 | 0.69 | $ 37.28 | $ 77,540 |
| Southeast Coastal North Carolina nonmetropolitan area | 110 | 0.48 | 0.64 | $ 42.85 | $ 89,130 |
Top paying nonmetropolitan areas for Data Scientists:
| Nonmetropolitan area | Employment (1) | Employment per thousand jobs | Location quotient (9) | Hourly mean wage | Annual mean wage (2) |
|---|---|---|---|---|---|
| Alaska nonmetropolitan area | 30 | 0.33 | 0.44 | $ 54.76 | $ 113,890 |
| Northeast Oklahoma nonmetropolitan area | 50 | 0.43 | 0.57 | $ 48.39 | $ 100,650 |
| Piedmont North Carolina nonmetropolitan area | 40 | 0.14 | 0.19 | $ 47.99 | $ 99,810 |
| North Georgia nonmetropolitan area | 80 | 0.47 | 0.63 | $ 46.76 | $ 97,250 |
| Northeast South Carolina nonmetropolitan area | 60 | 0.63 | 0.83 | $ 45.65 | $ 94,950 |
These estimates are calculated with data collected from employers in all industry sectors, all metropolitan and nonmetropolitan areas, and all states and the District of Columbia. The top employment and wage figures are provided above. The complete list is available in the downloadable XLS files.
The percentile wage estimate is the value of a wage below which a certain percent of workers fall. The median wage is the 50th percentile wage estimate—50 percent of workers earn less than the median and 50 percent of workers earn more than the median. More about percentile wages.
(1) Estimates for detailed occupations do not sum to the totals because the totals include occupations not shown separately. Estimates do not include self-employed workers.
(2) Annual wages have been calculated by multiplying the hourly mean wage by a "year-round, full-time" hours figure of 2,080 hours; for those occupations where there is not an hourly wage published, the annual wage has been directly calculated from the reported survey data.
(3) The relative standard error (RSE) is a measure of the reliability of a survey statistic. The smaller the relative standard error, the more precise the estimate.
(8) Estimate not released.
(9) The location quotient is the ratio of the area concentration of occupational employment to the national average concentration. A location quotient greater than one indicates the occupation has a higher share of employment than average, and a location quotient less than one indicates the occupation is less prevalent in the area than average.
Other OEWS estimates and related information:
May 2021 National Occupational Employment and Wage Estimates
May 2021 State Occupational Employment and Wage Estimates
May 2021 Metropolitan and Nonmetropolitan Area Occupational Employment and Wage Estimates
May 2021 National Industry-Specific Occupational Employment and Wage Estimates
Last Modified Date: March 31, 2022