
An official website of the United States government
An official website of the United States government
The .gov means it's official.
Federal government websites often end in .gov or .mil. Before sharing sensitive information,
make sure you're on a federal government site.
The site is secure.
The
https:// ensures that you are connecting to the official website and that any
information you provide is encrypted and transmitted securely.
Design chemical plant equipment and devise processes for manufacturing chemicals and products, such as gasoline, synthetic rubber, plastics, detergents, cement, paper, and pulp, by applying principles and technology of chemistry, physics, and engineering.
Employment estimate and mean wage estimates for Chemical Engineers:
| Employment (1) | Employment RSE (3) |
Mean hourly wage |
Mean annual wage (2) |
Wage RSE (3) |
|---|---|---|---|---|
| 24,180 | 3.3 % | $ 58.58 | $ 121,840 | 3.6 % |
Percentile wage estimates for Chemical Engineers:
| Percentile | 10% | 25% | 50% (Median) |
75% | 90% |
|---|---|---|---|---|---|
| Hourly Wage | $ 30.16 | $ 38.53 | $ 50.75 | $ 66.98 | $ 90.11 |
| Annual Wage (2) | $ 62,730 | $ 80,140 | $ 105,550 | $ 139,310 | $ 187,430 |
Industries with the highest published employment and wages for Chemical Engineers are provided. For a list of all industries with employment in Chemical Engineers, see the Create Customized Tables function.
Industries with the highest levels of employment in Chemical Engineers:
| Industry | Employment (1) | Percent of industry employment | Hourly mean wage | Annual mean wage (2) |
|---|---|---|---|---|
| Chemical Manufacturing (3251, 3252, 3253, and 3259 only) | 7,000 | 1.99 | $ 60.45 | $ 125,740 |
| Architectural, Engineering, and Related Services | 3,320 | 0.22 | $ 78.53 | $ 163,350 |
| Scientific Research and Development Services | 2,940 | 0.37 | $ 55.17 | $ 114,750 |
| Pharmaceutical and Medicine Manufacturing | 1,330 | 0.42 | $ 47.03 | $ 97,820 |
| Management of Companies and Enterprises | 1,090 | 0.04 | $ 63.30 | $ 131,670 |
Industries with the highest concentration of employment in Chemical Engineers:
| Industry | Employment (1) | Percent of industry employment | Hourly mean wage | Annual mean wage (2) |
|---|---|---|---|---|
| Chemical Manufacturing (3251, 3252, 3253, and 3259 only) | 7,000 | 1.99 | $ 60.45 | $ 125,740 |
| Petroleum and Coal Products Manufacturing | 850 | 0.82 | $ 63.58 | $ 132,240 |
| Commercial and Service Industry Machinery Manufacturing | 370 | 0.43 | $ 35.69 | $ 74,240 |
| Pharmaceutical and Medicine Manufacturing | 1,330 | 0.42 | $ 47.03 | $ 97,820 |
| Scientific Research and Development Services | 2,940 | 0.37 | $ 55.17 | $ 114,750 |
Top paying industries for Chemical Engineers:
| Industry | Employment (1) | Percent of industry employment | Hourly mean wage | Annual mean wage (2) |
|---|---|---|---|---|
| Oil and Gas Extraction | 330 | 0.31 | $ 80.35 | $ 167,120 |
| Architectural, Engineering, and Related Services | 3,320 | 0.22 | $ 78.53 | $ 163,350 |
| Pipeline Transportation of Crude Oil | (8) | (8) | $ 77.30 | $ 160,790 |
| Computer and Peripheral Equipment Manufacturing | 90 | 0.06 | $ 65.23 | $ 135,670 |
| Petroleum and Coal Products Manufacturing | 850 | 0.82 | $ 63.58 | $ 132,240 |
States and areas with the highest published employment, location quotients, and wages for Chemical Engineers are provided. For a list of all areas with employment in Chemical Engineers, see the Create Customized Tables function.
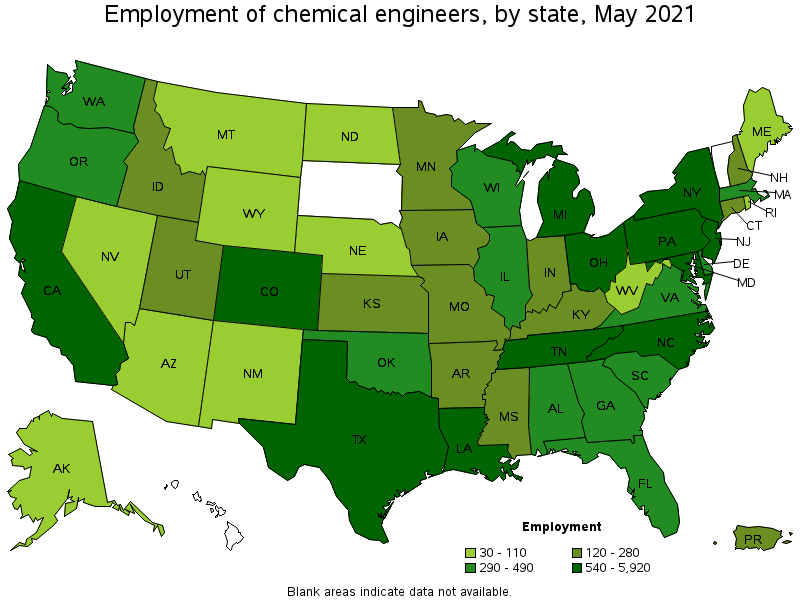
States with the highest employment level in Chemical Engineers:
| State | Employment (1) | Employment per thousand jobs | Location quotient (9) | Hourly mean wage | Annual mean wage (2) |
|---|---|---|---|---|---|
| Texas | 5,920 | 0.48 | 2.82 | $ 79.07 | $ 164,470 |
| Pennsylvania | 1,650 | 0.30 | 1.72 | $ 49.26 | $ 102,450 |
| California | 1,540 | 0.09 | 0.54 | $ 46.60 | $ 96,920 |
| Michigan | 1,170 | 0.29 | 1.69 | $ 52.72 | $ 109,650 |
| New Jersey | 1,040 | 0.27 | 1.58 | $ 59.28 | $ 123,300 |
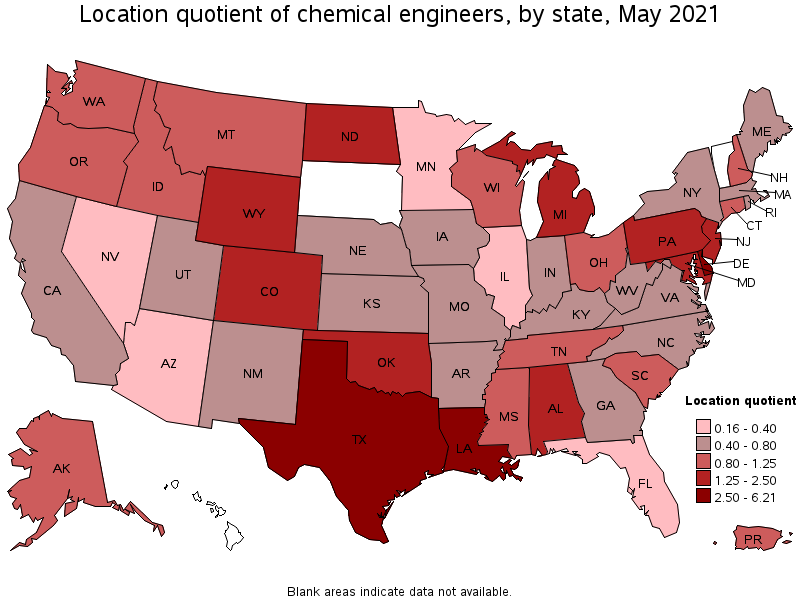
States with the highest concentration of jobs and location quotients in Chemical Engineers:
| State | Employment (1) | Employment per thousand jobs | Location quotient (9) | Hourly mean wage | Annual mean wage (2) |
|---|---|---|---|---|---|
| Delaware | 460 | 1.06 | 6.21 | $ 60.31 | $ 125,450 |
| Louisiana | 990 | 0.55 | 3.23 | $ 62.57 | $ 130,140 |
| Texas | 5,920 | 0.48 | 2.82 | $ 79.07 | $ 164,470 |
| Pennsylvania | 1,650 | 0.30 | 1.72 | $ 49.26 | $ 102,450 |
| Michigan | 1,170 | 0.29 | 1.69 | $ 52.72 | $ 109,650 |
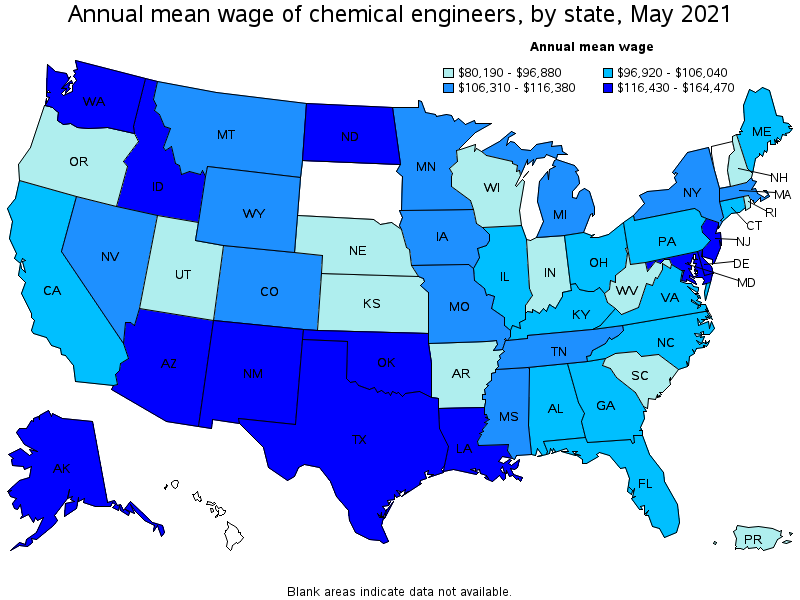
Top paying states for Chemical Engineers:
| State | Employment (1) | Employment per thousand jobs | Location quotient (9) | Hourly mean wage | Annual mean wage (2) |
|---|---|---|---|---|---|
| Texas | 5,920 | 0.48 | 2.82 | $ 79.07 | $ 164,470 |
| Alaska | 50 | 0.17 | 0.96 | $ 76.98 | $ 160,120 |
| Idaho | 150 | 0.20 | 1.15 | $ 63.87 | $ 132,850 |
| Arizona | 80 | 0.03 | 0.16 | $ 63.68 | $ 132,450 |
| Louisiana | 990 | 0.55 | 3.23 | $ 62.57 | $ 130,140 |
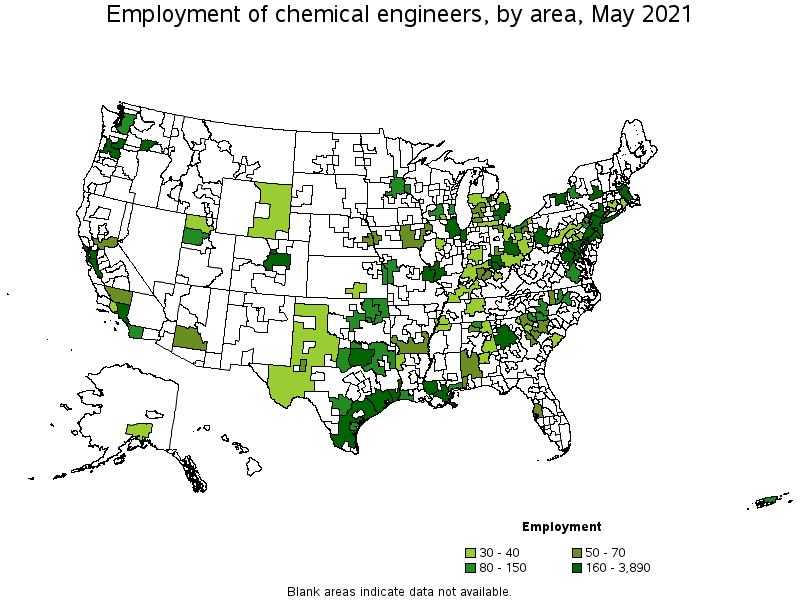
Metropolitan areas with the highest employment level in Chemical Engineers:
| Metropolitan area | Employment (1) | Employment per thousand jobs | Location quotient (9) | Hourly mean wage | Annual mean wage (2) |
|---|---|---|---|---|---|
| Houston-The Woodlands-Sugar Land, TX | 3,890 | 1.34 | 7.83 | $ 83.48 | $ 173,640 |
| Philadelphia-Camden-Wilmington, PA-NJ-DE-MD | 1,320 | 0.50 | 2.90 | $ 55.18 | $ 114,780 |
| New York-Newark-Jersey City, NY-NJ-PA | 960 | 0.11 | 0.64 | $ 60.37 | $ 125,560 |
| Dallas-Fort Worth-Arlington, TX | 610 | 0.17 | 1.00 | $ 72.82 | $ 151,460 |
| Baton Rouge, LA | 610 | 1.67 | 9.70 | $ 68.23 | $ 141,920 |
| Detroit-Warren-Dearborn, MI | 540 | 0.30 | 1.73 | $ 54.70 | $ 113,780 |
| Washington-Arlington-Alexandria, DC-VA-MD-WV | 430 | 0.15 | 0.86 | $ 54.49 | $ 113,340 |
| Denver-Aurora-Lakewood, CO | 380 | 0.26 | 1.50 | $ 47.98 | $ 99,790 |
| Pittsburgh, PA | 370 | 0.36 | 2.08 | $ 52.26 | $ 108,700 |
| Los Angeles-Long Beach-Anaheim, CA | 350 | 0.06 | 0.35 | $ 53.79 | $ 111,880 |
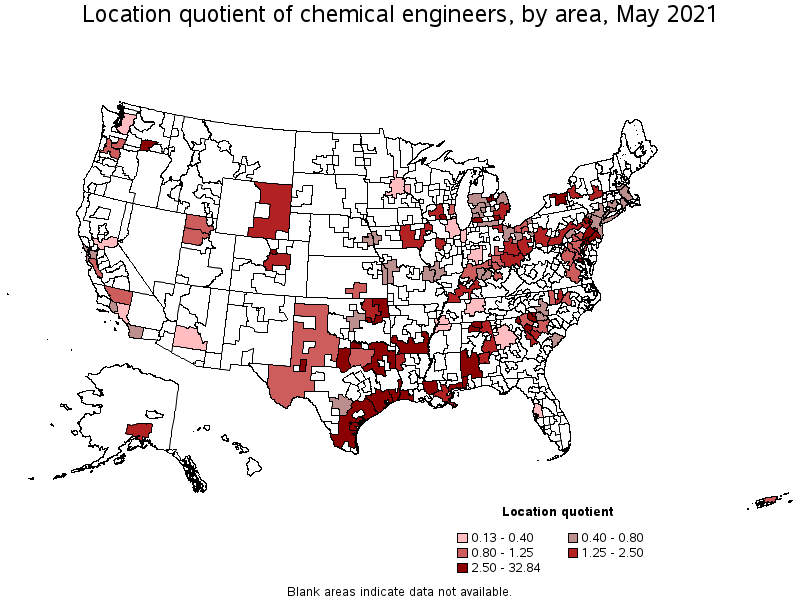
Metropolitan areas with the highest concentration of jobs and location quotients in Chemical Engineers:
| Metropolitan area | Employment (1) | Employment per thousand jobs | Location quotient (9) | Hourly mean wage | Annual mean wage (2) |
|---|---|---|---|---|---|
| Midland, MI | 200 | 5.64 | 32.84 | $ 53.69 | $ 111,680 |
| Beaumont-Port Arthur, TX | 310 | 2.08 | 12.10 | $ 67.40 | $ 140,190 |
| Lake Charles, LA | 150 | 1.70 | 9.92 | $ 52.67 | $ 109,560 |
| Baton Rouge, LA | 610 | 1.67 | 9.70 | $ 68.23 | $ 141,920 |
| Kennewick-Richland, WA | 180 | 1.53 | 8.91 | $ 62.23 | $ 129,430 |
| Houston-The Woodlands-Sugar Land, TX | 3,890 | 1.34 | 7.83 | $ 83.48 | $ 173,640 |
| Boulder, CO | 190 | 1.06 | 6.19 | $ 62.36 | $ 129,700 |
| Bay City, MI | 30 | 0.99 | 5.79 | $ 50.72 | $ 105,490 |
| East Stroudsburg, PA | 50 | 0.91 | 5.28 | $ 44.00 | $ 91,510 |
| Decatur, AL | 50 | 0.86 | 5.02 | $ 57.74 | $ 120,090 |
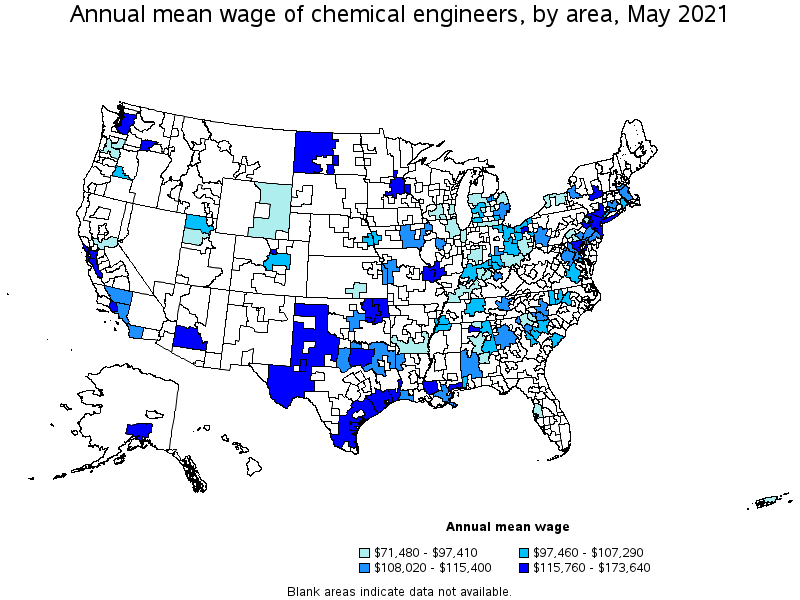
Top paying metropolitan areas for Chemical Engineers:
| Metropolitan area | Employment (1) | Employment per thousand jobs | Location quotient (9) | Hourly mean wage | Annual mean wage (2) |
|---|---|---|---|---|---|
| Houston-The Woodlands-Sugar Land, TX | 3,890 | 1.34 | 7.83 | $ 83.48 | $ 173,640 |
| Anchorage, AK | 40 | 0.24 | 1.40 | $ 76.45 | $ 159,010 |
| Phoenix-Mesa-Scottsdale, AZ | 50 | 0.02 | 0.13 | $ 73.47 | $ 152,820 |
| Dallas-Fort Worth-Arlington, TX | 610 | 0.17 | 1.00 | $ 72.82 | $ 151,460 |
| Midland, TX | 50 | 0.48 | 2.80 | $ 70.65 | $ 146,940 |
| Baton Rouge, LA | 610 | 1.67 | 9.70 | $ 68.23 | $ 141,920 |
| Beaumont-Port Arthur, TX | 310 | 2.08 | 12.10 | $ 67.40 | $ 140,190 |
| Trenton, NJ | 70 | 0.29 | 1.71 | $ 67.08 | $ 139,520 |
| Corpus Christi, TX | 100 | 0.58 | 3.39 | $ 66.41 | $ 138,130 |
| San Jose-Sunnyvale-Santa Clara, CA | 230 | 0.21 | 1.24 | $ 63.39 | $ 131,840 |
Nonmetropolitan areas with the highest employment in Chemical Engineers:
| Nonmetropolitan area | Employment (1) | Employment per thousand jobs | Location quotient (9) | Hourly mean wage | Annual mean wage (2) |
|---|---|---|---|---|---|
| Coastal Plains Region of Texas nonmetropolitan area | 180 | 1.25 | 7.28 | $ 61.62 | $ 128,170 |
| North Texas Region of Texas nonmetropolitan area | 150 | 0.57 | 3.32 | $ 54.01 | $ 112,340 |
| Northeast Oklahoma nonmetropolitan area | 80 | 0.70 | 4.09 | $ 67.49 | $ 140,380 |
| Southwest Alabama nonmetropolitan area | 70 | 1.13 | 6.61 | $ 52.60 | $ 109,400 |
| South Arkansas nonmetropolitan area | 50 | 0.58 | 3.35 | $ 40.49 | $ 84,230 |
Nonmetropolitan areas with the highest concentration of jobs and location quotients in Chemical Engineers:
| Nonmetropolitan area | Employment (1) | Employment per thousand jobs | Location quotient (9) | Hourly mean wage | Annual mean wage (2) |
|---|---|---|---|---|---|
| Coastal Plains Region of Texas nonmetropolitan area | 180 | 1.25 | 7.28 | $ 61.62 | $ 128,170 |
| Southwest Alabama nonmetropolitan area | 70 | 1.13 | 6.61 | $ 52.60 | $ 109,400 |
| Northeast Oklahoma nonmetropolitan area | 80 | 0.70 | 4.09 | $ 67.49 | $ 140,380 |
| South Arkansas nonmetropolitan area | 50 | 0.58 | 3.35 | $ 40.49 | $ 84,230 |
| North Texas Region of Texas nonmetropolitan area | 150 | 0.57 | 3.32 | $ 54.01 | $ 112,340 |
Top paying nonmetropolitan areas for Chemical Engineers:
| Nonmetropolitan area | Employment (1) | Employment per thousand jobs | Location quotient (9) | Hourly mean wage | Annual mean wage (2) |
|---|---|---|---|---|---|
| Northeast Oklahoma nonmetropolitan area | 80 | 0.70 | 4.09 | $ 67.49 | $ 140,380 |
| West Texas Region of Texas nonmetropolitan area | 30 | 0.16 | 0.96 | $ 63.27 | $ 131,610 |
| West North Dakota nonmetropolitan area | (8) | (8) | (8) | $ 61.81 | $ 128,560 |
| Coastal Plains Region of Texas nonmetropolitan area | 180 | 1.25 | 7.28 | $ 61.62 | $ 128,170 |
| Southeast Iowa nonmetropolitan area | 50 | 0.25 | 1.43 | $ 54.25 | $ 112,840 |
These estimates are calculated with data collected from employers in all industry sectors, all metropolitan and nonmetropolitan areas, and all states and the District of Columbia. The top employment and wage figures are provided above. The complete list is available in the downloadable XLS files.
The percentile wage estimate is the value of a wage below which a certain percent of workers fall. The median wage is the 50th percentile wage estimate—50 percent of workers earn less than the median and 50 percent of workers earn more than the median. More about percentile wages.
(1) Estimates for detailed occupations do not sum to the totals because the totals include occupations not shown separately. Estimates do not include self-employed workers.
(2) Annual wages have been calculated by multiplying the hourly mean wage by a "year-round, full-time" hours figure of 2,080 hours; for those occupations where there is not an hourly wage published, the annual wage has been directly calculated from the reported survey data.
(3) The relative standard error (RSE) is a measure of the reliability of a survey statistic. The smaller the relative standard error, the more precise the estimate.
(8) Estimate not released.
(9) The location quotient is the ratio of the area concentration of occupational employment to the national average concentration. A location quotient greater than one indicates the occupation has a higher share of employment than average, and a location quotient less than one indicates the occupation is less prevalent in the area than average.
Other OEWS estimates and related information:
May 2021 National Occupational Employment and Wage Estimates
May 2021 State Occupational Employment and Wage Estimates
May 2021 Metropolitan and Nonmetropolitan Area Occupational Employment and Wage Estimates
May 2021 National Industry-Specific Occupational Employment and Wage Estimates
Last Modified Date: March 31, 2022