
An official website of the United States government
An official website of the United States government
The .gov means it's official.
Federal government websites often end in .gov or .mil. Before sharing sensitive information,
make sure you're on a federal government site.
The site is secure.
The
https:// ensures that you are connecting to the official website and that any
information you provide is encrypted and transmitted securely.
Conduct subsurface surveys to identify the characteristics of potential land or mining development sites. May specify the ground support systems, processes, and equipment for safe, economical, and environmentally sound extraction or underground construction activities. May inspect areas for unsafe geological conditions, equipment, and working conditions. May design, implement, and coordinate mine safety programs. Excludes �Petroleum Engineers� (17-2171).
Employment estimate and mean wage estimates for Mining and Geological Engineers, Including Mining Safety Engineers:
| Employment (1) | Employment RSE (3) |
Mean hourly wage |
Mean annual wage (2) |
Wage RSE (3) |
|---|---|---|---|---|
| 7,370 | 3.7 % | $ 48.29 | $ 100,450 | 1.1 % |
Percentile wage estimates for Mining and Geological Engineers, Including Mining Safety Engineers:
| Percentile | 10% | 25% | 50% (Median) |
75% | 90% |
|---|---|---|---|---|---|
| Hourly Wage | $ 23.41 | $ 33.71 | $ 46.68 | $ 61.31 | $ 78.23 |
| Annual Wage (2) | $ 48,690 | $ 70,110 | $ 97,090 | $ 127,530 | $ 162,720 |
Industries with the highest published employment and wages for Mining and Geological Engineers, Including Mining Safety Engineers are provided. For a list of all industries with employment in Mining and Geological Engineers, Including Mining Safety Engineers, see the Create Customized Tables function.
Industries with the highest levels of employment in Mining and Geological Engineers, Including Mining Safety Engineers:
| Industry | Employment (1) | Percent of industry employment | Hourly mean wage | Annual mean wage (2) |
|---|---|---|---|---|
| Architectural, Engineering, and Related Services | 2,440 | 0.16 | $ 47.36 | $ 98,520 |
| Metal Ore Mining | 1,030 | 2.52 | $ 44.47 | $ 92,500 |
| Management of Companies and Enterprises | 530 | 0.02 | $ 67.95 | $ 141,340 |
| Coal Mining | 520 | 1.41 | $ 46.49 | $ 96,700 |
| Support Activities for Mining | 480 | 0.23 | $ 39.78 | $ 82,740 |
Industries with the highest concentration of employment in Mining and Geological Engineers, Including Mining Safety Engineers:
| Industry | Employment (1) | Percent of industry employment | Hourly mean wage | Annual mean wage (2) |
|---|---|---|---|---|
| Metal Ore Mining | 1,030 | 2.52 | $ 44.47 | $ 92,500 |
| Coal Mining | 520 | 1.41 | $ 46.49 | $ 96,700 |
| Oil and Gas Extraction | 420 | 0.39 | $ 72.67 | $ 151,150 |
| Nonmetallic Mineral Mining and Quarrying | 220 | 0.23 | $ 40.24 | $ 83,710 |
| Support Activities for Mining | 480 | 0.23 | $ 39.78 | $ 82,740 |
Top paying industries for Mining and Geological Engineers, Including Mining Safety Engineers:
| Industry | Employment (1) | Percent of industry employment | Hourly mean wage | Annual mean wage (2) |
|---|---|---|---|---|
| Oil and Gas Extraction | 420 | 0.39 | $ 72.67 | $ 151,150 |
| Management of Companies and Enterprises | 530 | 0.02 | $ 67.95 | $ 141,340 |
| State Government, excluding schools and hospitals (OEWS Designation) | 330 | 0.02 | $ 61.31 | $ 127,520 |
| Scientific Research and Development Services | 240 | 0.03 | $ 61.07 | $ 127,020 |
| Federal Executive Branch (OEWS Designation) | 80 | (7) | $ 47.59 | $ 98,990 |
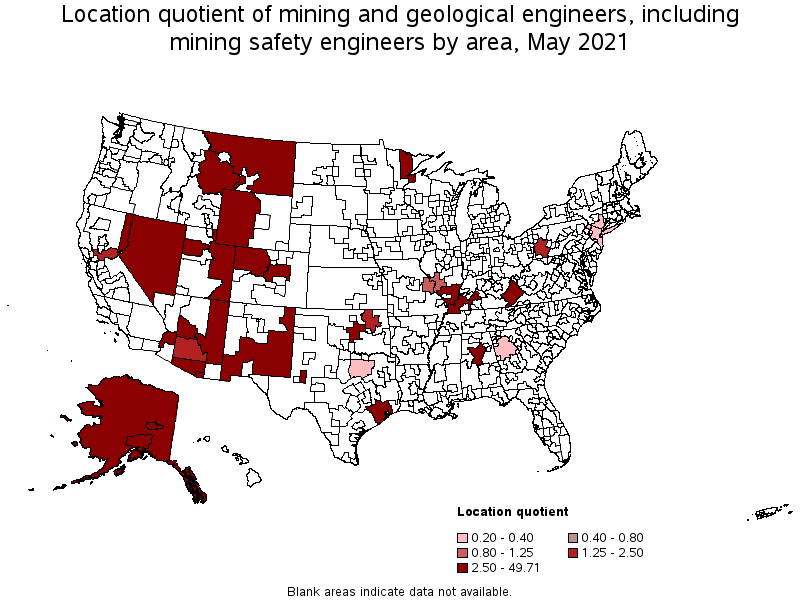
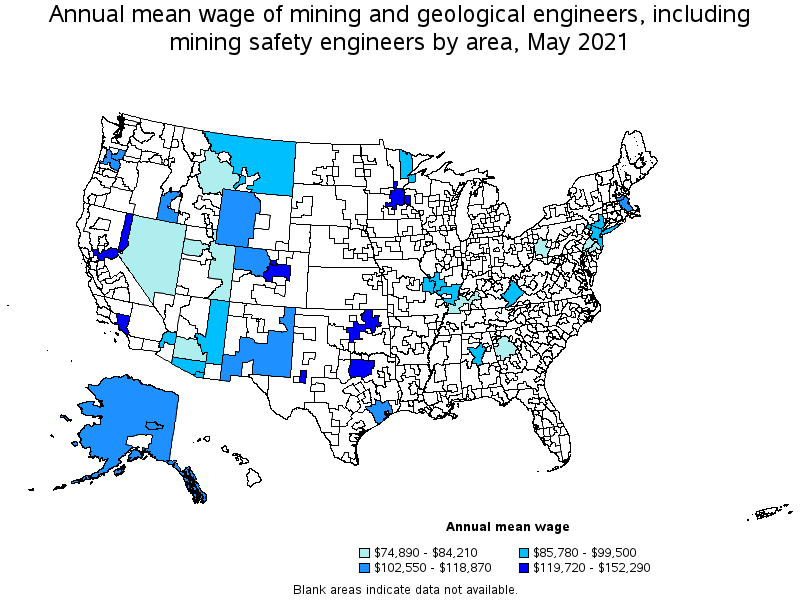
States and areas with the highest published employment, location quotients, and wages for Mining and Geological Engineers, Including Mining Safety Engineers are provided. For a list of all areas with employment in Mining and Geological Engineers, Including Mining Safety Engineers, see the Create Customized Tables function.
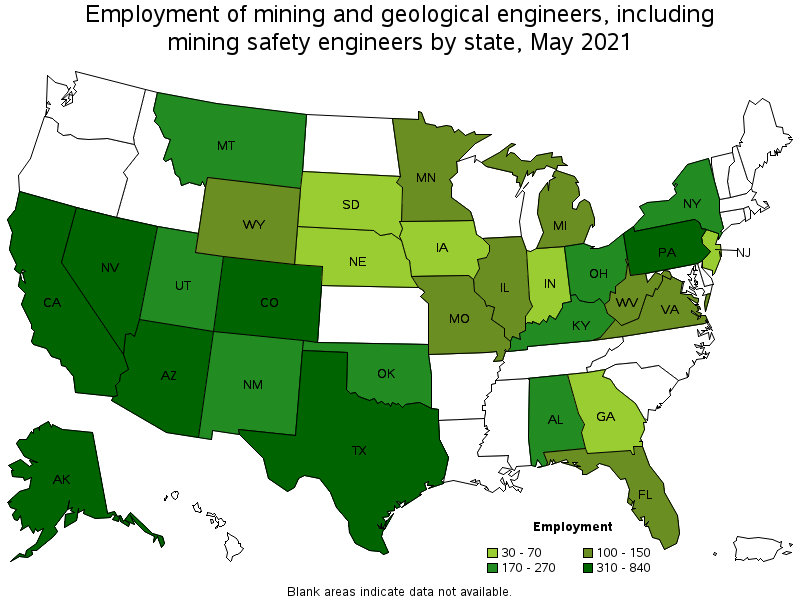
States with the highest employment level in Mining and Geological Engineers, Including Mining Safety Engineers:
| State | Employment (1) | Employment per thousand jobs | Location quotient (9) | Hourly mean wage | Annual mean wage (2) |
|---|---|---|---|---|---|
| Texas | 840 | 0.07 | 1.31 | $ 57.13 | $ 118,840 |
| Nevada | 770 | 0.60 | 11.40 | $ 49.02 | $ 101,970 |
| Pennsylvania | 690 | 0.12 | 2.37 | (8) | (8) |
| Arizona | 510 | 0.18 | 3.37 | $ 40.87 | $ 85,020 |
| Colorado | 410 | 0.16 | 2.97 | $ 58.17 | $ 120,990 |
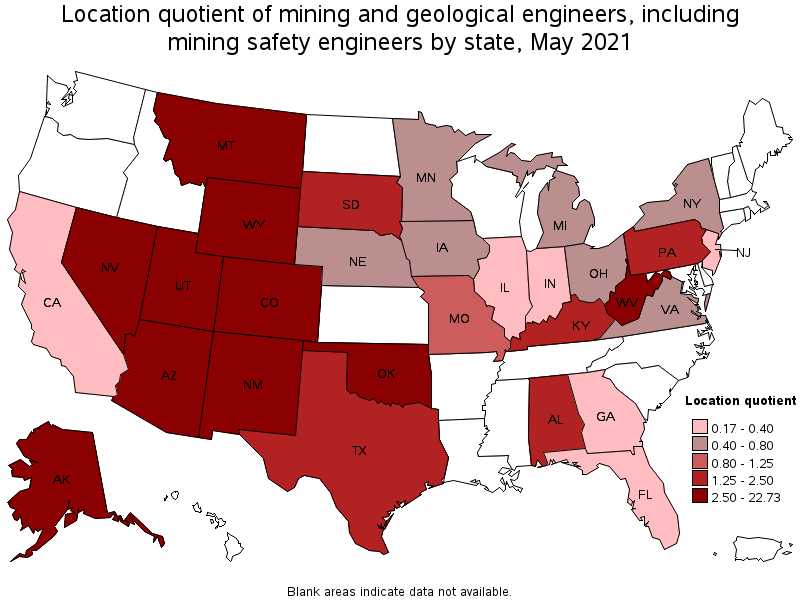
States with the highest concentration of jobs and location quotients in Mining and Geological Engineers, Including Mining Safety Engineers:
| State | Employment (1) | Employment per thousand jobs | Location quotient (9) | Hourly mean wage | Annual mean wage (2) |
|---|---|---|---|---|---|
| Alaska | 350 | 1.19 | 22.73 | $ 59.80 | $ 124,380 |
| Nevada | 770 | 0.60 | 11.40 | $ 49.02 | $ 101,970 |
| Montana | 190 | 0.41 | 7.76 | $ 44.34 | $ 92,230 |
| Wyoming | 100 | 0.38 | 7.32 | $ 48.05 | $ 99,950 |
| New Mexico | 180 | 0.24 | 4.54 | $ 61.54 | $ 128,010 |
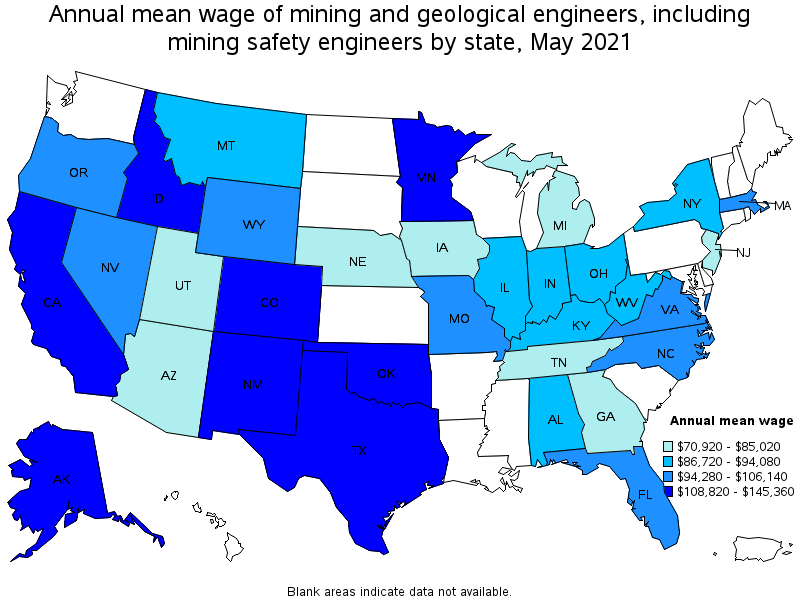
Top paying states for Mining and Geological Engineers, Including Mining Safety Engineers:
| State | Employment (1) | Employment per thousand jobs | Location quotient (9) | Hourly mean wage | Annual mean wage (2) |
|---|---|---|---|---|---|
| Oklahoma | 270 | 0.17 | 3.32 | $ 69.88 | $ 145,360 |
| California | 310 | 0.02 | 0.36 | $ 67.87 | $ 141,170 |
| New Mexico | 180 | 0.24 | 4.54 | $ 61.54 | $ 128,010 |
| Alaska | 350 | 1.19 | 22.73 | $ 59.80 | $ 124,380 |
| Colorado | 410 | 0.16 | 2.97 | $ 58.17 | $ 120,990 |
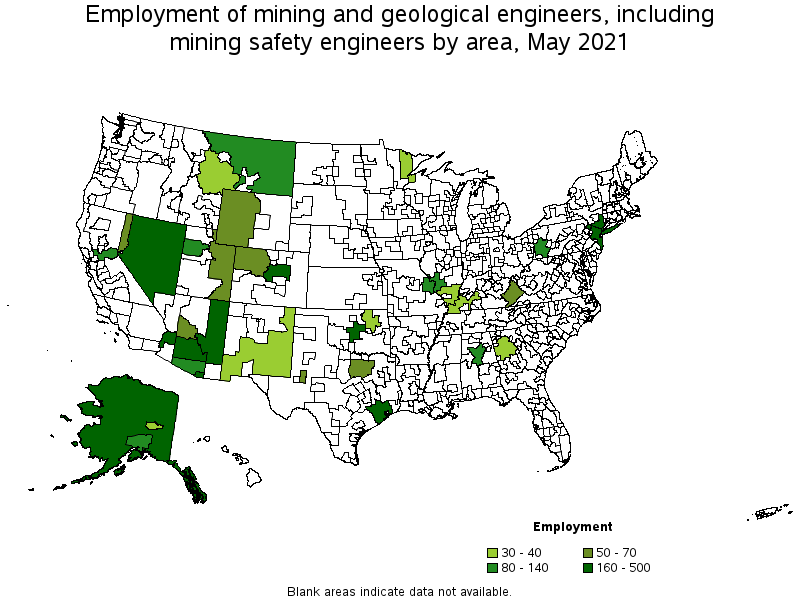
Metropolitan areas with the highest employment level in Mining and Geological Engineers, Including Mining Safety Engineers:
| Metropolitan area | Employment (1) | Employment per thousand jobs | Location quotient (9) | Hourly mean wage | Annual mean wage (2) |
|---|---|---|---|---|---|
| Houston-The Woodlands-Sugar Land, TX | 500 | 0.17 | 3.27 | $ 57.15 | $ 118,870 |
| Denver-Aurora-Lakewood, CO | 230 | 0.16 | 2.97 | $ 57.56 | $ 119,720 |
| Oklahoma City, OK | 210 | 0.34 | 6.53 | $ 71.67 | $ 149,070 |
| New York-Newark-Jersey City, NY-NJ-PA | 170 | 0.02 | 0.37 | $ 42.52 | $ 88,440 |
| Phoenix-Mesa-Scottsdale, AZ | 160 | 0.08 | 1.48 | $ 36.18 | $ 75,250 |
| Salt Lake City, UT | 140 | 0.19 | 3.55 | $ 40.24 | $ 83,690 |
| Sacramento--Roseville--Arden-Arcade, CA | 130 | 0.13 | 2.47 | $ 72.58 | $ 150,970 |
| Pittsburgh, PA | 110 | 0.10 | 1.96 | $ 37.80 | $ 78,620 |
| Tucson, AZ | 100 | 0.26 | 4.98 | $ 44.17 | $ 91,880 |
| Anchorage, AK | 100 | 0.59 | 11.23 | (8) | (8) |
Metropolitan areas with the highest concentration of jobs and location quotients in Mining and Geological Engineers, Including Mining Safety Engineers:
| Metropolitan area | Employment (1) | Employment per thousand jobs | Location quotient (9) | Hourly mean wage | Annual mean wage (2) |
|---|---|---|---|---|---|
| Prescott, AZ | 70 | 1.04 | 19.93 | (8) | (8) |
| Fairbanks, AK | 30 | 0.95 | 18.15 | $ 51.25 | $ 106,600 |
| Midland, TX | 70 | 0.70 | 13.36 | $ 60.31 | $ 125,440 |
| Anchorage, AK | 100 | 0.59 | 11.23 | (8) | (8) |
| Duluth, MN-WI | 40 | 0.37 | 7.07 | $ 45.63 | $ 94,910 |
| Oklahoma City, OK | 210 | 0.34 | 6.53 | $ 71.67 | $ 149,070 |
| Tucson, AZ | 100 | 0.26 | 4.98 | $ 44.17 | $ 91,880 |
| Reno, NV | 50 | 0.20 | 3.84 | $ 59.22 | $ 123,180 |
| Salt Lake City, UT | 140 | 0.19 | 3.55 | $ 40.24 | $ 83,690 |
| Houston-The Woodlands-Sugar Land, TX | 500 | 0.17 | 3.27 | $ 57.15 | $ 118,870 |
Top paying metropolitan areas for Mining and Geological Engineers, Including Mining Safety Engineers:
| Metropolitan area | Employment (1) | Employment per thousand jobs | Location quotient (9) | Hourly mean wage | Annual mean wage (2) |
|---|---|---|---|---|---|
| Boulder, CO | (8) | (8) | (8) | $ 73.21 | $ 152,290 |
| Sacramento--Roseville--Arden-Arcade, CA | 130 | 0.13 | 2.47 | $ 72.58 | $ 150,970 |
| Oklahoma City, OK | 210 | 0.34 | 6.53 | $ 71.67 | $ 149,070 |
| Tulsa, OK | 40 | 0.10 | 1.94 | $ 66.92 | $ 139,190 |
| Los Angeles-Long Beach-Anaheim, CA | (8) | (8) | (8) | $ 64.63 | $ 134,420 |
| Midland, TX | 70 | 0.70 | 13.36 | $ 60.31 | $ 125,440 |
| Reno, NV | 50 | 0.20 | 3.84 | $ 59.22 | $ 123,180 |
| Minneapolis-St. Paul-Bloomington, MN-WI | (8) | (8) | (8) | $ 58.69 | $ 122,080 |
| Dallas-Fort Worth-Arlington, TX | 70 | 0.02 | 0.39 | $ 57.58 | $ 119,770 |
| Denver-Aurora-Lakewood, CO | 230 | 0.16 | 2.97 | $ 57.56 | $ 119,720 |
Nonmetropolitan areas with the highest employment in Mining and Geological Engineers, Including Mining Safety Engineers:
| Nonmetropolitan area | Employment (1) | Employment per thousand jobs | Location quotient (9) | Hourly mean wage | Annual mean wage (2) |
|---|---|---|---|---|---|
| Nevada nonmetropolitan area | 250 | 2.60 | 49.71 | $ 40.49 | $ 84,210 |
| Alaska nonmetropolitan area | 220 | 2.29 | 43.81 | $ 51.44 | $ 107,000 |
| Arizona nonmetropolitan area | 170 | 1.86 | 35.56 | $ 44.79 | $ 93,170 |
| East-Central Montana nonmetropolitan area | 80 | 1.31 | 24.96 | $ 47.76 | $ 99,340 |
| East Kentucky nonmetropolitan area | 70 | 0.73 | 13.94 | $ 42.39 | $ 88,180 |
Nonmetropolitan areas with the highest concentration of jobs and location quotients in Mining and Geological Engineers, Including Mining Safety Engineers:
| Nonmetropolitan area | Employment (1) | Employment per thousand jobs | Location quotient (9) | Hourly mean wage | Annual mean wage (2) |
|---|---|---|---|---|---|
| Nevada nonmetropolitan area | 250 | 2.60 | 49.71 | $ 40.49 | $ 84,210 |
| Alaska nonmetropolitan area | 220 | 2.29 | 43.81 | $ 51.44 | $ 107,000 |
| Arizona nonmetropolitan area | 170 | 1.86 | 35.56 | $ 44.79 | $ 93,170 |
| East-Central Montana nonmetropolitan area | 80 | 1.31 | 24.96 | $ 47.76 | $ 99,340 |
| East Kentucky nonmetropolitan area | 70 | 0.73 | 13.94 | $ 42.39 | $ 88,180 |
Top paying nonmetropolitan areas for Mining and Geological Engineers, Including Mining Safety Engineers:
| Nonmetropolitan area | Employment (1) | Employment per thousand jobs | Location quotient (9) | Hourly mean wage | Annual mean wage (2) |
|---|---|---|---|---|---|
| Alaska nonmetropolitan area | 220 | 2.29 | 43.81 | $ 51.44 | $ 107,000 |
| Northwest Colorado nonmetropolitan area | 50 | 0.43 | 8.18 | $ 50.19 | $ 104,400 |
| Western Wyoming nonmetropolitan area | 60 | 0.67 | 12.80 | $ 49.43 | $ 102,820 |
| Eastern New Mexico nonmetropolitan area | 40 | 0.30 | 5.74 | $ 49.33 | $ 102,600 |
| East-Central Montana nonmetropolitan area | 80 | 1.31 | 24.96 | $ 47.76 | $ 99,340 |
These estimates are calculated with data collected from employers in all industry sectors, all metropolitan and nonmetropolitan areas, and all states and the District of Columbia. The top employment and wage figures are provided above. The complete list is available in the downloadable XLS files.
The percentile wage estimate is the value of a wage below which a certain percent of workers fall. The median wage is the 50th percentile wage estimate—50 percent of workers earn less than the median and 50 percent of workers earn more than the median. More about percentile wages.
(1) Estimates for detailed occupations do not sum to the totals because the totals include occupations not shown separately. Estimates do not include self-employed workers.
(2) Annual wages have been calculated by multiplying the hourly mean wage by a "year-round, full-time" hours figure of 2,080 hours; for those occupations where there is not an hourly wage published, the annual wage has been directly calculated from the reported survey data.
(3) The relative standard error (RSE) is a measure of the reliability of a survey statistic. The smaller the relative standard error, the more precise the estimate.
(7) The value is less than .005 percent of industry employment.
(8) Estimate not released.
(9) The location quotient is the ratio of the area concentration of occupational employment to the national average concentration. A location quotient greater than one indicates the occupation has a higher share of employment than average, and a location quotient less than one indicates the occupation is less prevalent in the area than average.
Other OEWS estimates and related information:
May 2021 National Occupational Employment and Wage Estimates
May 2021 State Occupational Employment and Wage Estimates
May 2021 Metropolitan and Nonmetropolitan Area Occupational Employment and Wage Estimates
May 2021 National Industry-Specific Occupational Employment and Wage Estimates
Last Modified Date: March 31, 2022