
An official website of the United States government
An official website of the United States government
The .gov means it's official.
Federal government websites often end in .gov or .mil. Before sharing sensitive information,
make sure you're on a federal government site.
The site is secure.
The
https:// ensures that you are connecting to the official website and that any
information you provide is encrypted and transmitted securely.
Prepare detailed working diagrams of machinery and mechanical devices, including dimensions, fastening methods, and other engineering information.
Employment estimate and mean wage estimates for Mechanical Drafters:
| Employment (1) | Employment RSE (3) |
Mean hourly wage |
Mean annual wage (2) |
Wage RSE (3) |
|---|---|---|---|---|
| 47,760 | 1.9 % | $ 30.12 | $ 62,650 | 0.7 % |
Percentile wage estimates for Mechanical Drafters:
| Percentile | 10% | 25% | 50% (Median) |
75% | 90% |
|---|---|---|---|---|---|
| Hourly Wage | $ 18.07 | $ 22.71 | $ 28.94 | $ 36.61 | $ 46.09 |
| Annual Wage (2) | $ 37,590 | $ 47,230 | $ 60,200 | $ 76,150 | $ 95,860 |
Industries with the highest published employment and wages for Mechanical Drafters are provided. For a list of all industries with employment in Mechanical Drafters, see the Create Customized Tables function.
Industries with the highest levels of employment in Mechanical Drafters:
| Industry | Employment (1) | Percent of industry employment | Hourly mean wage | Annual mean wage (2) |
|---|---|---|---|---|
| Architectural, Engineering, and Related Services | 10,620 | 0.70 | $ 31.58 | $ 65,680 |
| Machinery Manufacturing (3331, 3332, 3334, and 3339 only) | 5,630 | 0.80 | $ 27.66 | $ 57,530 |
| Fabricated Metal Product Manufacturing (3323 and 3324 only) | 4,480 | 0.97 | $ 26.60 | $ 55,340 |
| Employment Services | 3,560 | 0.10 | $ 28.37 | $ 59,010 |
| Building Equipment Contractors | 2,690 | 0.12 | $ 35.69 | $ 74,240 |
Industries with the highest concentration of employment in Mechanical Drafters:
| Industry | Employment (1) | Percent of industry employment | Hourly mean wage | Annual mean wage (2) |
|---|---|---|---|---|
| Fabricated Metal Product Manufacturing (3323 and 3324 only) | 4,480 | 0.97 | $ 26.60 | $ 55,340 |
| Machinery Manufacturing (3331, 3332, 3334, and 3339 only) | 5,630 | 0.80 | $ 27.66 | $ 57,530 |
| Metalworking Machinery Manufacturing | 1,160 | 0.73 | $ 27.49 | $ 57,170 |
| Architectural, Engineering, and Related Services | 10,620 | 0.70 | $ 31.58 | $ 65,680 |
| Railroad Rolling Stock Manufacturing | 140 | 0.69 | $ 30.49 | $ 63,410 |
Top paying industries for Mechanical Drafters:
| Industry | Employment (1) | Percent of industry employment | Hourly mean wage | Annual mean wage (2) |
|---|---|---|---|---|
| Pharmaceutical and Medicine Manufacturing | 100 | 0.03 | $ 44.42 | $ 92,390 |
| Electric Power Generation, Transmission and Distribution | 100 | 0.03 | $ 44.27 | $ 92,080 |
| Petroleum and Coal Products Manufacturing | 40 | 0.04 | $ 43.07 | $ 89,590 |
| Management of Companies and Enterprises | 630 | 0.02 | $ 42.52 | $ 88,450 |
| Computer and Peripheral Equipment Manufacturing | 40 | 0.03 | $ 42.02 | $ 87,400 |
States and areas with the highest published employment, location quotients, and wages for Mechanical Drafters are provided. For a list of all areas with employment in Mechanical Drafters, see the Create Customized Tables function.
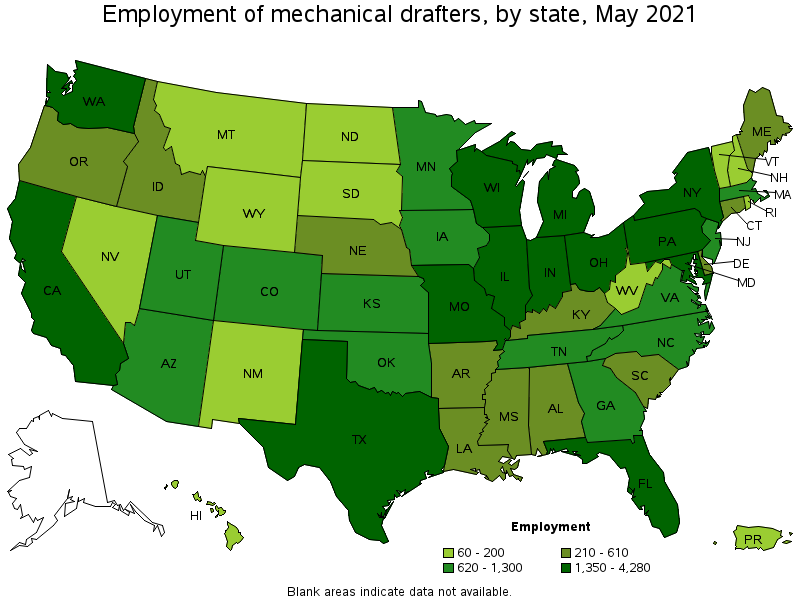
States with the highest employment level in Mechanical Drafters:
| State | Employment (1) | Employment per thousand jobs | Location quotient (9) | Hourly mean wage | Annual mean wage (2) |
|---|---|---|---|---|---|
| California | 4,280 | 0.26 | 0.76 | $ 34.40 | $ 71,550 |
| Texas | 3,600 | 0.29 | 0.87 | $ 30.75 | $ 63,960 |
| Pennsylvania | 3,010 | 0.54 | 1.59 | $ 27.60 | $ 57,400 |
| Wisconsin | 2,490 | 0.90 | 2.67 | $ 27.33 | $ 56,840 |
| Florida | 2,320 | 0.27 | 0.80 | $ 30.50 | $ 63,430 |
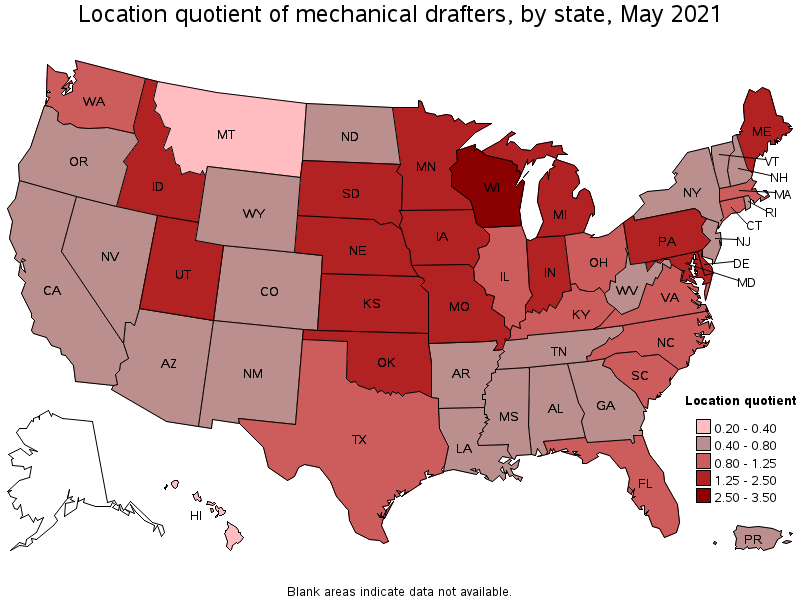
States with the highest concentration of jobs and location quotients in Mechanical Drafters:
| State | Employment (1) | Employment per thousand jobs | Location quotient (9) | Hourly mean wage | Annual mean wage (2) |
|---|---|---|---|---|---|
| Wisconsin | 2,490 | 0.90 | 2.67 | $ 27.33 | $ 56,840 |
| Indiana | 2,030 | 0.68 | 2.01 | $ 27.80 | $ 57,820 |
| Maine | 380 | 0.64 | 1.88 | $ 30.00 | $ 62,400 |
| Missouri | 1,690 | 0.62 | 1.83 | $ 27.28 | $ 56,750 |
| Maryland | 1,570 | 0.62 | 1.82 | $ 34.28 | $ 71,310 |
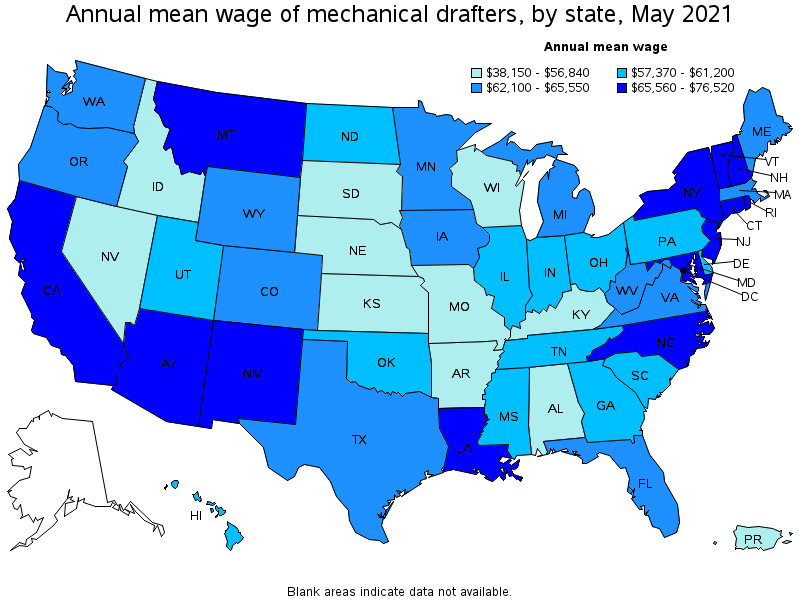
Top paying states for Mechanical Drafters:
| State | Employment (1) | Employment per thousand jobs | Location quotient (9) | Hourly mean wage | Annual mean wage (2) |
|---|---|---|---|---|---|
| Louisiana | 370 | 0.21 | 0.61 | $ 36.79 | $ 76,520 |
| Vermont | 70 | 0.24 | 0.72 | $ 35.83 | $ 74,520 |
| New Jersey | 970 | 0.25 | 0.74 | $ 35.28 | $ 73,390 |
| Rhode Island | 80 | 0.17 | 0.51 | $ 35.28 | $ 73,390 |
| California | 4,280 | 0.26 | 0.76 | $ 34.40 | $ 71,550 |
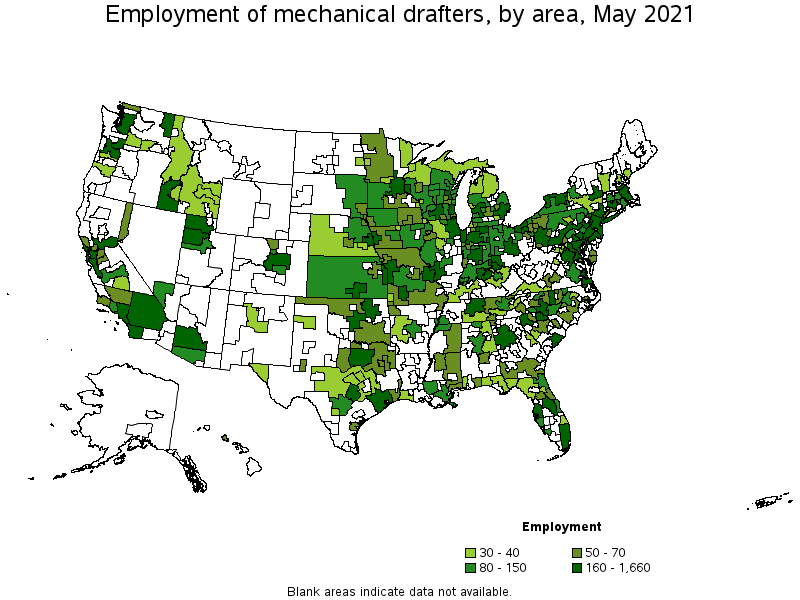
Metropolitan areas with the highest employment level in Mechanical Drafters:
| Metropolitan area | Employment (1) | Employment per thousand jobs | Location quotient (9) | Hourly mean wage | Annual mean wage (2) |
|---|---|---|---|---|---|
| New York-Newark-Jersey City, NY-NJ-PA | 1,660 | 0.19 | 0.56 | $ 35.78 | $ 74,430 |
| Los Angeles-Long Beach-Anaheim, CA | 1,370 | 0.24 | 0.71 | $ 31.31 | $ 65,110 |
| Houston-The Woodlands-Sugar Land, TX | 1,260 | 0.44 | 1.29 | $ 33.92 | $ 70,560 |
| Chicago-Naperville-Elgin, IL-IN-WI | 1,220 | 0.29 | 0.85 | $ 30.35 | $ 63,130 |
| Philadelphia-Camden-Wilmington, PA-NJ-DE-MD | 1,100 | 0.41 | 1.22 | $ 30.35 | $ 63,120 |
| Detroit-Warren-Dearborn, MI | 1,040 | 0.58 | 1.70 | $ 32.09 | $ 66,740 |
| Dallas-Fort Worth-Arlington, TX | 1,030 | 0.29 | 0.85 | $ 29.13 | $ 60,590 |
| Baltimore-Columbia-Towson, MD | 960 | 0.77 | 2.26 | $ 34.48 | $ 71,710 |
| Boston-Cambridge-Nashua, MA-NH | 950 | 0.37 | 1.09 | $ 32.25 | $ 67,080 |
| Milwaukee-Waukesha-West Allis, WI | 890 | 1.13 | 3.34 | $ 27.40 | $ 56,990 |
Metropolitan areas with the highest concentration of jobs and location quotients in Mechanical Drafters:
| Metropolitan area | Employment (1) | Employment per thousand jobs | Location quotient (9) | Hourly mean wage | Annual mean wage (2) |
|---|---|---|---|---|---|
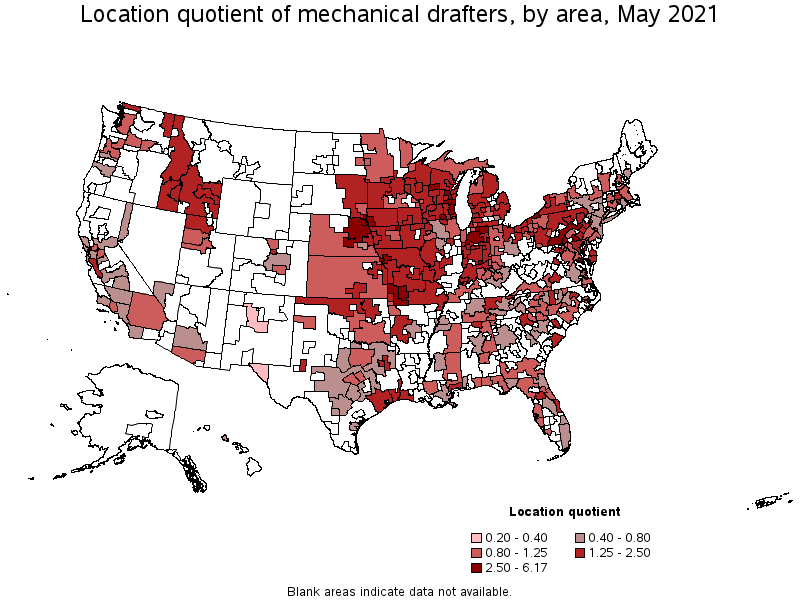
| Columbus, IN | 100 | 2.09 | 6.17 | $ 28.83 | $ 59,960 |
| Wausau, WI | 140 | 2.09 | 6.16 | $ 25.09 | $ 52,190 |
| Sheboygan, WI | 110 | 1.83 | 5.41 | $ 27.43 | $ 57,050 |
| Elkhart-Goshen, IN | 240 | 1.76 | 5.20 | $ 26.36 | $ 54,830 |
| Fond du Lac, WI | 70 | 1.62 | 4.78 | $ 31.39 | $ 65,300 |
| Grand Island, NE | 60 | 1.56 | 4.60 | $ 22.94 | $ 47,710 |
| Appleton, WI | 160 | 1.34 | 3.96 | $ 29.87 | $ 62,130 |
| Milwaukee-Waukesha-West Allis, WI | 890 | 1.13 | 3.34 | $ 27.40 | $ 56,990 |
| Janesville-Beloit, WI | 70 | 1.07 | 3.16 | $ 29.29 | $ 60,920 |
| California-Lexington Park, MD | 50 | 1.02 | 3.00 | $ 29.73 | $ 61,830 |
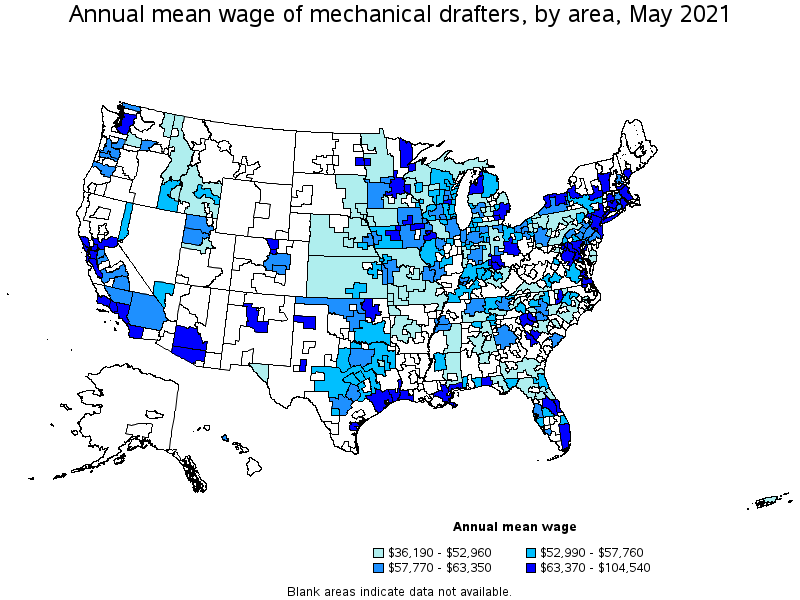
Top paying metropolitan areas for Mechanical Drafters:
| Metropolitan area | Employment (1) | Employment per thousand jobs | Location quotient (9) | Hourly mean wage | Annual mean wage (2) |
|---|---|---|---|---|---|
| San Jose-Sunnyvale-Santa Clara, CA | 540 | 0.51 | 1.50 | $ 50.26 | $ 104,540 |
| Corpus Christi, TX | 50 | 0.27 | 0.79 | $ 43.61 | $ 90,720 |
| New Orleans-Metairie, LA | 110 | 0.22 | 0.65 | $ 39.71 | $ 82,590 |
| Gulfport-Biloxi-Pascagoula, MS | 70 | 0.46 | 1.35 | $ 39.61 | $ 82,390 |
| Lake Charles, LA | 40 | 0.47 | 1.38 | $ 39.11 | $ 81,350 |
| Trenton, NJ | 60 | 0.27 | 0.80 | $ 38.10 | $ 79,250 |
| San Francisco-Oakland-Hayward, CA | 450 | 0.20 | 0.59 | $ 37.54 | $ 78,080 |
| Boulder, CO | 90 | 0.50 | 1.48 | $ 36.42 | $ 75,750 |
| New York-Newark-Jersey City, NY-NJ-PA | 1,660 | 0.19 | 0.56 | $ 35.78 | $ 74,430 |
| New Haven, CT | 60 | 0.21 | 0.61 | $ 35.22 | $ 73,250 |
Nonmetropolitan areas with the highest employment in Mechanical Drafters:
| Nonmetropolitan area | Employment (1) | Employment per thousand jobs | Location quotient (9) | Hourly mean wage | Annual mean wage (2) |
|---|---|---|---|---|---|
| Northern Indiana nonmetropolitan area | 270 | 1.31 | 3.86 | $ 28.11 | $ 58,470 |
| Southern Pennsylvania nonmetropolitan area | 160 | 0.91 | 2.70 | $ 23.53 | $ 48,950 |
| Balance of Lower Peninsula of Michigan nonmetropolitan area | 140 | 0.56 | 1.65 | $ 24.60 | $ 51,160 |
| South Central Wisconsin nonmetropolitan area | 140 | 0.71 | 2.09 | $ 25.83 | $ 53,720 |
| Kansas nonmetropolitan area | 140 | 0.37 | 1.09 | $ 25.14 | $ 52,300 |
Nonmetropolitan areas with the highest concentration of jobs and location quotients in Mechanical Drafters:
| Nonmetropolitan area | Employment (1) | Employment per thousand jobs | Location quotient (9) | Hourly mean wage | Annual mean wage (2) |
|---|---|---|---|---|---|
| Northern Indiana nonmetropolitan area | 270 | 1.31 | 3.86 | $ 28.11 | $ 58,470 |
| Northeast Nebraska nonmetropolitan area | 110 | 1.23 | 3.62 | $ 20.96 | $ 43,590 |
| Southwest Missouri nonmetropolitan area | 70 | 0.93 | 2.74 | $ 23.01 | $ 47,850 |
| Southern Pennsylvania nonmetropolitan area | 160 | 0.91 | 2.70 | $ 23.53 | $ 48,950 |
| Western Wisconsin nonmetropolitan area | 110 | 0.83 | 2.44 | $ 24.51 | $ 50,990 |
Top paying nonmetropolitan areas for Mechanical Drafters:
| Nonmetropolitan area | Employment (1) | Employment per thousand jobs | Location quotient (9) | Hourly mean wage | Annual mean wage (2) |
|---|---|---|---|---|---|
| Southern Vermont nonmetropolitan area | 40 | 0.38 | 1.11 | $ 36.45 | $ 75,810 |
| Northwest Lower Peninsula of Michigan nonmetropolitan area | 40 | 0.36 | 1.05 | $ 31.51 | $ 65,540 |
| Central New Hampshire nonmetropolitan area | 30 | 0.36 | 1.07 | $ 29.82 | $ 62,020 |
| Northwest Oklahoma nonmetropolitan area | 50 | 0.53 | 1.56 | $ 29.38 | $ 61,110 |
| Southwest New York nonmetropolitan area | 120 | 0.73 | 2.15 | $ 29.33 | $ 61,010 |
These estimates are calculated with data collected from employers in all industry sectors, all metropolitan and nonmetropolitan areas, and all states and the District of Columbia. The top employment and wage figures are provided above. The complete list is available in the downloadable XLS files.
The percentile wage estimate is the value of a wage below which a certain percent of workers fall. The median wage is the 50th percentile wage estimate—50 percent of workers earn less than the median and 50 percent of workers earn more than the median. More about percentile wages.
(1) Estimates for detailed occupations do not sum to the totals because the totals include occupations not shown separately. Estimates do not include self-employed workers.
(2) Annual wages have been calculated by multiplying the hourly mean wage by a "year-round, full-time" hours figure of 2,080 hours; for those occupations where there is not an hourly wage published, the annual wage has been directly calculated from the reported survey data.
(3) The relative standard error (RSE) is a measure of the reliability of a survey statistic. The smaller the relative standard error, the more precise the estimate.
(9) The location quotient is the ratio of the area concentration of occupational employment to the national average concentration. A location quotient greater than one indicates the occupation has a higher share of employment than average, and a location quotient less than one indicates the occupation is less prevalent in the area than average.
Other OEWS estimates and related information:
May 2021 National Occupational Employment and Wage Estimates
May 2021 State Occupational Employment and Wage Estimates
May 2021 Metropolitan and Nonmetropolitan Area Occupational Employment and Wage Estimates
May 2021 National Industry-Specific Occupational Employment and Wage Estimates
Last Modified Date: March 31, 2022