
An official website of the United States government
An official website of the United States government
The .gov means it's official.
Federal government websites often end in .gov or .mil. Before sharing sensitive information,
make sure you're on a federal government site.
The site is secure.
The
https:// ensures that you are connecting to the official website and that any
information you provide is encrypted and transmitted securely.
Apply electrical and electronic theory and related knowledge, usually under the direction of engineering staff, to design, build, repair, adjust, and modify electrical components, circuitry, controls, and machinery for subsequent evaluation and use by engineering staff in making engineering design decisions. Excludes �Broadcast Technicians� (27-4012).
Employment estimate and mean wage estimates for Electrical and Electronic Engineering Technologists and Technicians:
| Employment (1) | Employment RSE (3) |
Mean hourly wage |
Mean annual wage (2) |
Wage RSE (3) |
|---|---|---|---|---|
| 101,450 | 1.4 % | $ 33.21 | $ 69,070 | 0.5 % |
Percentile wage estimates for Electrical and Electronic Engineering Technologists and Technicians:
| Percentile | 10% | 25% | 50% (Median) |
75% | 90% |
|---|---|---|---|---|---|
| Hourly Wage | $ 19.16 | $ 23.72 | $ 30.60 | $ 38.02 | $ 47.70 |
| Annual Wage (2) | $ 39,840 | $ 49,330 | $ 63,640 | $ 79,080 | $ 99,210 |
Industries with the highest published employment and wages for Electrical and Electronic Engineering Technologists and Technicians are provided. For a list of all industries with employment in Electrical and Electronic Engineering Technologists and Technicians, see the Create Customized Tables function.
Industries with the highest levels of employment in Electrical and Electronic Engineering Technologists and Technicians:
| Industry | Employment (1) | Percent of industry employment | Hourly mean wage | Annual mean wage (2) |
|---|---|---|---|---|
| Architectural, Engineering, and Related Services | 14,270 | 0.94 | $ 31.89 | $ 66,330 |
| Semiconductor and Other Electronic Component Manufacturing | 11,860 | 3.32 | $ 30.80 | $ 64,070 |
| Federal Executive Branch (OEWS Designation) | 7,590 | 0.36 | $ 43.96 | $ 91,430 |
| Navigational, Measuring, Electromedical, and Control Instruments Manufacturing | 6,710 | 1.68 | $ 31.18 | $ 64,860 |
| Electric Power Generation, Transmission and Distribution | 5,050 | 1.34 | $ 39.99 | $ 83,180 |
Industries with the highest concentration of employment in Electrical and Electronic Engineering Technologists and Technicians:
| Industry | Employment (1) | Percent of industry employment | Hourly mean wage | Annual mean wage (2) |
|---|---|---|---|---|
| Communications Equipment Manufacturing | 2,860 | 3.37 | $ 27.61 | $ 57,420 |
| Semiconductor and Other Electronic Component Manufacturing | 11,860 | 3.32 | $ 30.80 | $ 64,070 |
| Navigational, Measuring, Electromedical, and Control Instruments Manufacturing | 6,710 | 1.68 | $ 31.18 | $ 64,860 |
| Pipeline Transportation of Crude Oil | 170 | 1.49 | $ 41.60 | $ 86,530 |
| Electric Power Generation, Transmission and Distribution | 5,050 | 1.34 | $ 39.99 | $ 83,180 |
Top paying industries for Electrical and Electronic Engineering Technologists and Technicians:
| Industry | Employment (1) | Percent of industry employment | Hourly mean wage | Annual mean wage (2) |
|---|---|---|---|---|
| Waste Treatment and Disposal | 50 | 0.05 | $ 46.63 | $ 96,990 |
| Oil and Gas Extraction | 150 | 0.14 | $ 46.36 | $ 96,420 |
| Natural Gas Distribution | 690 | 0.63 | $ 45.56 | $ 94,760 |
| Federal Executive Branch (OEWS Designation) | 7,590 | 0.36 | $ 43.96 | $ 91,430 |
| Other Pipeline Transportation | 90 | 1.03 | $ 43.92 | $ 91,350 |
States and areas with the highest published employment, location quotients, and wages for Electrical and Electronic Engineering Technologists and Technicians are provided. For a list of all areas with employment in Electrical and Electronic Engineering Technologists and Technicians, see the Create Customized Tables function.
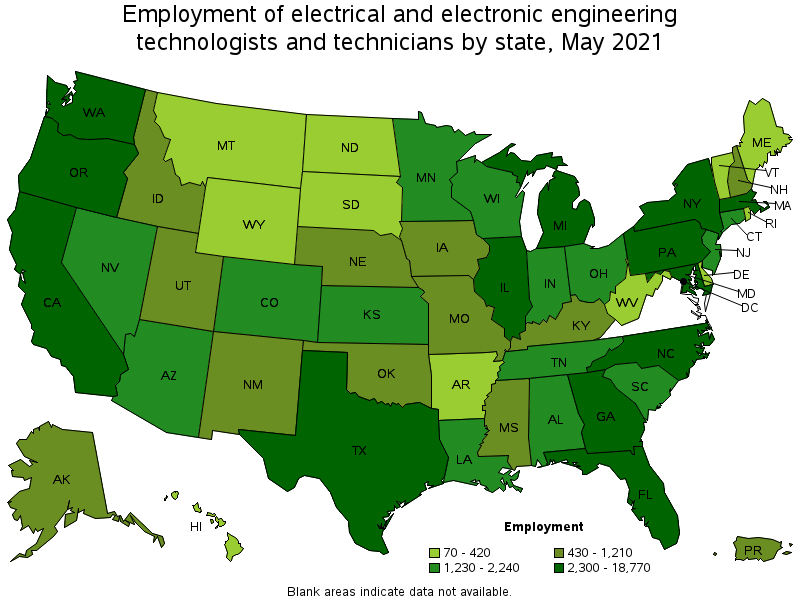
States with the highest employment level in Electrical and Electronic Engineering Technologists and Technicians:
| State | Employment (1) | Employment per thousand jobs | Location quotient (9) | Hourly mean wage | Annual mean wage (2) |
|---|---|---|---|---|---|
| California | 18,770 | 1.14 | 1.58 | $ 35.53 | $ 73,910 |
| Texas | 8,320 | 0.68 | 0.94 | $ 32.04 | $ 66,640 |
| Florida | 5,950 | 0.69 | 0.96 | $ 29.33 | $ 61,010 |
| New York | 4,470 | 0.52 | 0.72 | $ 32.78 | $ 68,170 |
| Pennsylvania | 3,590 | 0.64 | 0.89 | $ 30.87 | $ 64,200 |
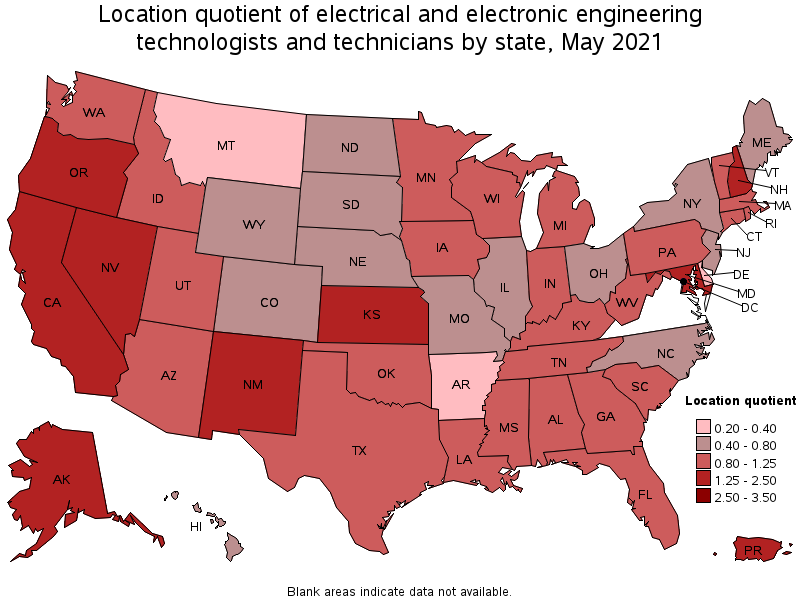
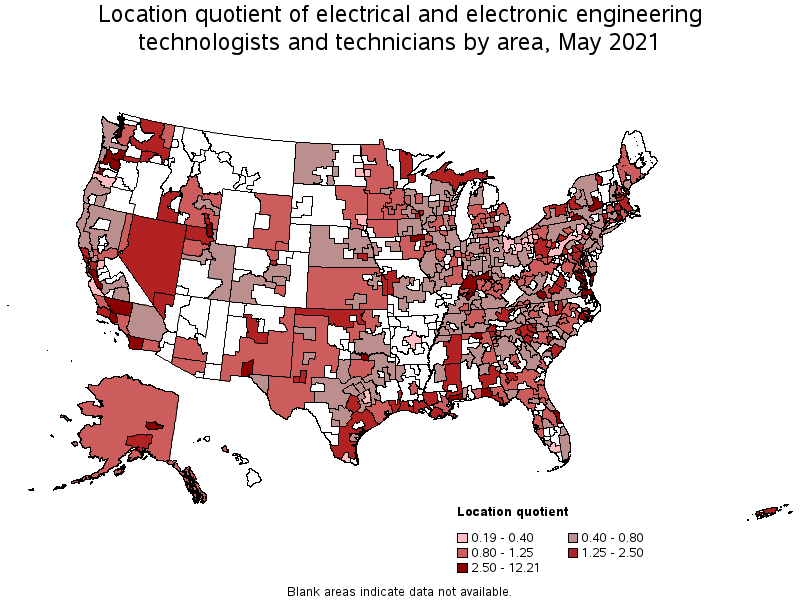
States with the highest concentration of jobs and location quotients in Electrical and Electronic Engineering Technologists and Technicians:
| State | Employment (1) | Employment per thousand jobs | Location quotient (9) | Hourly mean wage | Annual mean wage (2) |
|---|---|---|---|---|---|
| Alaska | 430 | 1.46 | 2.03 | $ 39.74 | $ 82,670 |
| Oregon | 2,530 | 1.39 | 1.93 | $ 30.81 | $ 64,090 |
| Maryland | 3,350 | 1.32 | 1.83 | $ 39.99 | $ 83,180 |
| New Mexico | 900 | 1.16 | 1.61 | $ 35.07 | $ 72,950 |
| California | 18,770 | 1.14 | 1.58 | $ 35.53 | $ 73,910 |
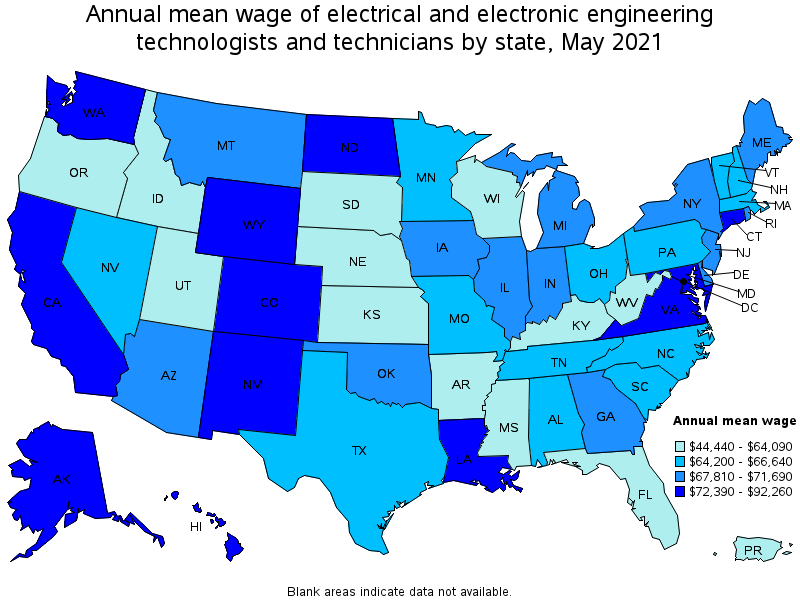
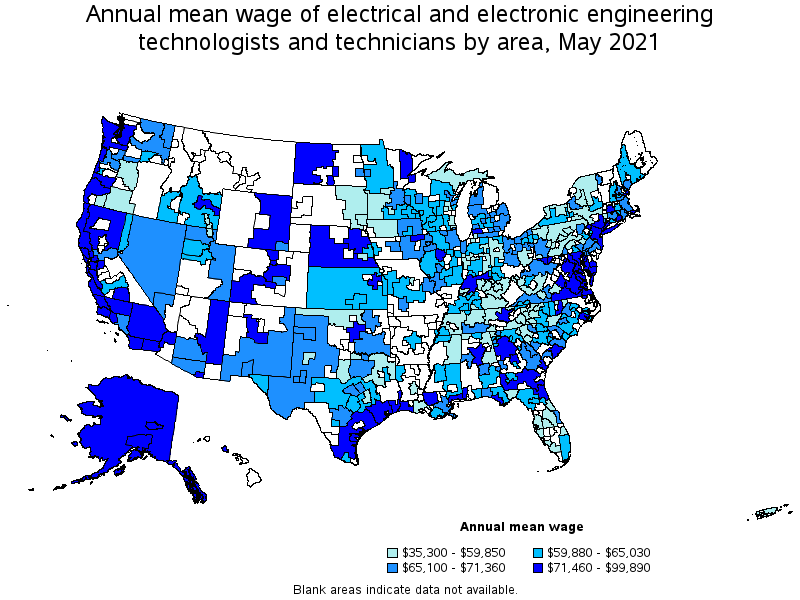
Top paying states for Electrical and Electronic Engineering Technologists and Technicians:
| State | Employment (1) | Employment per thousand jobs | Location quotient (9) | Hourly mean wage | Annual mean wage (2) |
|---|---|---|---|---|---|
| District of Columbia | 180 | 0.27 | 0.38 | $ 44.36 | $ 92,260 |
| Hawaii | 290 | 0.53 | 0.74 | $ 41.07 | $ 85,430 |
| Maryland | 3,350 | 1.32 | 1.83 | $ 39.99 | $ 83,180 |
| Alaska | 430 | 1.46 | 2.03 | $ 39.74 | $ 82,670 |
| Colorado | 1,260 | 0.48 | 0.67 | $ 38.81 | $ 80,720 |
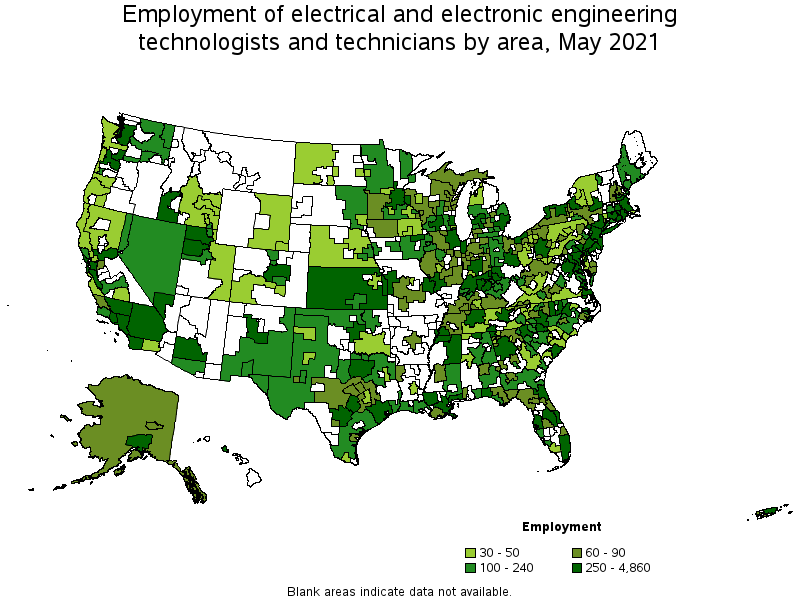
Metropolitan areas with the highest employment level in Electrical and Electronic Engineering Technologists and Technicians:
| Metropolitan area | Employment (1) | Employment per thousand jobs | Location quotient (9) | Hourly mean wage | Annual mean wage (2) |
|---|---|---|---|---|---|
| Los Angeles-Long Beach-Anaheim, CA | 4,860 | 0.85 | 1.18 | $ 33.75 | $ 70,190 |
| San Jose-Sunnyvale-Santa Clara, CA | 3,900 | 3.65 | 5.07 | $ 37.04 | $ 77,030 |
| San Francisco-Oakland-Hayward, CA | 2,920 | 1.30 | 1.81 | $ 35.48 | $ 73,800 |
| New York-Newark-Jersey City, NY-NJ-PA | 2,860 | 0.33 | 0.46 | $ 36.87 | $ 76,690 |
| San Diego-Carlsbad, CA | 2,820 | 2.03 | 2.82 | $ 35.44 | $ 73,720 |
| Dallas-Fort Worth-Arlington, TX | 2,700 | 0.75 | 1.05 | $ 31.30 | $ 65,100 |
| Washington-Arlington-Alexandria, DC-VA-MD-WV | 2,620 | 0.89 | 1.24 | $ 40.32 | $ 83,870 |
| Boston-Cambridge-Nashua, MA-NH | 2,590 | 1.00 | 1.39 | $ 31.66 | $ 65,850 |
| Chicago-Naperville-Elgin, IL-IN-WI | 2,200 | 0.52 | 0.72 | $ 33.78 | $ 70,270 |
| Portland-Vancouver-Hillsboro, OR-WA | 2,070 | 1.84 | 2.56 | $ 31.91 | $ 66,370 |
Metropolitan areas with the highest concentration of jobs and location quotients in Electrical and Electronic Engineering Technologists and Technicians:
| Metropolitan area | Employment (1) | Employment per thousand jobs | Location quotient (9) | Hourly mean wage | Annual mean wage (2) |
|---|---|---|---|---|---|
| California-Lexington Park, MD | 410 | 8.80 | 12.21 | $ 42.56 | $ 88,530 |
| Huntsville, AL | 860 | 3.73 | 5.18 | $ 30.51 | $ 63,460 |
| San Jose-Sunnyvale-Santa Clara, CA | 3,900 | 3.65 | 5.07 | $ 37.04 | $ 77,030 |
| Jackson, MI | 180 | 3.28 | 4.56 | $ 34.19 | $ 71,110 |
| Palm Bay-Melbourne-Titusville, FL | 720 | 3.28 | 4.55 | $ 32.66 | $ 67,930 |
| Crestview-Fort Walton Beach-Destin, FL | 370 | 3.25 | 4.51 | $ 32.14 | $ 66,850 |
| Bremerton-Silverdale, WA | 260 | 3.03 | 4.21 | $ 41.68 | $ 86,700 |
| Las Cruces, NM | 190 | 2.82 | 3.91 | $ 34.09 | $ 70,910 |
| Corvallis, OR | 100 | 2.75 | 3.82 | $ 30.25 | $ 62,910 |
| Binghamton, NY | 220 | 2.39 | 3.32 | $ 25.54 | $ 53,130 |
Top paying metropolitan areas for Electrical and Electronic Engineering Technologists and Technicians:
| Metropolitan area | Employment (1) | Employment per thousand jobs | Location quotient (9) | Hourly mean wage | Annual mean wage (2) |
|---|---|---|---|---|---|
| Fort Collins, CO | 120 | 0.74 | 1.02 | $ 44.22 | $ 91,980 |
| Bakersfield, CA | 560 | 1.81 | 2.52 | $ 43.65 | $ 90,780 |
| Baton Rouge, LA | 450 | 1.21 | 1.69 | $ 42.60 | $ 88,600 |
| California-Lexington Park, MD | 410 | 8.80 | 12.21 | $ 42.56 | $ 88,530 |
| New Bern, NC | 80 | 1.85 | 2.57 | $ 42.49 | $ 88,380 |
| Bremerton-Silverdale, WA | 260 | 3.03 | 4.21 | $ 41.68 | $ 86,700 |
| Oxnard-Thousand Oaks-Ventura, CA | 620 | 2.11 | 2.92 | $ 41.63 | $ 86,590 |
| Napa, CA | 30 | 0.50 | 0.70 | $ 41.12 | $ 85,520 |
| Urban Honolulu, HI | 260 | 0.65 | 0.90 | $ 40.95 | $ 85,170 |
| El Centro, CA | 40 | 0.70 | 0.97 | $ 40.37 | $ 83,970 |
Nonmetropolitan areas with the highest employment in Electrical and Electronic Engineering Technologists and Technicians:
| Nonmetropolitan area | Employment (1) | Employment per thousand jobs | Location quotient (9) | Hourly mean wage | Annual mean wage (2) |
|---|---|---|---|---|---|
| Southern Indiana nonmetropolitan area | 430 | 2.37 | 3.29 | $ 40.90 | $ 85,070 |
| Northeast Mississippi nonmetropolitan area | 320 | 1.46 | 2.02 | $ 20.98 | $ 43,630 |
| Kansas nonmetropolitan area | 320 | 0.85 | 1.18 | $ 30.33 | $ 63,090 |
| Northeast Virginia nonmetropolitan area | 200 | 4.09 | 5.68 | $ 48.02 | $ 99,890 |
| Southeast Coastal North Carolina nonmetropolitan area | 190 | 0.79 | 1.09 | $ 29.54 | $ 61,440 |
Nonmetropolitan areas with the highest concentration of jobs and location quotients in Electrical and Electronic Engineering Technologists and Technicians:
| Nonmetropolitan area | Employment (1) | Employment per thousand jobs | Location quotient (9) | Hourly mean wage | Annual mean wage (2) |
|---|---|---|---|---|---|
| Northeast Virginia nonmetropolitan area | 200 | 4.09 | 5.68 | $ 48.02 | $ 99,890 |
| Southern Indiana nonmetropolitan area | 430 | 2.37 | 3.29 | $ 40.90 | $ 85,070 |
| Northeast Mississippi nonmetropolitan area | 320 | 1.46 | 2.02 | $ 20.98 | $ 43,630 |
| Connecticut nonmetropolitan area | 40 | 1.40 | 1.94 | $ 28.54 | $ 59,370 |
| Northwest Oklahoma nonmetropolitan area | 130 | 1.37 | 1.90 | $ 26.33 | $ 54,770 |
Top paying nonmetropolitan areas for Electrical and Electronic Engineering Technologists and Technicians:
| Nonmetropolitan area | Employment (1) | Employment per thousand jobs | Location quotient (9) | Hourly mean wage | Annual mean wage (2) |
|---|---|---|---|---|---|
| Northeast Virginia nonmetropolitan area | 200 | 4.09 | 5.68 | $ 48.02 | $ 99,890 |
| North Coast Region of California nonmetropolitan area | 40 | 0.38 | 0.52 | $ 41.42 | $ 86,150 |
| Southwest Colorado nonmetropolitan area | 30 | 0.33 | 0.46 | $ 41.21 | $ 85,710 |
| Southern Indiana nonmetropolitan area | 430 | 2.37 | 3.29 | $ 40.90 | $ 85,070 |
| Maryland nonmetropolitan area | 40 | 0.77 | 1.07 | $ 40.45 | $ 84,130 |
These estimates are calculated with data collected from employers in all industry sectors, all metropolitan and nonmetropolitan areas, and all states and the District of Columbia. The top employment and wage figures are provided above. The complete list is available in the downloadable XLS files.
The percentile wage estimate is the value of a wage below which a certain percent of workers fall. The median wage is the 50th percentile wage estimate—50 percent of workers earn less than the median and 50 percent of workers earn more than the median. More about percentile wages.
(1) Estimates for detailed occupations do not sum to the totals because the totals include occupations not shown separately. Estimates do not include self-employed workers.
(2) Annual wages have been calculated by multiplying the hourly mean wage by a "year-round, full-time" hours figure of 2,080 hours; for those occupations where there is not an hourly wage published, the annual wage has been directly calculated from the reported survey data.
(3) The relative standard error (RSE) is a measure of the reliability of a survey statistic. The smaller the relative standard error, the more precise the estimate.
(9) The location quotient is the ratio of the area concentration of occupational employment to the national average concentration. A location quotient greater than one indicates the occupation has a higher share of employment than average, and a location quotient less than one indicates the occupation is less prevalent in the area than average.
Other OEWS estimates and related information:
May 2021 National Occupational Employment and Wage Estimates
May 2021 State Occupational Employment and Wage Estimates
May 2021 Metropolitan and Nonmetropolitan Area Occupational Employment and Wage Estimates
May 2021 National Industry-Specific Occupational Employment and Wage Estimates
Last Modified Date: March 31, 2022