
An official website of the United States government
An official website of the United States government
The .gov means it's official.
Federal government websites often end in .gov or .mil. Before sharing sensitive information,
make sure you're on a federal government site.
The site is secure.
The
https:// ensures that you are connecting to the official website and that any
information you provide is encrypted and transmitted securely.
Operate, test, maintain, or adjust unmanned, automated, servomechanical, or electromechanical equipment. May operate unmanned submarines, aircraft, or other equipment to observe or record visual information at sites such as oil rigs, crop fields, buildings, or for similar infrastructure, deep ocean exploration, or hazardous waste removal. May assist engineers in testing and designing robotics equipment.
Employment estimate and mean wage estimates for Electro-Mechanical and Mechatronics Technologists and Technicians:
| Employment (1) | Employment RSE (3) |
Mean hourly wage |
Mean annual wage (2) |
Wage RSE (3) |
|---|---|---|---|---|
| 11,590 | 4.6 % | $ 30.71 | $ 63,880 | 1.4 % |
Percentile wage estimates for Electro-Mechanical and Mechatronics Technologists and Technicians:
| Percentile | 10% | 25% | 50% (Median) |
75% | 90% |
|---|---|---|---|---|---|
| Hourly Wage | $ 18.10 | $ 22.92 | $ 29.02 | $ 36.98 | $ 47.15 |
| Annual Wage (2) | $ 37,650 | $ 47,680 | $ 60,360 | $ 76,920 | $ 98,070 |
Industries with the highest published employment and wages for Electro-Mechanical and Mechatronics Technologists and Technicians are provided. For a list of all industries with employment in Electro-Mechanical and Mechatronics Technologists and Technicians, see the Create Customized Tables function.
Industries with the highest levels of employment in Electro-Mechanical and Mechatronics Technologists and Technicians:
| Industry | Employment (1) | Percent of industry employment | Hourly mean wage | Annual mean wage (2) |
|---|---|---|---|---|
| Architectural, Engineering, and Related Services | 1,800 | 0.12 | $ 29.26 | $ 60,860 |
| Scientific Research and Development Services | 1,170 | 0.15 | $ 34.12 | $ 70,970 |
| Machinery Manufacturing (3331, 3332, 3334, and 3339 only) | 780 | 0.11 | $ 28.13 | $ 58,510 |
| Navigational, Measuring, Electromedical, and Control Instruments Manufacturing | 670 | 0.17 | $ 30.27 | $ 62,960 |
| Building Equipment Contractors | 370 | 0.02 | $ 22.44 | $ 46,680 |
Industries with the highest concentration of employment in Electro-Mechanical and Mechatronics Technologists and Technicians:
| Industry | Employment (1) | Percent of industry employment | Hourly mean wage | Annual mean wage (2) |
|---|---|---|---|---|
| Engine, Turbine, and Power Transmission Equipment Manufacturing | 200 | 0.23 | $ 34.00 | $ 70,710 |
| Other Electrical Equipment and Component Manufacturing | 290 | 0.21 | $ 27.92 | $ 58,070 |
| Electronic and Precision Equipment Repair and Maintenance | 220 | 0.21 | $ 32.32 | $ 67,220 |
| Navigational, Measuring, Electromedical, and Control Instruments Manufacturing | 670 | 0.17 | $ 30.27 | $ 62,960 |
| Scientific Research and Development Services | 1,170 | 0.15 | $ 34.12 | $ 70,970 |
Top paying industries for Electro-Mechanical and Mechatronics Technologists and Technicians:
| Industry | Employment (1) | Percent of industry employment | Hourly mean wage | Annual mean wage (2) |
|---|---|---|---|---|
| Electric Power Generation, Transmission and Distribution | 240 | 0.06 | $ 56.28 | $ 117,060 |
| Oil and Gas Extraction | (8) | (8) | $ 48.35 | $ 100,560 |
| Computer Systems Design and Related Services | 110 | (7) | $ 44.60 | $ 92,760 |
| Petroleum and Coal Products Manufacturing | 50 | 0.05 | $ 41.94 | $ 87,220 |
| Aerospace Product and Parts Manufacturing | 180 | 0.04 | $ 40.44 | $ 84,120 |
States and areas with the highest published employment, location quotients, and wages for Electro-Mechanical and Mechatronics Technologists and Technicians are provided. For a list of all areas with employment in Electro-Mechanical and Mechatronics Technologists and Technicians, see the Create Customized Tables function.
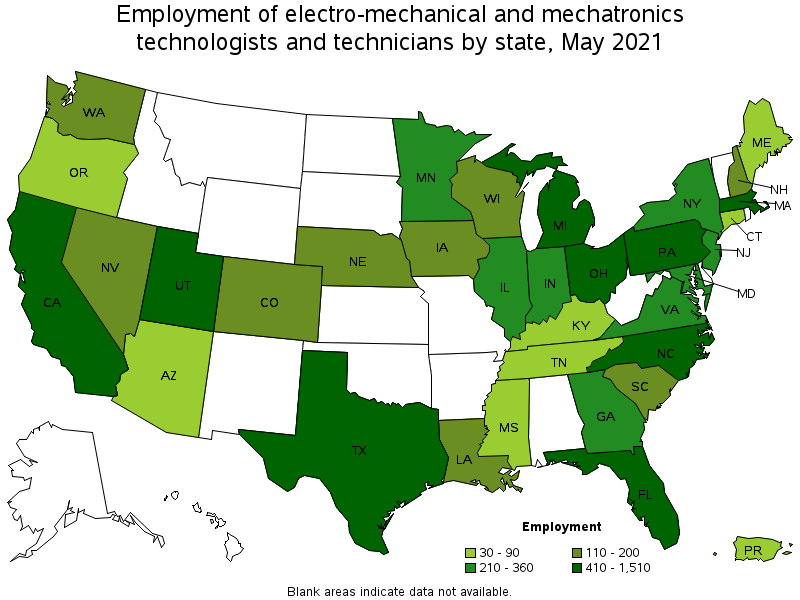
States with the highest employment level in Electro-Mechanical and Mechatronics Technologists and Technicians:
| State | Employment (1) | Employment per thousand jobs | Location quotient (9) | Hourly mean wage | Annual mean wage (2) |
|---|---|---|---|---|---|
| California | 1,510 | 0.09 | 1.11 | $ 30.54 | $ 63,530 |
| Massachusetts | 980 | 0.29 | 3.51 | $ 28.45 | $ 59,170 |
| Texas | 960 | 0.08 | 0.95 | $ 33.49 | $ 69,650 |
| Michigan | 950 | 0.23 | 2.85 | $ 29.14 | $ 60,600 |
| Pennsylvania | 730 | 0.13 | 1.58 | $ 27.33 | $ 56,840 |
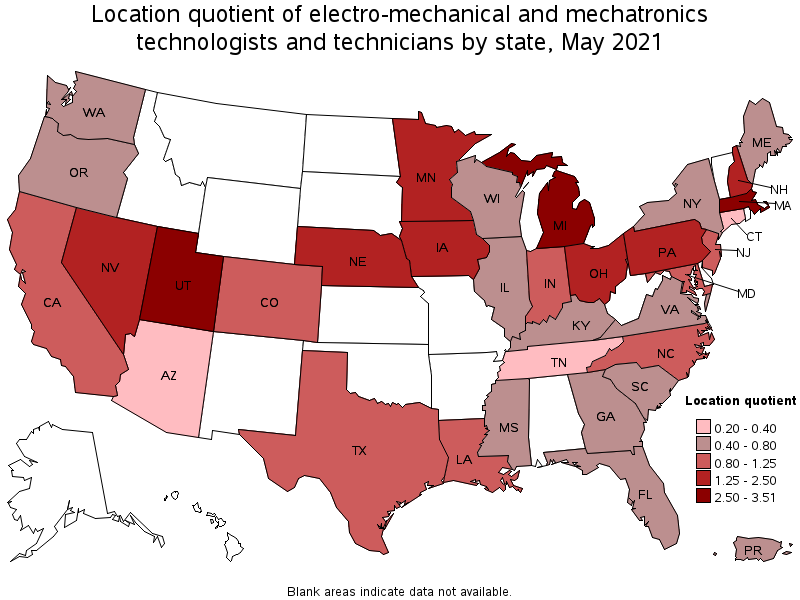
States with the highest concentration of jobs and location quotients in Electro-Mechanical and Mechatronics Technologists and Technicians:
| State | Employment (1) | Employment per thousand jobs | Location quotient (9) | Hourly mean wage | Annual mean wage (2) |
|---|---|---|---|---|---|
| Massachusetts | 980 | 0.29 | 3.51 | $ 28.45 | $ 59,170 |
| Utah | 410 | 0.26 | 3.17 | $ 23.11 | $ 48,060 |
| Michigan | 950 | 0.23 | 2.85 | $ 29.14 | $ 60,600 |
| New Hampshire | 110 | 0.17 | 2.02 | $ 33.15 | $ 68,950 |
| Nevada | 200 | 0.15 | 1.85 | $ 34.76 | $ 72,310 |
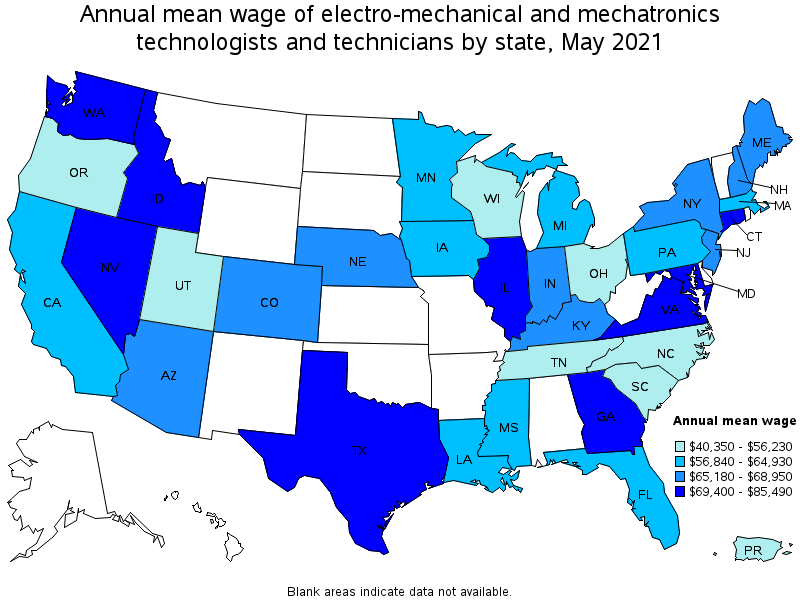
Top paying states for Electro-Mechanical and Mechatronics Technologists and Technicians:
| State | Employment (1) | Employment per thousand jobs | Location quotient (9) | Hourly mean wage | Annual mean wage (2) |
|---|---|---|---|---|---|
| Georgia | 210 | 0.05 | 0.59 | $ 41.10 | $ 85,490 |
| Idaho | (8) | (8) | (8) | $ 40.18 | $ 83,580 |
| Illinois | 310 | 0.06 | 0.68 | $ 39.39 | $ 81,930 |
| Virginia | 210 | 0.06 | 0.68 | $ 36.40 | $ 75,710 |
| Washington | 200 | 0.06 | 0.77 | $ 35.89 | $ 74,640 |
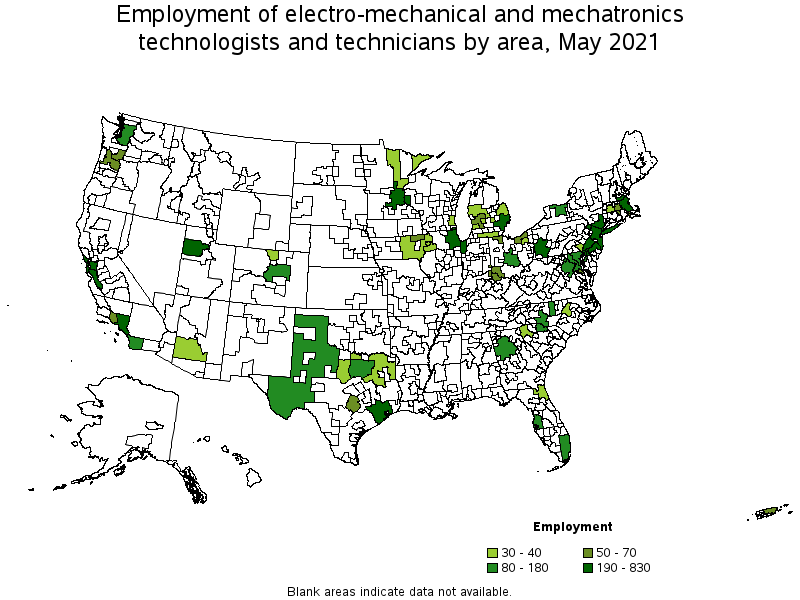
Metropolitan areas with the highest employment level in Electro-Mechanical and Mechatronics Technologists and Technicians:
| Metropolitan area | Employment (1) | Employment per thousand jobs | Location quotient (9) | Hourly mean wage | Annual mean wage (2) |
|---|---|---|---|---|---|
| Boston-Cambridge-Nashua, MA-NH | 830 | 0.32 | 3.92 | $ 28.86 | $ 60,030 |
| Detroit-Warren-Dearborn, MI | 720 | 0.40 | 4.85 | $ 27.97 | $ 58,170 |
| Los Angeles-Long Beach-Anaheim, CA | 540 | 0.09 | 1.15 | $ 31.76 | $ 66,060 |
| Houston-The Woodlands-Sugar Land, TX | 380 | 0.13 | 1.61 | $ 32.02 | $ 66,600 |
| San Francisco-Oakland-Hayward, CA | 280 | 0.12 | 1.49 | $ 28.13 | $ 58,510 |
| Pittsburgh, PA | 270 | 0.26 | 3.20 | $ 26.28 | $ 54,660 |
| New York-Newark-Jersey City, NY-NJ-PA | 270 | 0.03 | 0.38 | $ 34.13 | $ 70,990 |
| Chicago-Naperville-Elgin, IL-IN-WI | 240 | 0.06 | 0.70 | $ 42.27 | $ 87,920 |
| Salt Lake City, UT | 210 | 0.29 | 3.48 | $ 26.21 | $ 54,510 |
| Philadelphia-Camden-Wilmington, PA-NJ-DE-MD | 210 | 0.08 | 0.96 | $ 27.69 | $ 57,590 |
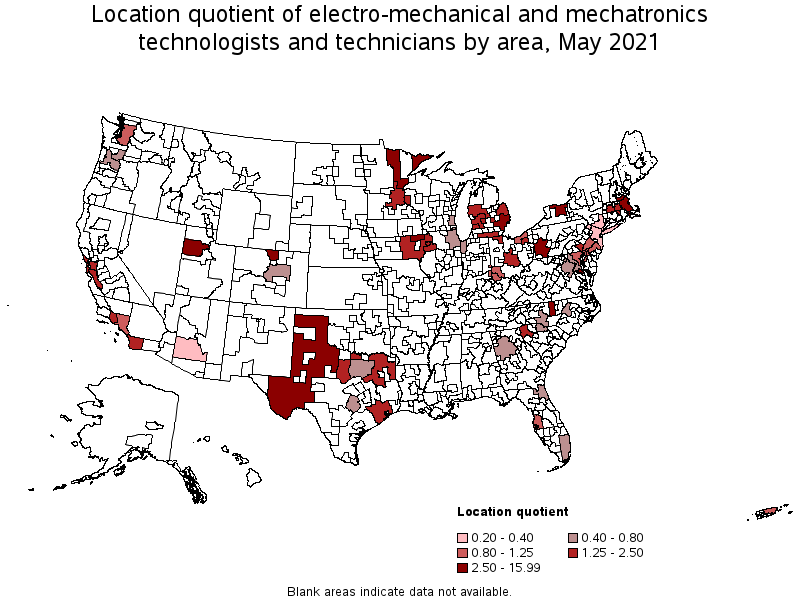
Metropolitan areas with the highest concentration of jobs and location quotients in Electro-Mechanical and Mechatronics Technologists and Technicians:
| Metropolitan area | Employment (1) | Employment per thousand jobs | Location quotient (9) | Hourly mean wage | Annual mean wage (2) |
|---|---|---|---|---|---|
| California-Lexington Park, MD | 60 | 1.32 | 15.99 | $ 34.18 | $ 71,100 |
| New Bedford, MA | 50 | 0.88 | 10.72 | (8) | (8) |
| Detroit-Warren-Dearborn, MI | 720 | 0.40 | 4.85 | $ 27.97 | $ 58,170 |
| Rochester, NY | 180 | 0.38 | 4.65 | $ 30.00 | $ 62,390 |
| Cedar Rapids, IA | 50 | 0.37 | 4.52 | $ 29.91 | $ 62,210 |
| Boston-Cambridge-Nashua, MA-NH | 830 | 0.32 | 3.92 | $ 28.86 | $ 60,030 |
| Salt Lake City, UT | 210 | 0.29 | 3.48 | $ 26.21 | $ 54,510 |
| Pittsburgh, PA | 270 | 0.26 | 3.20 | $ 26.28 | $ 54,660 |
| Greensboro-High Point, NC | 80 | 0.24 | 2.88 | $ 27.22 | $ 56,610 |
| Fort Collins, CO | 30 | 0.21 | 2.55 | $ 33.31 | $ 69,280 |
Top paying metropolitan areas for Electro-Mechanical and Mechatronics Technologists and Technicians:
| Metropolitan area | Employment (1) | Employment per thousand jobs | Location quotient (9) | Hourly mean wage | Annual mean wage (2) |
|---|---|---|---|---|---|
| Washington-Arlington-Alexandria, DC-VA-MD-WV | 110 | 0.04 | 0.44 | $ 47.94 | $ 99,720 |
| Midland, TX | (8) | (8) | (8) | $ 47.14 | $ 98,040 |
| Chicago-Naperville-Elgin, IL-IN-WI | 240 | 0.06 | 0.70 | $ 42.27 | $ 87,920 |
| Baltimore-Columbia-Towson, MD | 90 | 0.07 | 0.84 | $ 38.45 | $ 79,970 |
| Seattle-Tacoma-Bellevue, WA | 180 | 0.10 | 1.17 | $ 36.09 | $ 75,080 |
| Dallas-Fort Worth-Arlington, TX | 180 | 0.05 | 0.60 | $ 34.79 | $ 72,360 |
| California-Lexington Park, MD | 60 | 1.32 | 15.99 | $ 34.18 | $ 71,100 |
| New York-Newark-Jersey City, NY-NJ-PA | 270 | 0.03 | 0.38 | $ 34.13 | $ 70,990 |
| San Jose-Sunnyvale-Santa Clara, CA | 200 | 0.19 | 2.31 | $ 33.57 | $ 69,830 |
| Fort Collins, CO | 30 | 0.21 | 2.55 | $ 33.31 | $ 69,280 |
Nonmetropolitan areas with the highest employment in Electro-Mechanical and Mechatronics Technologists and Technicians:
| Nonmetropolitan area | Employment (1) | Employment per thousand jobs | Location quotient (9) | Hourly mean wage | Annual mean wage (2) |
|---|---|---|---|---|---|
| West Texas Region of Texas nonmetropolitan area | 80 | 0.41 | 4.98 | $ 47.78 | $ 99,380 |
| Balance of Lower Peninsula of Michigan nonmetropolitan area | 40 | 0.17 | 2.01 | $ 27.55 | $ 57,310 |
| Northeast Minnesota nonmetropolitan area | 40 | 0.95 | 11.58 | $ 31.11 | $ 64,710 |
| North Texas Region of Texas nonmetropolitan area | 40 | 0.15 | 1.78 | $ 23.05 | $ 47,940 |
| Southeast Iowa nonmetropolitan area | 40 | 0.18 | 2.19 | $ 27.32 | $ 56,830 |
Nonmetropolitan areas with the highest concentration of jobs and location quotients in Electro-Mechanical and Mechatronics Technologists and Technicians:
| Nonmetropolitan area | Employment (1) | Employment per thousand jobs | Location quotient (9) | Hourly mean wage | Annual mean wage (2) |
|---|---|---|---|---|---|
| Northeast Minnesota nonmetropolitan area | 40 | 0.95 | 11.58 | $ 31.11 | $ 64,710 |
| West Texas Region of Texas nonmetropolitan area | 80 | 0.41 | 4.98 | $ 47.78 | $ 99,380 |
| Southeast Iowa nonmetropolitan area | 40 | 0.18 | 2.19 | $ 27.32 | $ 56,830 |
| Balance of Lower Peninsula of Michigan nonmetropolitan area | 40 | 0.17 | 2.01 | $ 27.55 | $ 57,310 |
| North Texas Region of Texas nonmetropolitan area | 40 | 0.15 | 1.78 | $ 23.05 | $ 47,940 |
Top paying nonmetropolitan areas for Electro-Mechanical and Mechatronics Technologists and Technicians:
| Nonmetropolitan area | Employment (1) | Employment per thousand jobs | Location quotient (9) | Hourly mean wage | Annual mean wage (2) |
|---|---|---|---|---|---|
| West Texas Region of Texas nonmetropolitan area | 80 | 0.41 | 4.98 | $ 47.78 | $ 99,380 |
| Northeast Minnesota nonmetropolitan area | 40 | 0.95 | 11.58 | $ 31.11 | $ 64,710 |
| Central Kentucky nonmetropolitan area | (8) | (8) | (8) | $ 29.34 | $ 61,030 |
| Balance of Lower Peninsula of Michigan nonmetropolitan area | 40 | 0.17 | 2.01 | $ 27.55 | $ 57,310 |
| Southeast Iowa nonmetropolitan area | 40 | 0.18 | 2.19 | $ 27.32 | $ 56,830 |
These estimates are calculated with data collected from employers in all industry sectors, all metropolitan and nonmetropolitan areas, and all states and the District of Columbia. The top employment and wage figures are provided above. The complete list is available in the downloadable XLS files.
The percentile wage estimate is the value of a wage below which a certain percent of workers fall. The median wage is the 50th percentile wage estimate—50 percent of workers earn less than the median and 50 percent of workers earn more than the median. More about percentile wages.
(1) Estimates for detailed occupations do not sum to the totals because the totals include occupations not shown separately. Estimates do not include self-employed workers.
(2) Annual wages have been calculated by multiplying the hourly mean wage by a "year-round, full-time" hours figure of 2,080 hours; for those occupations where there is not an hourly wage published, the annual wage has been directly calculated from the reported survey data.
(3) The relative standard error (RSE) is a measure of the reliability of a survey statistic. The smaller the relative standard error, the more precise the estimate.
(7) The value is less than .005 percent of industry employment.
(8) Estimate not released.
(9) The location quotient is the ratio of the area concentration of occupational employment to the national average concentration. A location quotient greater than one indicates the occupation has a higher share of employment than average, and a location quotient less than one indicates the occupation is less prevalent in the area than average.
Other OEWS estimates and related information:
May 2021 National Occupational Employment and Wage Estimates
May 2021 State Occupational Employment and Wage Estimates
May 2021 Metropolitan and Nonmetropolitan Area Occupational Employment and Wage Estimates
May 2021 National Industry-Specific Occupational Employment and Wage Estimates
Last Modified Date: March 31, 2022