
An official website of the United States government
An official website of the United States government
The .gov means it's official.
Federal government websites often end in .gov or .mil. Before sharing sensitive information,
make sure you're on a federal government site.
The site is secure.
The
https:// ensures that you are connecting to the official website and that any
information you provide is encrypted and transmitted securely.
Perform surveying and mapping duties, usually under the direction of an engineer, surveyor, cartographer, or photogrammetrist, to obtain data used for construction, mapmaking, boundary location, mining, or other purposes. May calculate mapmaking information and create maps from source data, such as surveying notes, aerial photography, satellite data, or other maps to show topographical features, political boundaries, and other features. May verify accuracy and completeness of maps. Excludes �Cartographers and Photogrammetrists� (17-1021), �Surveyors" (17-1022), and �Geoscientists, Except Hydrologists and Geographers� (19-2042).
Employment estimate and mean wage estimates for Surveying and Mapping Technicians:
| Employment (1) | Employment RSE (3) |
Mean hourly wage |
Mean annual wage (2) |
Wage RSE (3) |
|---|---|---|---|---|
| 56,070 | 2.7 % | $ 23.95 | $ 49,810 | 0.9 % |
Percentile wage estimates for Surveying and Mapping Technicians:
| Percentile | 10% | 25% | 50% (Median) |
75% | 90% |
|---|---|---|---|---|---|
| Hourly Wage | $ 14.31 | $ 17.77 | $ 22.55 | $ 28.75 | $ 36.60 |
| Annual Wage (2) | $ 29,770 | $ 36,960 | $ 46,910 | $ 59,790 | $ 76,130 |
Industries with the highest published employment and wages for Surveying and Mapping Technicians are provided. For a list of all industries with employment in Surveying and Mapping Technicians, see the Create Customized Tables function.
Industries with the highest levels of employment in Surveying and Mapping Technicians:
| Industry | Employment (1) | Percent of industry employment | Hourly mean wage | Annual mean wage (2) |
|---|---|---|---|---|
| Architectural, Engineering, and Related Services | 35,720 | 2.36 | $ 22.48 | $ 46,760 |
| Local Government, excluding schools and hospitals (OEWS Designation) | 6,130 | 0.11 | $ 27.09 | $ 56,340 |
| Other Support Services | 2,900 | 1.03 | $ 19.84 | $ 41,270 |
| Electric Power Generation, Transmission and Distribution | 1,940 | 0.52 | $ 32.65 | $ 67,910 |
| Computer Systems Design and Related Services | 950 | 0.04 | $ 27.47 | $ 57,140 |
Industries with the highest concentration of employment in Surveying and Mapping Technicians:
| Industry | Employment (1) | Percent of industry employment | Hourly mean wage | Annual mean wage (2) |
|---|---|---|---|---|
| Architectural, Engineering, and Related Services | 35,720 | 2.36 | $ 22.48 | $ 46,760 |
| Other Support Services | 2,900 | 1.03 | $ 19.84 | $ 41,270 |
| Electric Power Generation, Transmission and Distribution | 1,940 | 0.52 | $ 32.65 | $ 67,910 |
| Natural Gas Distribution | 480 | 0.44 | $ 35.45 | $ 73,730 |
| Support Activities for Mining | 540 | 0.25 | $ 22.87 | $ 47,570 |
Top paying industries for Surveying and Mapping Technicians:
| Industry | Employment (1) | Percent of industry employment | Hourly mean wage | Annual mean wage (2) |
|---|---|---|---|---|
| Oil and Gas Extraction | 130 | 0.13 | $ 36.79 | $ 76,520 |
| Natural Gas Distribution | 480 | 0.44 | $ 35.45 | $ 73,730 |
| Other Pipeline Transportation | (8) | (8) | $ 35.33 | $ 73,480 |
| Management of Companies and Enterprises | 540 | 0.02 | $ 35.31 | $ 73,450 |
| Pipeline Transportation of Natural Gas | 60 | 0.21 | $ 34.29 | $ 71,330 |
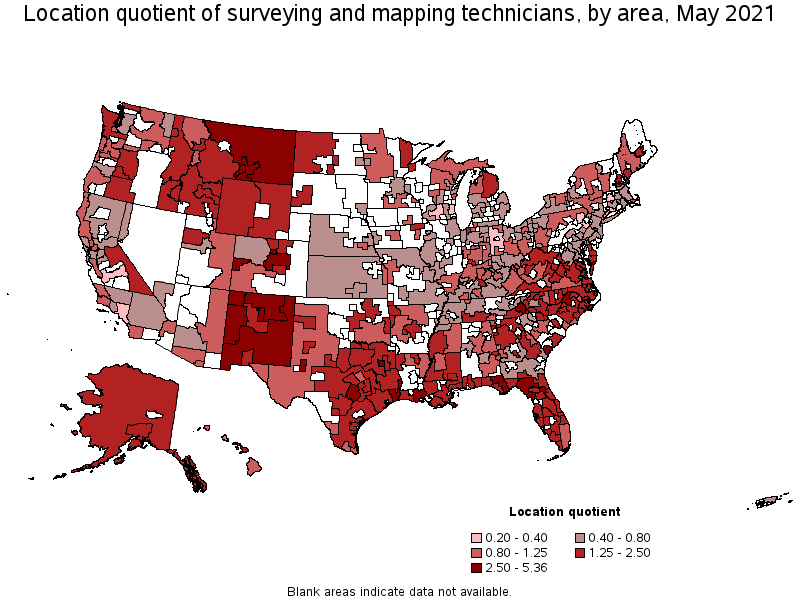
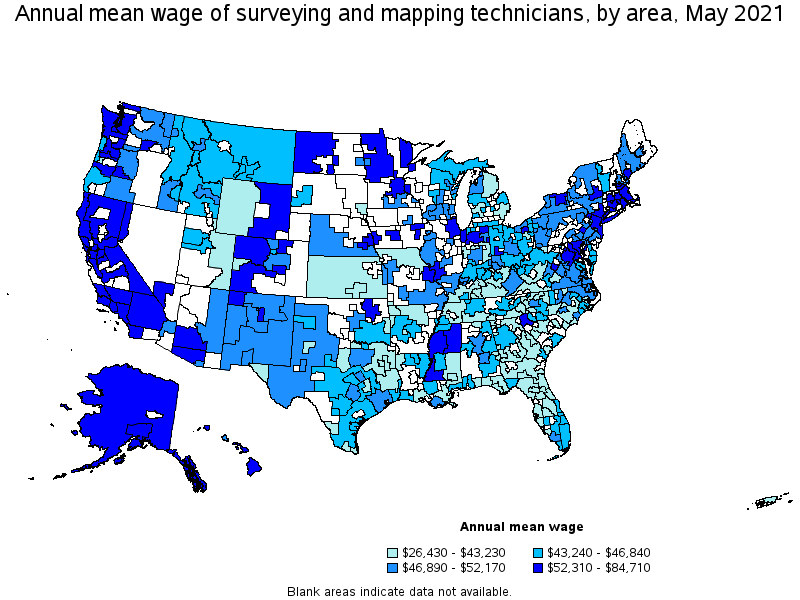
States and areas with the highest published employment, location quotients, and wages for Surveying and Mapping Technicians are provided. For a list of all areas with employment in Surveying and Mapping Technicians, see the Create Customized Tables function.
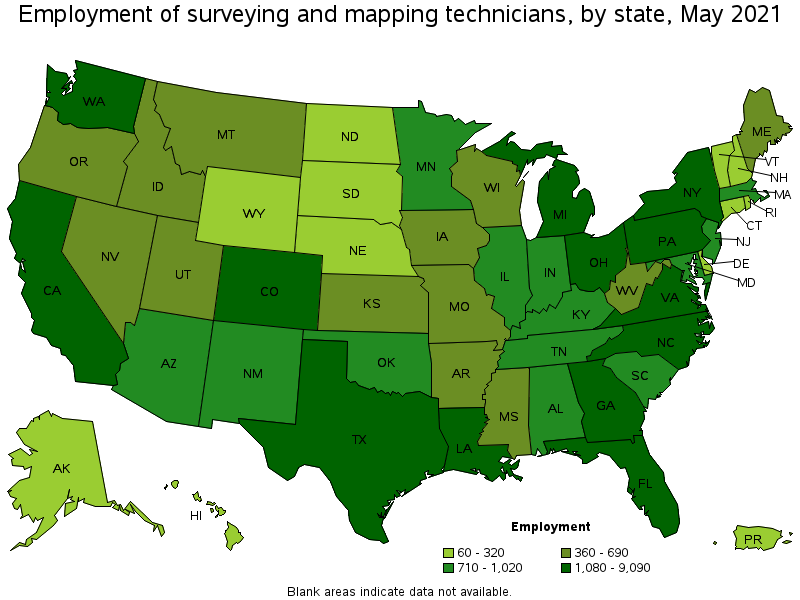
States with the highest employment level in Surveying and Mapping Technicians:
| State | Employment (1) | Employment per thousand jobs | Location quotient (9) | Hourly mean wage | Annual mean wage (2) |
|---|---|---|---|---|---|
| Texas | 9,090 | 0.74 | 1.87 | $ 22.52 | $ 46,840 |
| Florida | 4,870 | 0.57 | 1.42 | $ 20.52 | $ 42,690 |
| North Carolina | 3,650 | 0.83 | 2.08 | $ 21.86 | $ 45,460 |
| California | 3,560 | 0.22 | 0.54 | $ 34.47 | $ 71,700 |
| Colorado | 2,630 | 1.00 | 2.52 | $ 23.11 | $ 48,080 |
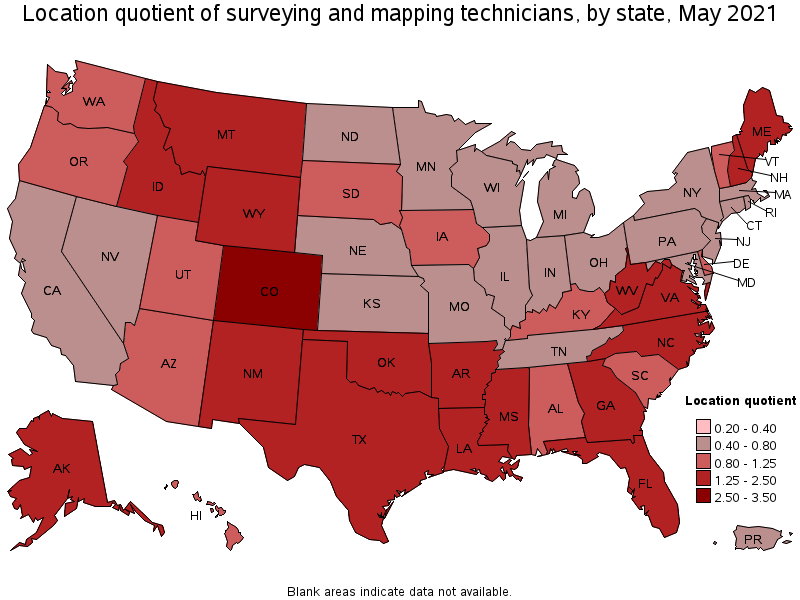
States with the highest concentration of jobs and location quotients in Surveying and Mapping Technicians:
| State | Employment (1) | Employment per thousand jobs | Location quotient (9) | Hourly mean wage | Annual mean wage (2) |
|---|---|---|---|---|---|
| Colorado | 2,630 | 1.00 | 2.52 | $ 23.11 | $ 48,080 |
| New Mexico | 760 | 0.98 | 2.46 | $ 24.29 | $ 50,520 |
| Montana | 430 | 0.92 | 2.31 | $ 21.65 | $ 45,020 |
| North Carolina | 3,650 | 0.83 | 2.08 | $ 21.86 | $ 45,460 |
| Louisiana | 1,440 | 0.80 | 2.01 | $ 20.36 | $ 42,340 |
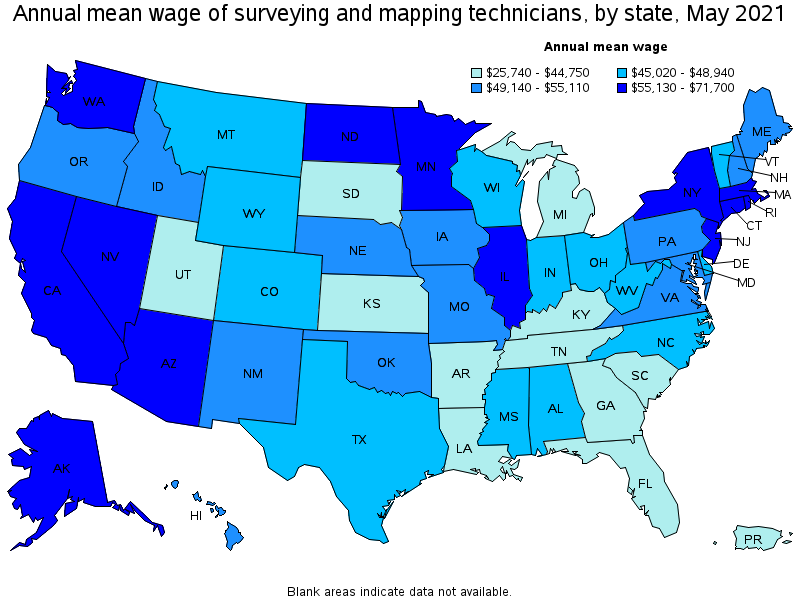
Top paying states for Surveying and Mapping Technicians:
| State | Employment (1) | Employment per thousand jobs | Location quotient (9) | Hourly mean wage | Annual mean wage (2) |
|---|---|---|---|---|---|
| California | 3,560 | 0.22 | 0.54 | $ 34.47 | $ 71,700 |
| Rhode Island | 90 | 0.19 | 0.47 | $ 34.39 | $ 71,540 |
| Alaska | 190 | 0.66 | 1.65 | $ 33.57 | $ 69,820 |
| Connecticut | 250 | 0.16 | 0.40 | $ 29.27 | $ 60,870 |
| Massachusetts | 760 | 0.22 | 0.56 | $ 29.24 | $ 60,820 |
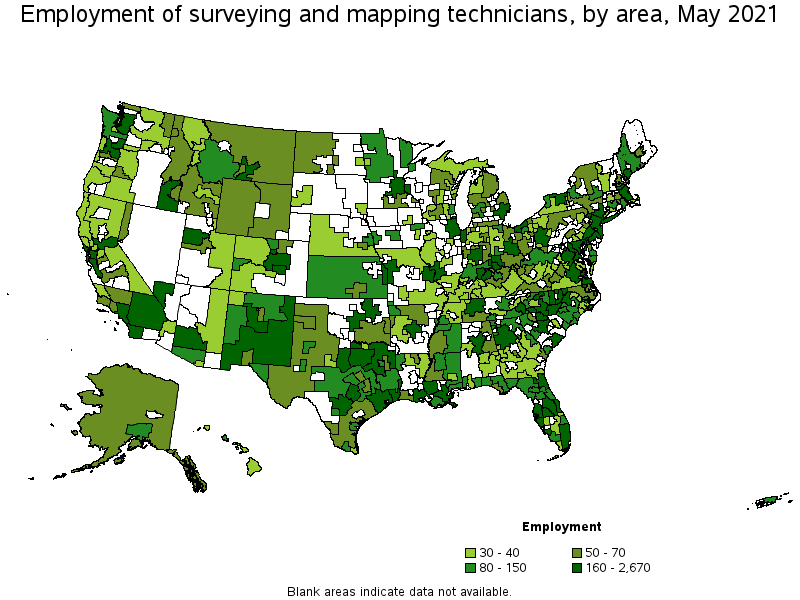
Metropolitan areas with the highest employment level in Surveying and Mapping Technicians:
| Metropolitan area | Employment (1) | Employment per thousand jobs | Location quotient (9) | Hourly mean wage | Annual mean wage (2) |
|---|---|---|---|---|---|
| Houston-The Woodlands-Sugar Land, TX | 2,670 | 0.92 | 2.32 | $ 23.38 | $ 48,640 |
| Dallas-Fort Worth-Arlington, TX | 2,330 | 0.65 | 1.63 | $ 23.30 | $ 48,450 |
| Denver-Aurora-Lakewood, CO | 1,750 | 1.19 | 2.99 | $ 22.97 | $ 47,770 |
| Atlanta-Sandy Springs-Roswell, GA | 1,570 | 0.61 | 1.52 | $ 22.38 | $ 46,540 |
| New York-Newark-Jersey City, NY-NJ-PA | 1,430 | 0.16 | 0.41 | $ 29.95 | $ 62,300 |
| Austin-Round Rock, TX | 1,120 | 1.05 | 2.63 | $ 23.01 | $ 47,850 |
| Charlotte-Concord-Gastonia, NC-SC | 1,070 | 0.88 | 2.21 | $ 21.97 | $ 45,700 |
| Miami-Fort Lauderdale-West Palm Beach, FL | 1,050 | 0.43 | 1.08 | $ 21.21 | $ 44,110 |
| Raleigh, NC | 950 | 1.50 | 3.78 | $ 22.71 | $ 47,240 |
| Washington-Arlington-Alexandria, DC-VA-MD-WV | 840 | 0.29 | 0.72 | $ 27.58 | $ 57,370 |
Metropolitan areas with the highest concentration of jobs and location quotients in Surveying and Mapping Technicians:
| Metropolitan area | Employment (1) | Employment per thousand jobs | Location quotient (9) | Hourly mean wage | Annual mean wage (2) |
|---|---|---|---|---|---|
| Billings, MT | 180 | 2.13 | 5.36 | $ 20.92 | $ 43,520 |
| Grand Junction, CO | 100 | 1.53 | 3.83 | $ 18.75 | $ 38,990 |
| Raleigh, NC | 950 | 1.50 | 3.78 | $ 22.71 | $ 47,240 |
| Lafayette, LA | 260 | 1.40 | 3.51 | $ 18.47 | $ 38,410 |
| Tyler, TX | 140 | 1.37 | 3.44 | $ 19.01 | $ 39,550 |
| Midland, TX | 120 | 1.31 | 3.28 | $ 22.79 | $ 47,400 |
| Denver-Aurora-Lakewood, CO | 1,750 | 1.19 | 2.99 | $ 22.97 | $ 47,770 |
| Hilton Head Island-Bluffton-Beaufort, SC | 90 | 1.19 | 2.99 | $ 20.00 | $ 41,610 |
| Beaumont-Port Arthur, TX | 170 | 1.16 | 2.92 | $ 21.73 | $ 45,190 |
| Boulder, CO | 200 | 1.08 | 2.70 | $ 22.27 | $ 46,320 |
Top paying metropolitan areas for Surveying and Mapping Technicians:
| Metropolitan area | Employment (1) | Employment per thousand jobs | Location quotient (9) | Hourly mean wage | Annual mean wage (2) |
|---|---|---|---|---|---|
| San Jose-Sunnyvale-Santa Clara, CA | 350 | 0.33 | 0.82 | $ 40.73 | $ 84,710 |
| Los Angeles-Long Beach-Anaheim, CA | 820 | 0.14 | 0.36 | $ 37.42 | $ 77,840 |
| San Francisco-Oakland-Hayward, CA | 480 | 0.21 | 0.54 | $ 37.00 | $ 76,960 |
| Santa Maria-Santa Barbara, CA | 60 | 0.33 | 0.83 | $ 36.37 | $ 75,640 |
| Sacramento--Roseville--Arden-Arcade, CA | 230 | 0.23 | 0.59 | $ 35.35 | $ 73,520 |
| Modesto, CA | 50 | 0.25 | 0.64 | $ 34.80 | $ 72,380 |
| Bakersfield, CA | 60 | 0.21 | 0.52 | $ 33.75 | $ 70,210 |
| Anchorage, AK | 120 | 0.74 | 1.86 | $ 33.60 | $ 69,890 |
| San Diego-Carlsbad, CA | 450 | 0.32 | 0.81 | $ 33.24 | $ 69,150 |
| Barnstable Town, MA | 30 | 0.35 | 0.88 | $ 33.10 | $ 68,850 |
Nonmetropolitan areas with the highest employment in Surveying and Mapping Technicians:
| Nonmetropolitan area | Employment (1) | Employment per thousand jobs | Location quotient (9) | Hourly mean wage | Annual mean wage (2) |
|---|---|---|---|---|---|
| North Texas Region of Texas nonmetropolitan area | 230 | 0.87 | 2.18 | $ 20.39 | $ 42,410 |
| Piedmont North Carolina nonmetropolitan area | 180 | 0.73 | 1.83 | $ 19.57 | $ 40,710 |
| Eastern New Mexico nonmetropolitan area | 160 | 1.08 | 2.71 | $ 24.12 | $ 50,170 |
| Hill Country Region of Texas nonmetropolitan area | 140 | 0.74 | 1.86 | $ 21.63 | $ 44,990 |
| Southeast Coastal North Carolina nonmetropolitan area | 130 | 0.53 | 1.33 | $ 20.62 | $ 42,890 |
Nonmetropolitan areas with the highest concentration of jobs and location quotients in Surveying and Mapping Technicians:
| Nonmetropolitan area | Employment (1) | Employment per thousand jobs | Location quotient (9) | Hourly mean wage | Annual mean wage (2) |
|---|---|---|---|---|---|
| Northern New Mexico nonmetropolitan area | 90 | 1.18 | 2.97 | $ 25.08 | $ 52,170 |
| East-Central Montana nonmetropolitan area | 70 | 1.13 | 2.83 | $ 22.33 | $ 46,450 |
| Eastern New Mexico nonmetropolitan area | 160 | 1.08 | 2.71 | $ 24.12 | $ 50,170 |
| North Florida nonmetropolitan area | 120 | 1.04 | 2.61 | $ 20.45 | $ 42,540 |
| Mountain North Carolina nonmetropolitan area | 120 | 0.97 | 2.44 | $ 18.74 | $ 38,980 |
Top paying nonmetropolitan areas for Surveying and Mapping Technicians:
| Nonmetropolitan area | Employment (1) | Employment per thousand jobs | Location quotient (9) | Hourly mean wage | Annual mean wage (2) |
|---|---|---|---|---|---|
| Alaska nonmetropolitan area | 50 | 0.56 | 1.41 | $ 33.62 | $ 69,930 |
| Northwest Mississippi nonmetropolitan area | 70 | 0.81 | 2.04 | $ 29.25 | $ 60,830 |
| Northwest Colorado nonmetropolitan area | 30 | 0.28 | 0.71 | $ 28.96 | $ 60,240 |
| West North Dakota nonmetropolitan area | 60 | 0.53 | 1.32 | $ 28.20 | $ 58,650 |
| North Coast Region of California nonmetropolitan area | 40 | 0.43 | 1.07 | $ 28.15 | $ 58,540 |
These estimates are calculated with data collected from employers in all industry sectors, all metropolitan and nonmetropolitan areas, and all states and the District of Columbia. The top employment and wage figures are provided above. The complete list is available in the downloadable XLS files.
The percentile wage estimate is the value of a wage below which a certain percent of workers fall. The median wage is the 50th percentile wage estimate—50 percent of workers earn less than the median and 50 percent of workers earn more than the median. More about percentile wages.
(1) Estimates for detailed occupations do not sum to the totals because the totals include occupations not shown separately. Estimates do not include self-employed workers.
(2) Annual wages have been calculated by multiplying the hourly mean wage by a "year-round, full-time" hours figure of 2,080 hours; for those occupations where there is not an hourly wage published, the annual wage has been directly calculated from the reported survey data.
(3) The relative standard error (RSE) is a measure of the reliability of a survey statistic. The smaller the relative standard error, the more precise the estimate.
(8) Estimate not released.
(9) The location quotient is the ratio of the area concentration of occupational employment to the national average concentration. A location quotient greater than one indicates the occupation has a higher share of employment than average, and a location quotient less than one indicates the occupation is less prevalent in the area than average.
Other OEWS estimates and related information:
May 2021 National Occupational Employment and Wage Estimates
May 2021 State Occupational Employment and Wage Estimates
May 2021 Metropolitan and Nonmetropolitan Area Occupational Employment and Wage Estimates
May 2021 National Industry-Specific Occupational Employment and Wage Estimates
Last Modified Date: March 31, 2022