
An official website of the United States government
An official website of the United States government
The .gov means it's official.
Federal government websites often end in .gov or .mil. Before sharing sensitive information,
make sure you're on a federal government site.
The site is secure.
The
https:// ensures that you are connecting to the official website and that any
information you provide is encrypted and transmitted securely.
Use chemistry, microbiology, engineering, and other sciences to study the principles underlying the processing and deterioration of foods; analyze food content to determine levels of vitamins, fat, sugar, and protein; discover new food sources; research ways to make processed foods safe, palatable, and healthful; and apply food science knowledge to determine best ways to process, package, preserve, store, and distribute food.
Employment estimate and mean wage estimates for Food Scientists and Technologists:
| Employment (1) | Employment RSE (3) |
Mean hourly wage |
Mean annual wage (2) |
Wage RSE (3) |
|---|---|---|---|---|
| 13,510 | 4.8 % | $ 40.46 | $ 84,150 | 2.0 % |
Percentile wage estimates for Food Scientists and Technologists:
| Percentile | 10% | 25% | 50% (Median) |
75% | 90% |
|---|---|---|---|---|---|
| Hourly Wage | $ 21.64 | $ 28.91 | $ 37.66 | $ 48.65 | $ 62.76 |
| Annual Wage (2) | $ 45,010 | $ 60,130 | $ 78,340 | $ 101,180 | $ 130,540 |
Industries with the highest published employment and wages for Food Scientists and Technologists are provided. For a list of all industries with employment in Food Scientists and Technologists, see the Create Customized Tables function.
Industries with the highest levels of employment in Food Scientists and Technologists:
| Industry | Employment (1) | Percent of industry employment | Hourly mean wage | Annual mean wage (2) |
|---|---|---|---|---|
| Other Food Manufacturing | 2,130 | 0.91 | $ 42.37 | $ 88,130 |
| Management of Companies and Enterprises | 2,010 | 0.08 | $ 47.62 | $ 99,050 |
| Scientific Research and Development Services | 970 | 0.12 | $ 44.43 | $ 92,410 |
| Dairy Product Manufacturing | 950 | 0.62 | $ 37.14 | $ 77,240 |
| Architectural, Engineering, and Related Services | 860 | 0.06 | $ 33.94 | $ 70,600 |
Industries with the highest concentration of employment in Food Scientists and Technologists:
| Industry | Employment (1) | Percent of industry employment | Hourly mean wage | Annual mean wage (2) |
|---|---|---|---|---|
| Other Food Manufacturing | 2,130 | 0.91 | $ 42.37 | $ 88,130 |
| Grain and Oilseed Milling | 480 | 0.76 | $ 41.26 | $ 85,830 |
| Dairy Product Manufacturing | 950 | 0.62 | $ 37.14 | $ 77,240 |
| Fruit and Vegetable Preserving and Specialty Food Manufacturing | 690 | 0.40 | $ 36.89 | $ 76,730 |
| Animal Food Manufacturing | 260 | 0.38 | $ 40.62 | $ 84,480 |
Top paying industries for Food Scientists and Technologists:
| Industry | Employment (1) | Percent of industry employment | Hourly mean wage | Annual mean wage (2) |
|---|---|---|---|---|
| Merchant Wholesalers, Nondurable Goods (4244 and 4248 only) | 450 | 0.05 | $ 53.17 | $ 110,590 |
| Management, Scientific, and Technical Consulting Services | 520 | 0.03 | $ 52.11 | $ 108,400 |
| Federal Executive Branch (OEWS Designation) | 80 | (7) | $ 51.10 | $ 106,290 |
| Merchant Wholesalers, Nondurable Goods (4242 and 4246 only) | (8) | (8) | $ 49.21 | $ 102,350 |
| Management of Companies and Enterprises | 2,010 | 0.08 | $ 47.62 | $ 99,050 |
States and areas with the highest published employment, location quotients, and wages for Food Scientists and Technologists are provided. For a list of all areas with employment in Food Scientists and Technologists, see the Create Customized Tables function.
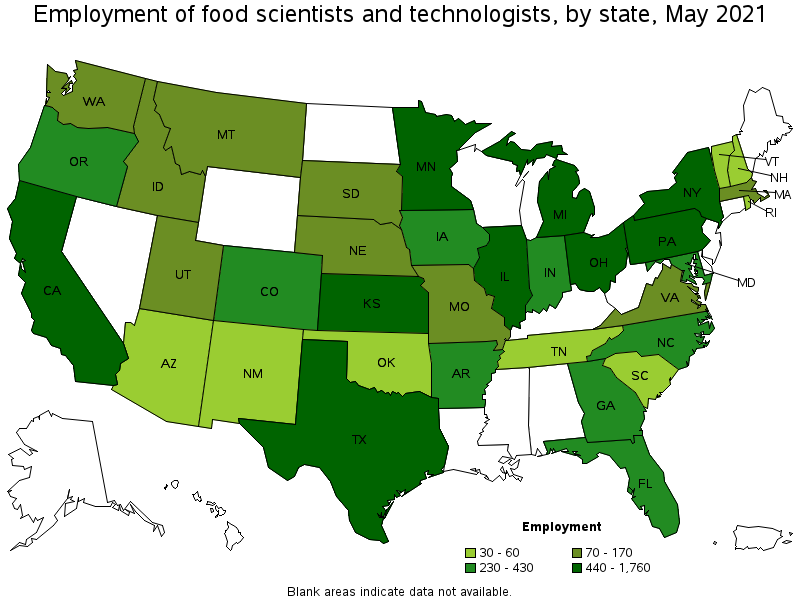
States with the highest employment level in Food Scientists and Technologists:
| State | Employment (1) | Employment per thousand jobs | Location quotient (9) | Hourly mean wage | Annual mean wage (2) |
|---|---|---|---|---|---|
| California | 1,760 | 0.11 | 1.11 | $ 40.10 | $ 83,420 |
| Illinois | 1,100 | 0.20 | 2.05 | $ 45.43 | $ 94,480 |
| Minnesota | 930 | 0.34 | 3.55 | $ 46.24 | $ 96,170 |
| Texas | 830 | 0.07 | 0.71 | $ 39.68 | $ 82,530 |
| New York | 660 | 0.08 | 0.80 | $ 43.90 | $ 91,310 |
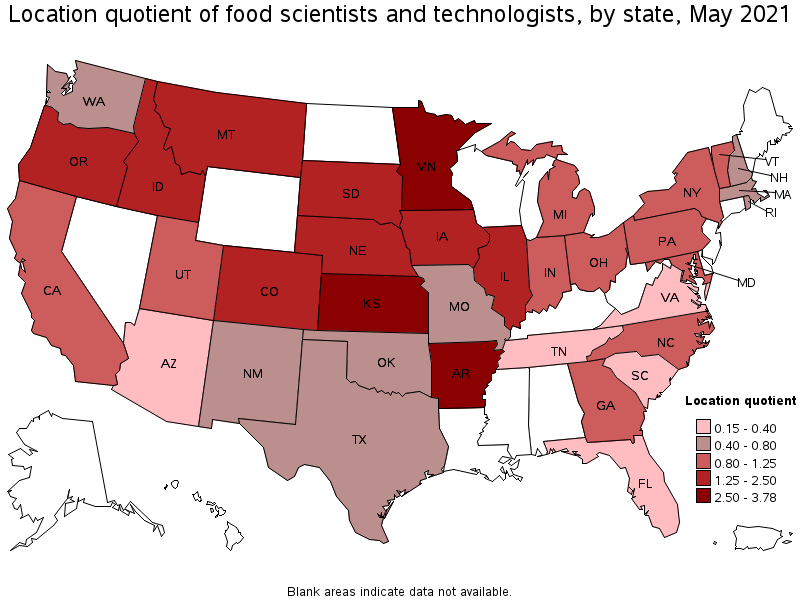
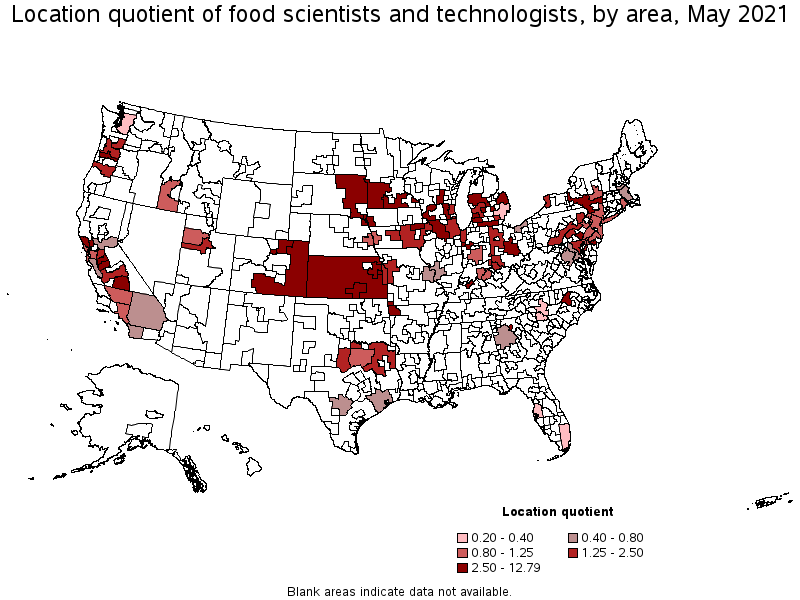
States with the highest concentration of jobs and location quotients in Food Scientists and Technologists:
| State | Employment (1) | Employment per thousand jobs | Location quotient (9) | Hourly mean wage | Annual mean wage (2) |
|---|---|---|---|---|---|
| Kansas | 490 | 0.36 | 3.78 | $ 48.68 | $ 101,250 |
| Minnesota | 930 | 0.34 | 3.55 | $ 46.24 | $ 96,170 |
| Arkansas | 310 | 0.26 | 2.68 | $ 38.94 | $ 81,000 |
| Oregon | 370 | 0.20 | 2.11 | $ 40.37 | $ 83,980 |
| Illinois | 1,100 | 0.20 | 2.05 | $ 45.43 | $ 94,480 |
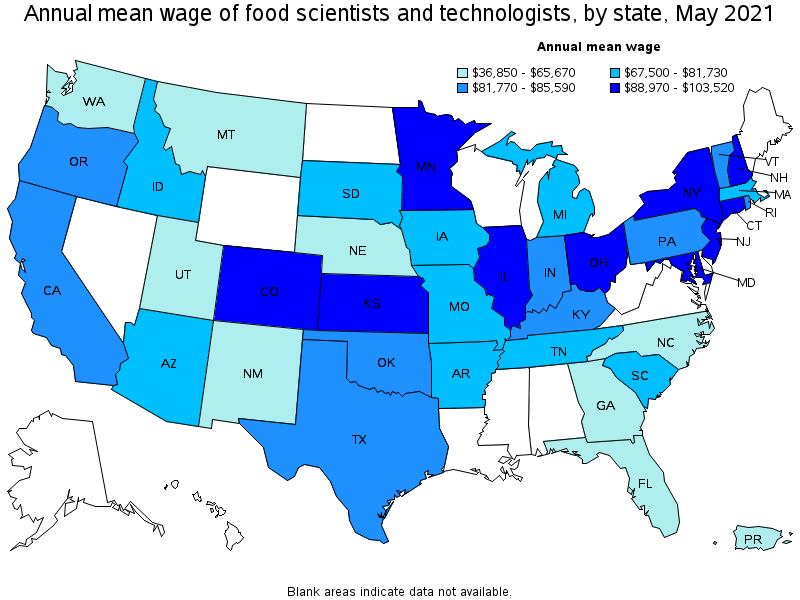
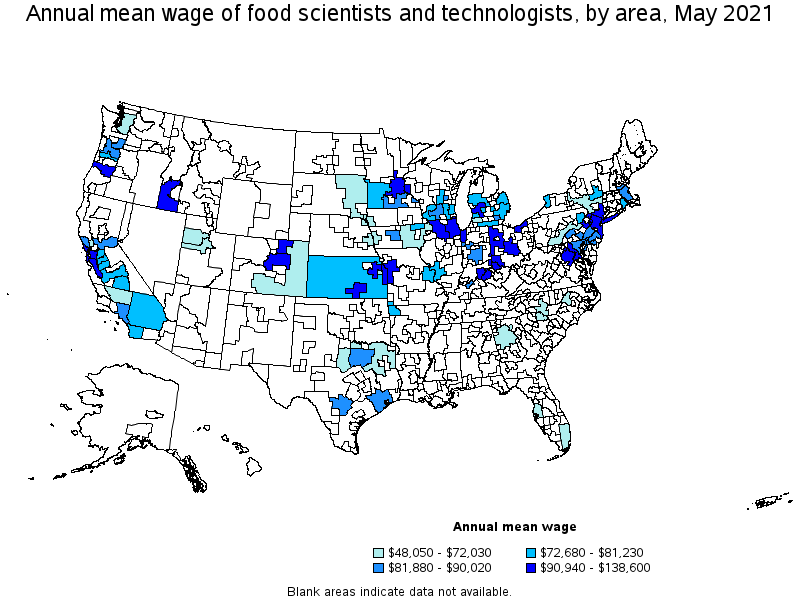
Top paying states for Food Scientists and Technologists:
| State | Employment (1) | Employment per thousand jobs | Location quotient (9) | Hourly mean wage | Annual mean wage (2) |
|---|---|---|---|---|---|
| Colorado | 320 | 0.12 | 1.26 | $ 49.77 | $ 103,520 |
| Kansas | 490 | 0.36 | 3.78 | $ 48.68 | $ 101,250 |
| Connecticut | (8) | (8) | (8) | $ 46.83 | $ 97,410 |
| Ohio | 570 | 0.11 | 1.15 | $ 46.29 | $ 96,280 |
| Minnesota | 930 | 0.34 | 3.55 | $ 46.24 | $ 96,170 |
Metropolitan areas with the highest employment level in Food Scientists and Technologists:
| Metropolitan area | Employment (1) | Employment per thousand jobs | Location quotient (9) | Hourly mean wage | Annual mean wage (2) |
|---|---|---|---|---|---|
| Chicago-Naperville-Elgin, IL-IN-WI | 860 | 0.20 | 2.12 | $ 46.56 | $ 96,850 |
| New York-Newark-Jersey City, NY-NJ-PA | 840 | 0.10 | 1.01 | $ 47.82 | $ 99,470 |
| Los Angeles-Long Beach-Anaheim, CA | 440 | 0.08 | 0.81 | $ 41.94 | $ 87,240 |
| Dallas-Fort Worth-Arlington, TX | 350 | 0.10 | 1.01 | $ 43.28 | $ 90,020 |
| Columbus, OH | 250 | 0.24 | 2.54 | $ 44.01 | $ 91,530 |
| San Francisco-Oakland-Hayward, CA | 240 | 0.11 | 1.10 | $ 49.98 | $ 103,970 |
| Cincinnati, OH-KY-IN | 230 | 0.22 | 2.33 | $ 48.81 | $ 101,530 |
| Philadelphia-Camden-Wilmington, PA-NJ-DE-MD | 220 | 0.08 | 0.86 | $ 41.87 | $ 87,090 |
| Raleigh, NC | 190 | 0.30 | 3.12 | $ 23.10 | $ 48,050 |
| Portland-Vancouver-Hillsboro, OR-WA | 180 | 0.16 | 1.68 | $ 40.28 | $ 83,790 |
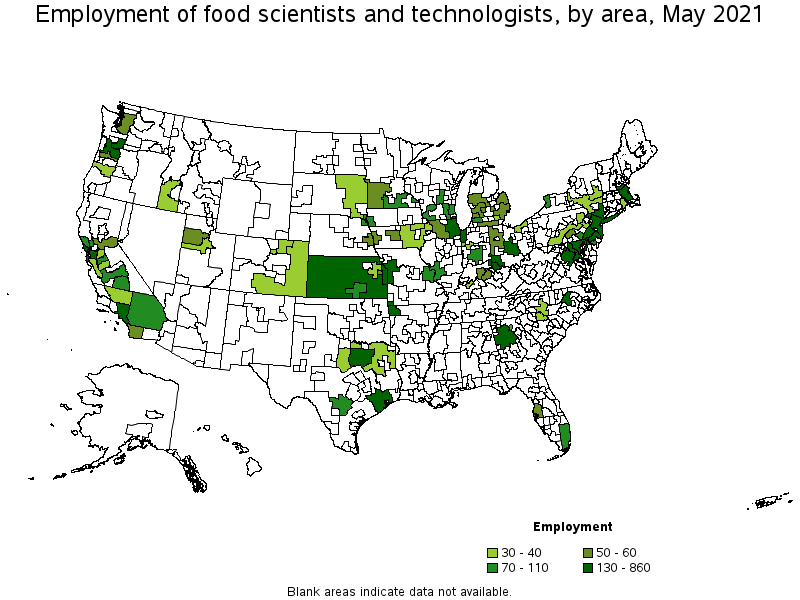
Metropolitan areas with the highest concentration of jobs and location quotients in Food Scientists and Technologists:
| Metropolitan area | Employment (1) | Employment per thousand jobs | Location quotient (9) | Hourly mean wage | Annual mean wage (2) |
|---|---|---|---|---|---|
| Vineland-Bridgeton, NJ | 70 | 1.23 | 12.79 | $ 39.37 | $ 81,880 |
| Napa, CA | 80 | 1.12 | 11.63 | $ 33.05 | $ 68,740 |
| Lawrence, KS | 50 | 1.00 | 10.43 | $ 30.58 | $ 63,600 |
| Sioux City, IA-NE-SD | 80 | 0.90 | 9.37 | $ 32.62 | $ 67,840 |
| Owensboro, KY | 40 | 0.81 | 8.48 | $ 40.40 | $ 84,030 |
| Kalamazoo-Portage, MI | 100 | 0.76 | 7.87 | $ 26.02 | $ 54,110 |
| Fayetteville-Springdale-Rogers, AR-MO | 180 | 0.74 | 7.69 | $ 36.35 | $ 75,610 |
| Merced, CA | 40 | 0.62 | 6.47 | $ 37.45 | $ 77,900 |
| Gainesville, GA | 50 | 0.52 | 5.40 | $ 28.80 | $ 59,900 |
| Modesto, CA | 90 | 0.48 | 5.02 | $ 38.06 | $ 79,160 |
Top paying metropolitan areas for Food Scientists and Technologists:
| Metropolitan area | Employment (1) | Employment per thousand jobs | Location quotient (9) | Hourly mean wage | Annual mean wage (2) |
|---|---|---|---|---|---|
| Kansas City, MO-KS | 170 | 0.16 | 1.70 | $ 66.64 | $ 138,600 |
| San Francisco-Oakland-Hayward, CA | 240 | 0.11 | 1.10 | $ 49.98 | $ 103,970 |
| Wichita, KS | 90 | 0.30 | 3.16 | $ 49.09 | $ 102,100 |
| Minneapolis-St. Paul-Bloomington, MN-WI | (8) | (8) | (8) | $ 48.95 | $ 101,820 |
| Cleveland-Elyria, OH | 40 | 0.04 | 0.44 | $ 48.92 | $ 101,750 |
| Cincinnati, OH-KY-IN | 230 | 0.22 | 2.33 | $ 48.81 | $ 101,530 |
| New York-Newark-Jersey City, NY-NJ-PA | 840 | 0.10 | 1.01 | $ 47.82 | $ 99,470 |
| Greeley, CO | 30 | 0.31 | 3.18 | $ 47.61 | $ 99,040 |
| Boise City, ID | 40 | 0.12 | 1.20 | $ 47.14 | $ 98,050 |
| Chicago-Naperville-Elgin, IL-IN-WI | 860 | 0.20 | 2.12 | $ 46.56 | $ 96,850 |
Nonmetropolitan areas with the highest employment in Food Scientists and Technologists:
| Nonmetropolitan area | Employment (1) | Employment per thousand jobs | Location quotient (9) | Hourly mean wage | Annual mean wage (2) |
|---|---|---|---|---|---|
| Kansas nonmetropolitan area | 130 | 0.34 | 3.54 | $ 35.81 | $ 74,480 |
| Southeast Minnesota nonmetropolitan area | 100 | 0.66 | 6.87 | $ 42.59 | $ 88,580 |
| South Central Wisconsin nonmetropolitan area | 90 | 0.44 | 4.57 | $ 38.95 | $ 81,010 |
| Balance of Lower Peninsula of Michigan nonmetropolitan area | 60 | 0.26 | 2.66 | $ 34.94 | $ 72,680 |
| Northwest Illinois nonmetropolitan area | 60 | 0.49 | 5.14 | $ 48.40 | $ 100,660 |
Nonmetropolitan areas with the highest concentration of jobs and location quotients in Food Scientists and Technologists:
| Nonmetropolitan area | Employment (1) | Employment per thousand jobs | Location quotient (9) | Hourly mean wage | Annual mean wage (2) |
|---|---|---|---|---|---|
| Southeast Minnesota nonmetropolitan area | 100 | 0.66 | 6.87 | $ 42.59 | $ 88,580 |
| Eastern and Southern Colorado nonmetropolitan area | 40 | 0.53 | 5.52 | $ 30.13 | $ 62,660 |
| Northwest Illinois nonmetropolitan area | 60 | 0.49 | 5.14 | $ 48.40 | $ 100,660 |
| Southwest Minnesota nonmetropolitan area | 50 | 0.45 | 4.72 | $ 37.50 | $ 78,010 |
| South Central Wisconsin nonmetropolitan area | 90 | 0.44 | 4.57 | $ 38.95 | $ 81,010 |
Top paying nonmetropolitan areas for Food Scientists and Technologists:
| Nonmetropolitan area | Employment (1) | Employment per thousand jobs | Location quotient (9) | Hourly mean wage | Annual mean wage (2) |
|---|---|---|---|---|---|
| West Northwestern Ohio nonmetropolitan area | 50 | 0.23 | 2.35 | $ 49.54 | $ 103,030 |
| Northwest Illinois nonmetropolitan area | 60 | 0.49 | 5.14 | $ 48.40 | $ 100,660 |
| Southeast Minnesota nonmetropolitan area | 100 | 0.66 | 6.87 | $ 42.59 | $ 88,580 |
| South Central Wisconsin nonmetropolitan area | 90 | 0.44 | 4.57 | $ 38.95 | $ 81,010 |
| Southwest Minnesota nonmetropolitan area | 50 | 0.45 | 4.72 | $ 37.50 | $ 78,010 |
These estimates are calculated with data collected from employers in all industry sectors, all metropolitan and nonmetropolitan areas, and all states and the District of Columbia. The top employment and wage figures are provided above. The complete list is available in the downloadable XLS files.
The percentile wage estimate is the value of a wage below which a certain percent of workers fall. The median wage is the 50th percentile wage estimate—50 percent of workers earn less than the median and 50 percent of workers earn more than the median. More about percentile wages.
(1) Estimates for detailed occupations do not sum to the totals because the totals include occupations not shown separately. Estimates do not include self-employed workers.
(2) Annual wages have been calculated by multiplying the hourly mean wage by a "year-round, full-time" hours figure of 2,080 hours; for those occupations where there is not an hourly wage published, the annual wage has been directly calculated from the reported survey data.
(3) The relative standard error (RSE) is a measure of the reliability of a survey statistic. The smaller the relative standard error, the more precise the estimate.
(7) The value is less than .005 percent of industry employment.
(8) Estimate not released.
(9) The location quotient is the ratio of the area concentration of occupational employment to the national average concentration. A location quotient greater than one indicates the occupation has a higher share of employment than average, and a location quotient less than one indicates the occupation is less prevalent in the area than average.
Other OEWS estimates and related information:
May 2021 National Occupational Employment and Wage Estimates
May 2021 State Occupational Employment and Wage Estimates
May 2021 Metropolitan and Nonmetropolitan Area Occupational Employment and Wage Estimates
May 2021 National Industry-Specific Occupational Employment and Wage Estimates
Last Modified Date: March 31, 2022