
An official website of the United States government
An official website of the United States government
The .gov means it's official.
Federal government websites often end in .gov or .mil. Before sharing sensitive information,
make sure you're on a federal government site.
The site is secure.
The
https:// ensures that you are connecting to the official website and that any
information you provide is encrypted and transmitted securely.
Manage public and private forested lands for economic, recreational, and conservation purposes. May inventory the type, amount, and location of standing timber, appraise the timber�s worth, negotiate the purchase, and draw up contracts for procurement. May determine how to conserve wildlife habitats, creek beds, water quality, and soil stability, and how best to comply with environmental regulations. May devise plans for planting and growing new trees, monitor trees for healthy growth, and determine optimal harvesting schedules.
Employment estimate and mean wage estimates for Foresters:
| Employment (1) | Employment RSE (3) |
Mean hourly wage |
Mean annual wage (2) |
Wage RSE (3) |
|---|---|---|---|---|
| 9,500 | 5.6 % | $ 32.56 | $ 67,710 | 2.0 % |
Percentile wage estimates for Foresters:
| Percentile | 10% | 25% | 50% (Median) |
75% | 90% |
|---|---|---|---|---|---|
| Hourly Wage | $ 20.81 | $ 24.28 | $ 30.82 | $ 38.23 | $ 47.28 |
| Annual Wage (2) | $ 43,280 | $ 50,510 | $ 64,110 | $ 79,530 | $ 98,330 |
Industries with the highest published employment and wages for Foresters are provided. For a list of all industries with employment in Foresters, see the Create Customized Tables function.
Industries with the highest levels of employment in Foresters:
| Industry | Employment (1) | Percent of industry employment | Hourly mean wage | Annual mean wage (2) |
|---|---|---|---|---|
| State Government, excluding schools and hospitals (OEWS Designation) | 3,010 | 0.14 | $ 30.64 | $ 63,730 |
| Federal Executive Branch (OEWS Designation) | 1,320 | 0.06 | $ 32.71 | $ 68,040 |
| Local Government, excluding schools and hospitals (OEWS Designation) | 1,050 | 0.02 | $ 32.66 | $ 67,930 |
| Logging | 880 | 1.87 | $ 37.07 | $ 77,100 |
| Electric Power Generation, Transmission and Distribution | 640 | 0.17 | $ 40.92 | $ 85,120 |
Industries with the highest concentration of employment in Foresters:
| Industry | Employment (1) | Percent of industry employment | Hourly mean wage | Annual mean wage (2) |
|---|---|---|---|---|
| Logging | 880 | 1.87 | $ 37.07 | $ 77,100 |
| Sawmills and Wood Preservation | 460 | 0.52 | $ 38.65 | $ 80,390 |
| Electric Power Generation, Transmission and Distribution | 640 | 0.17 | $ 40.92 | $ 85,120 |
| State Government, excluding schools and hospitals (OEWS Designation) | 3,010 | 0.14 | $ 30.64 | $ 63,730 |
| Pulp, Paper, and Paperboard Mills | 90 | 0.10 | $ 32.56 | $ 67,730 |
Top paying industries for Foresters:
| Industry | Employment (1) | Percent of industry employment | Hourly mean wage | Annual mean wage (2) |
|---|---|---|---|---|
| Utility System Construction | 40 | 0.01 | $ 45.29 | $ 94,210 |
| Merchant Wholesalers, Durable Goods (4232, 4233, 4235, 4236, 4237, and 4239 only) | 260 | 0.02 | $ 44.03 | $ 91,580 |
| Electric Power Generation, Transmission and Distribution | 640 | 0.17 | $ 40.92 | $ 85,120 |
| Real Estate | 120 | 0.01 | $ 39.11 | $ 81,350 |
| Sawmills and Wood Preservation | 460 | 0.52 | $ 38.65 | $ 80,390 |
States and areas with the highest published employment, location quotients, and wages for Foresters are provided. For a list of all areas with employment in Foresters, see the Create Customized Tables function.
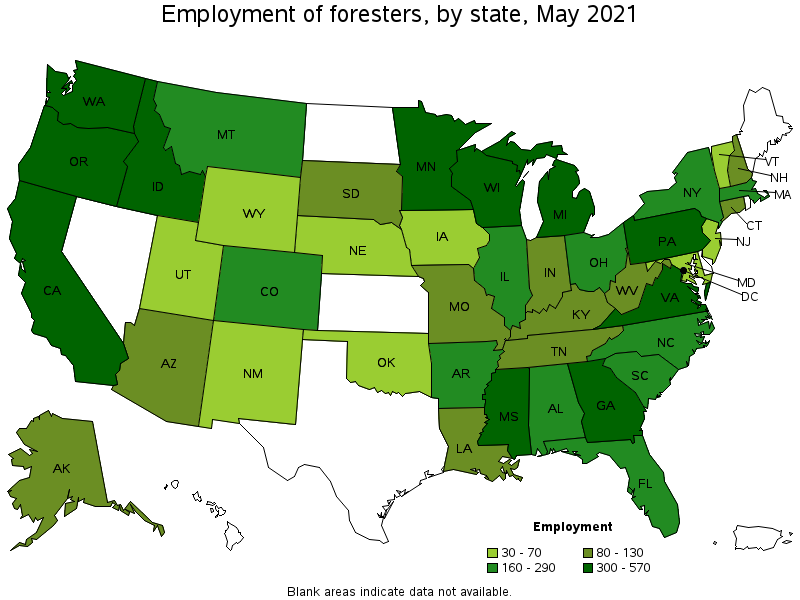
States with the highest employment level in Foresters:
| State | Employment (1) | Employment per thousand jobs | Location quotient (9) | Hourly mean wage | Annual mean wage (2) |
|---|---|---|---|---|---|
| Washington | 570 | 0.18 | 2.62 | $ 40.00 | $ 83,190 |
| Wisconsin | 520 | 0.19 | 2.82 | $ 29.80 | $ 61,980 |
| California | 520 | 0.03 | 0.46 | $ 37.55 | $ 78,110 |
| Oregon | 470 | 0.26 | 3.83 | $ 34.55 | $ 71,870 |
| Georgia | 450 | 0.10 | 1.52 | $ 35.80 | $ 74,470 |
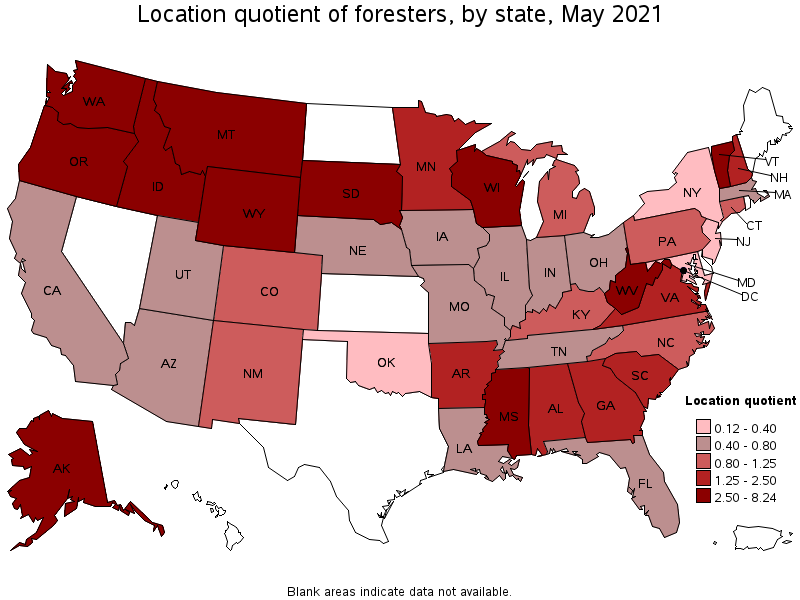
States with the highest concentration of jobs and location quotients in Foresters:
| State | Employment (1) | Employment per thousand jobs | Location quotient (9) | Hourly mean wage | Annual mean wage (2) |
|---|---|---|---|---|---|
| Montana | 260 | 0.56 | 8.24 | $ 30.38 | $ 63,200 |
| Idaho | 360 | 0.47 | 7.01 | $ 29.73 | $ 61,840 |
| South Dakota | 130 | 0.30 | 4.47 | $ 26.56 | $ 55,240 |
| Mississippi | 330 | 0.30 | 4.41 | $ 22.12 | $ 46,010 |
| Alaska | 80 | 0.26 | 3.88 | $ 37.86 | $ 78,750 |
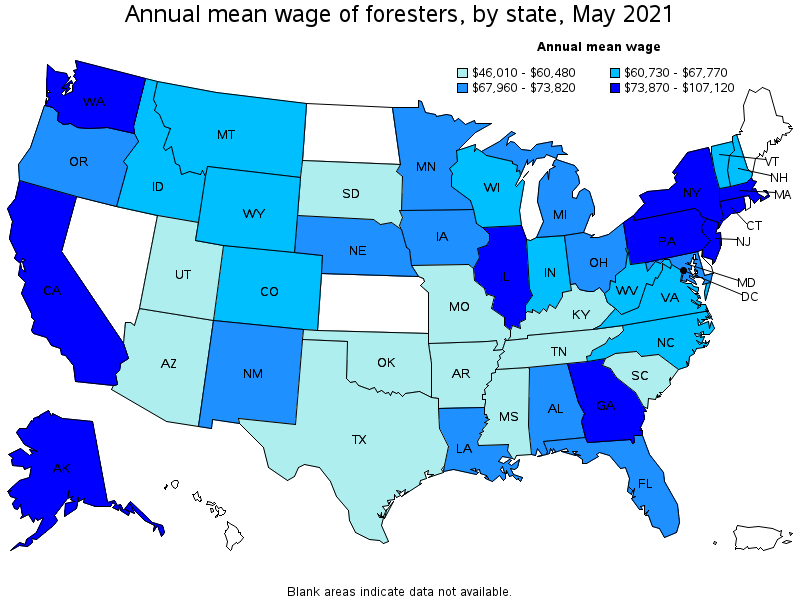
Top paying states for Foresters:
| State | Employment (1) | Employment per thousand jobs | Location quotient (9) | Hourly mean wage | Annual mean wage (2) |
|---|---|---|---|---|---|
| District of Columbia | 30 | 0.05 | 0.67 | $ 51.50 | $ 107,120 |
| New Jersey | 30 | 0.01 | 0.12 | $ 43.77 | $ 91,050 |
| Washington | 570 | 0.18 | 2.62 | $ 40.00 | $ 83,190 |
| Illinois | 270 | 0.05 | 0.72 | $ 38.91 | $ 80,930 |
| Alaska | 80 | 0.26 | 3.88 | $ 37.86 | $ 78,750 |
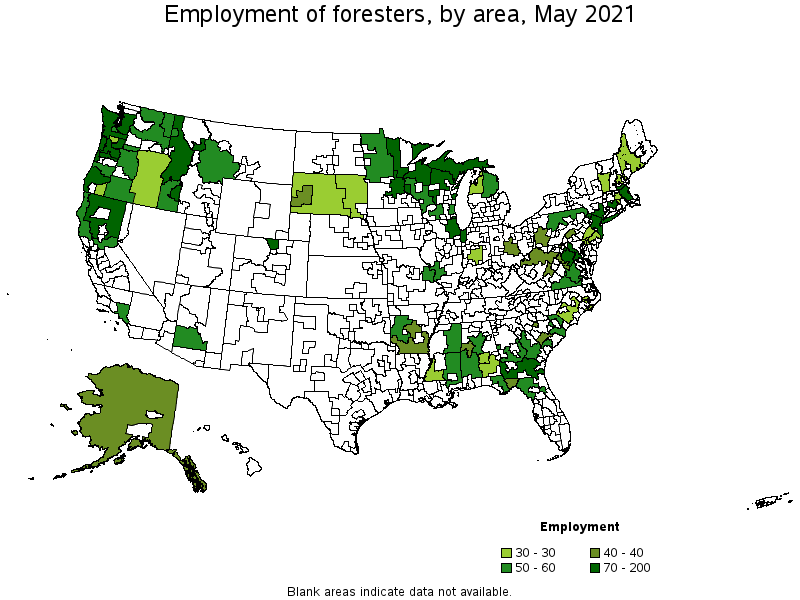
Metropolitan areas with the highest employment level in Foresters:
| Metropolitan area | Employment (1) | Employment per thousand jobs | Location quotient (9) | Hourly mean wage | Annual mean wage (2) |
|---|---|---|---|---|---|
| Chicago-Naperville-Elgin, IL-IN-WI | 150 | 0.04 | 0.54 | $ 40.83 | $ 84,930 |
| Washington-Arlington-Alexandria, DC-VA-MD-WV | 100 | 0.03 | 0.52 | $ 41.81 | $ 86,950 |
| Minneapolis-St. Paul-Bloomington, MN-WI | 100 | 0.05 | 0.81 | $ 34.58 | $ 71,920 |
| Portland-Vancouver-Hillsboro, OR-WA | 100 | 0.09 | 1.27 | $ 40.41 | $ 84,050 |
| Hartford-West Hartford-East Hartford, CT | 90 | 0.16 | 2.37 | $ 36.47 | $ 75,860 |
| Boston-Cambridge-Nashua, MA-NH | 90 | 0.03 | 0.49 | $ 35.24 | $ 73,290 |
| Seattle-Tacoma-Bellevue, WA | 80 | 0.04 | 0.62 | $ 46.26 | $ 96,220 |
| New York-Newark-Jersey City, NY-NJ-PA | 80 | 0.01 | 0.14 | $ 35.05 | $ 72,910 |
| Fort Collins, CO | 80 | 0.48 | 7.10 | $ 27.02 | $ 56,210 |
| Missoula, MT | 70 | 1.17 | 17.30 | $ 32.02 | $ 66,600 |
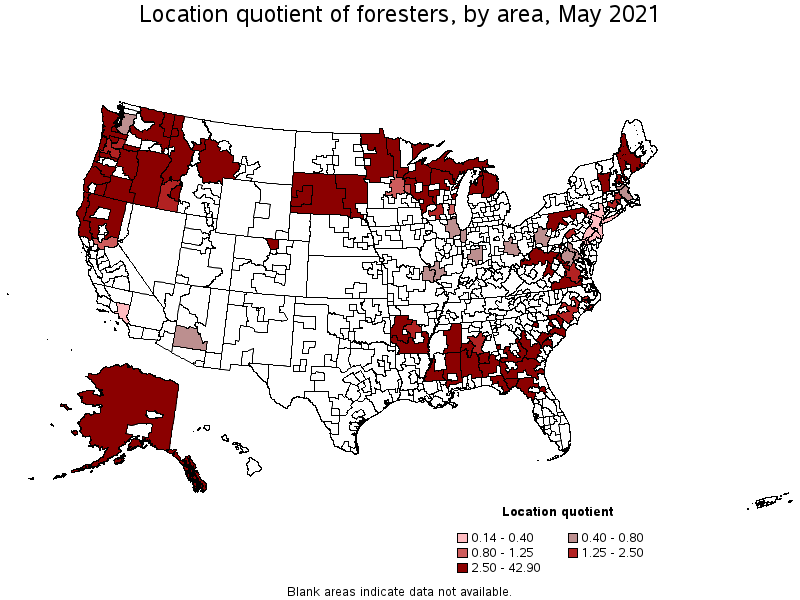
Metropolitan areas with the highest concentration of jobs and location quotients in Foresters:
| Metropolitan area | Employment (1) | Employment per thousand jobs | Location quotient (9) | Hourly mean wage | Annual mean wage (2) |
|---|---|---|---|---|---|
| Missoula, MT | 70 | 1.17 | 17.30 | $ 32.02 | $ 66,600 |
| Coeur d'Alene, ID | 60 | 0.89 | 13.20 | $ 33.06 | $ 68,760 |
| Longview, WA | 30 | 0.85 | 12.65 | $ 38.38 | $ 79,820 |
| Rapid City, SD | 40 | 0.55 | 8.16 | $ 26.26 | $ 54,630 |
| Olympia-Tumwater, WA | 60 | 0.55 | 8.11 | $ 38.81 | $ 80,720 |
| Fort Collins, CO | 80 | 0.48 | 7.10 | $ 27.02 | $ 56,210 |
| Salem, OR | 70 | 0.40 | 5.89 | $ 38.39 | $ 79,850 |
| Tuscaloosa, AL | 40 | 0.39 | 5.76 | $ 30.25 | $ 62,920 |
| Medford, OR | 30 | 0.35 | 5.20 | $ 32.99 | $ 68,630 |
| Eugene, OR | 50 | 0.32 | 4.77 | $ 32.78 | $ 68,190 |
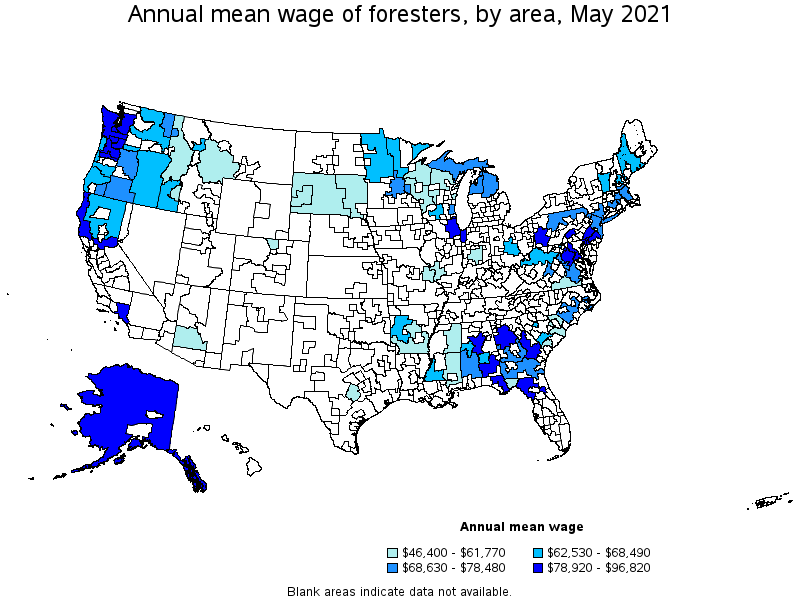
Top paying metropolitan areas for Foresters:
| Metropolitan area | Employment (1) | Employment per thousand jobs | Location quotient (9) | Hourly mean wage | Annual mean wage (2) |
|---|---|---|---|---|---|
| Los Angeles-Long Beach-Anaheim, CA | 60 | 0.01 | 0.14 | $ 46.55 | $ 96,820 |
| Seattle-Tacoma-Bellevue, WA | 80 | 0.04 | 0.62 | $ 46.26 | $ 96,220 |
| Philadelphia-Camden-Wilmington, PA-NJ-DE-MD | 30 | 0.01 | 0.19 | $ 43.42 | $ 90,320 |
| Sacramento--Roseville--Arden-Arcade, CA | 60 | 0.06 | 0.96 | $ 42.97 | $ 89,390 |
| Washington-Arlington-Alexandria, DC-VA-MD-WV | 100 | 0.03 | 0.52 | $ 41.81 | $ 86,950 |
| Chicago-Naperville-Elgin, IL-IN-WI | 150 | 0.04 | 0.54 | $ 40.83 | $ 84,930 |
| Portland-Vancouver-Hillsboro, OR-WA | 100 | 0.09 | 1.27 | $ 40.41 | $ 84,050 |
| Pittsburgh, PA | 40 | 0.03 | 0.52 | $ 39.70 | $ 82,570 |
| Harrisburg-Carlisle, PA | 40 | 0.13 | 1.90 | $ 39.49 | $ 82,140 |
| Atlanta-Sandy Springs-Roswell, GA | (8) | (8) | (8) | $ 38.93 | $ 80,970 |
Nonmetropolitan areas with the highest employment in Foresters:
| Nonmetropolitan area | Employment (1) | Employment per thousand jobs | Location quotient (9) | Hourly mean wage | Annual mean wage (2) |
|---|---|---|---|---|---|
| Northwestern Idaho nonmetropolitan area | 200 | 2.89 | 42.90 | $ 27.71 | $ 57,640 |
| Western Washington nonmetropolitan area | 170 | 1.45 | 21.58 | $ 40.38 | $ 83,990 |
| Northeastern Wisconsin nonmetropolitan area | 140 | 0.74 | 10.92 | $ 28.54 | $ 59,350 |
| Coast Oregon nonmetropolitan area | 130 | 1.14 | 16.88 | $ 32.45 | $ 67,490 |
| South Georgia nonmetropolitan area | 120 | 0.64 | 9.51 | $ 37.73 | $ 78,480 |
Nonmetropolitan areas with the highest concentration of jobs and location quotients in Foresters:
| Nonmetropolitan area | Employment (1) | Employment per thousand jobs | Location quotient (9) | Hourly mean wage | Annual mean wage (2) |
|---|---|---|---|---|---|
| Northwestern Idaho nonmetropolitan area | 200 | 2.89 | 42.90 | $ 27.71 | $ 57,640 |
| Northeast Minnesota nonmetropolitan area | 90 | 2.19 | 32.42 | $ 31.79 | $ 66,120 |
| Northwestern Wisconsin nonmetropolitan area | 100 | 2.17 | 32.17 | $ 29.21 | $ 60,750 |
| Western Washington nonmetropolitan area | 170 | 1.45 | 21.58 | $ 40.38 | $ 83,990 |
| Coast Oregon nonmetropolitan area | 130 | 1.14 | 16.88 | $ 32.45 | $ 67,490 |
Top paying nonmetropolitan areas for Foresters:
| Nonmetropolitan area | Employment (1) | Employment per thousand jobs | Location quotient (9) | Hourly mean wage | Annual mean wage (2) |
|---|---|---|---|---|---|
| North Florida nonmetropolitan area | 50 | 0.42 | 6.25 | $ 45.85 | $ 95,370 |
| North Coast Region of California nonmetropolitan area | 50 | 0.50 | 7.35 | $ 42.67 | $ 88,750 |
| Western Washington nonmetropolitan area | 170 | 1.45 | 21.58 | $ 40.38 | $ 83,990 |
| Alaska nonmetropolitan area | 40 | 0.43 | 6.40 | $ 39.98 | $ 83,160 |
| Southeast Alabama nonmetropolitan area | 30 | 0.39 | 5.84 | $ 39.61 | $ 82,390 |
These estimates are calculated with data collected from employers in all industry sectors, all metropolitan and nonmetropolitan areas, and all states and the District of Columbia. The top employment and wage figures are provided above. The complete list is available in the downloadable XLS files.
The percentile wage estimate is the value of a wage below which a certain percent of workers fall. The median wage is the 50th percentile wage estimate—50 percent of workers earn less than the median and 50 percent of workers earn more than the median. More about percentile wages.
(1) Estimates for detailed occupations do not sum to the totals because the totals include occupations not shown separately. Estimates do not include self-employed workers.
(2) Annual wages have been calculated by multiplying the hourly mean wage by a "year-round, full-time" hours figure of 2,080 hours; for those occupations where there is not an hourly wage published, the annual wage has been directly calculated from the reported survey data.
(3) The relative standard error (RSE) is a measure of the reliability of a survey statistic. The smaller the relative standard error, the more precise the estimate.
(8) Estimate not released.
(9) The location quotient is the ratio of the area concentration of occupational employment to the national average concentration. A location quotient greater than one indicates the occupation has a higher share of employment than average, and a location quotient less than one indicates the occupation is less prevalent in the area than average.
Other OEWS estimates and related information:
May 2021 National Occupational Employment and Wage Estimates
May 2021 State Occupational Employment and Wage Estimates
May 2021 Metropolitan and Nonmetropolitan Area Occupational Employment and Wage Estimates
May 2021 National Industry-Specific Occupational Employment and Wage Estimates
Last Modified Date: March 31, 2022