
An official website of the United States government
An official website of the United States government
The .gov means it's official.
Federal government websites often end in .gov or .mil. Before sharing sensitive information,
make sure you're on a federal government site.
The site is secure.
The
https:// ensures that you are connecting to the official website and that any
information you provide is encrypted and transmitted securely.
Research and study the structures and chemical properties of various natural and synthetic or composite materials, including metals, alloys, rubber, ceramics, semiconductors, polymers, and glass. Determine ways to strengthen or combine materials or develop new materials with new or specific properties for use in a variety of products and applications. Includes glass scientists, ceramic scientists, metallurgical scientists, and polymer scientists.
Employment estimate and mean wage estimates for Materials Scientists:
| Employment (1) | Employment RSE (3) |
Mean hourly wage |
Mean annual wage (2) |
Wage RSE (3) |
|---|---|---|---|---|
| 6,690 | 5.9 % | $ 50.38 | $ 104,790 | 1.7 % |
Percentile wage estimates for Materials Scientists:
| Percentile | 10% | 25% | 50% (Median) |
75% | 90% |
|---|---|---|---|---|---|
| Hourly Wage | $ 27.11 | $ 37.26 | $ 48.12 | $ 62.69 | $ 78.34 |
| Annual Wage (2) | $ 56,380 | $ 77,500 | $ 100,090 | $ 130,400 | $ 162,950 |
Industries with the highest published employment and wages for Materials Scientists are provided. For a list of all industries with employment in Materials Scientists, see the Create Customized Tables function.
Industries with the highest levels of employment in Materials Scientists:
| Industry | Employment (1) | Percent of industry employment | Hourly mean wage | Annual mean wage (2) |
|---|---|---|---|---|
| Scientific Research and Development Services | 1,920 | 0.24 | $ 54.33 | $ 113,000 |
| Architectural, Engineering, and Related Services | 1,060 | 0.07 | $ 41.46 | $ 86,240 |
| Colleges, Universities, and Professional Schools | 570 | 0.02 | $ 40.07 | $ 83,350 |
| Management of Companies and Enterprises | 350 | 0.01 | $ 53.83 | $ 111,960 |
| Chemical Manufacturing (3251, 3252, 3253, and 3259 only) | 330 | 0.09 | $ 52.64 | $ 109,490 |
Industries with the highest concentration of employment in Materials Scientists:
| Industry | Employment (1) | Percent of industry employment | Hourly mean wage | Annual mean wage (2) |
|---|---|---|---|---|
| Scientific Research and Development Services | 1,920 | 0.24 | $ 54.33 | $ 113,000 |
| Other Electrical Equipment and Component Manufacturing | 160 | 0.12 | $ 47.67 | $ 99,160 |
| Chemical Manufacturing (3251, 3252, 3253, and 3259 only) | 330 | 0.09 | $ 52.64 | $ 109,490 |
| Navigational, Measuring, Electromedical, and Control Instruments Manufacturing | 300 | 0.07 | $ 60.81 | $ 126,480 |
| Architectural, Engineering, and Related Services | 1,060 | 0.07 | $ 41.46 | $ 86,240 |
Top paying industries for Materials Scientists:
| Industry | Employment (1) | Percent of industry employment | Hourly mean wage | Annual mean wage (2) |
|---|---|---|---|---|
| Other Professional, Scientific, and Technical Services | (8) | (8) | $ 77.75 | $ 161,710 |
| Professional and Commercial Equipment and Supplies Merchant Wholesalers | (8) | (8) | $ 66.64 | $ 138,610 |
| Semiconductor and Other Electronic Component Manufacturing | 190 | 0.05 | $ 63.27 | $ 131,600 |
| Petroleum and Coal Products Manufacturing | 50 | 0.05 | $ 61.22 | $ 127,330 |
| Navigational, Measuring, Electromedical, and Control Instruments Manufacturing | 300 | 0.07 | $ 60.81 | $ 126,480 |
States and areas with the highest published employment, location quotients, and wages for Materials Scientists are provided. For a list of all areas with employment in Materials Scientists, see the Create Customized Tables function.
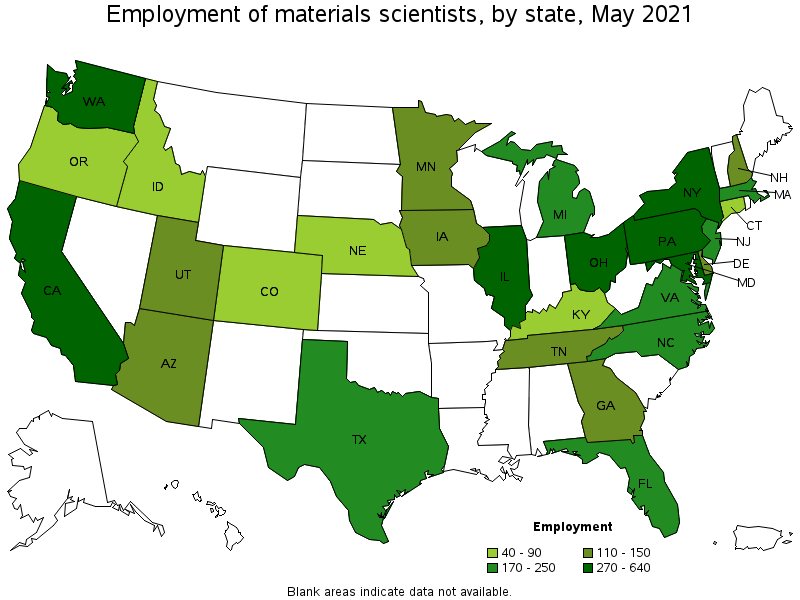
States with the highest employment level in Materials Scientists:
| State | Employment (1) | Employment per thousand jobs | Location quotient (9) | Hourly mean wage | Annual mean wage (2) |
|---|---|---|---|---|---|
| New York | 640 | 0.07 | 1.56 | $ 57.13 | $ 118,820 |
| California | 600 | 0.04 | 0.77 | $ 51.98 | $ 108,120 |
| Illinois | 530 | 0.09 | 1.97 | $ 51.60 | $ 107,330 |
| Pennsylvania | 460 | 0.08 | 1.74 | $ 47.26 | $ 98,310 |
| Washington | 400 | 0.13 | 2.66 | $ 54.82 | $ 114,030 |
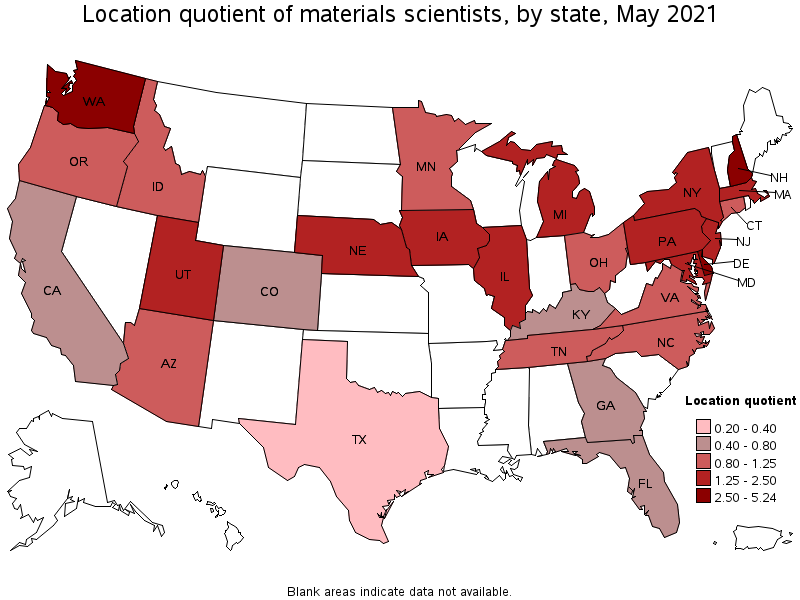
States with the highest concentration of jobs and location quotients in Materials Scientists:
| State | Employment (1) | Employment per thousand jobs | Location quotient (9) | Hourly mean wage | Annual mean wage (2) |
|---|---|---|---|---|---|
| Delaware | 110 | 0.25 | 5.24 | $ 57.43 | $ 119,450 |
| New Hampshire | 130 | 0.21 | 4.36 | $ 72.72 | $ 151,250 |
| Washington | 400 | 0.13 | 2.66 | $ 54.82 | $ 114,030 |
| Maryland | 270 | 0.11 | 2.22 | $ 51.42 | $ 106,950 |
| Iowa | 150 | 0.10 | 2.10 | $ 43.49 | $ 90,470 |
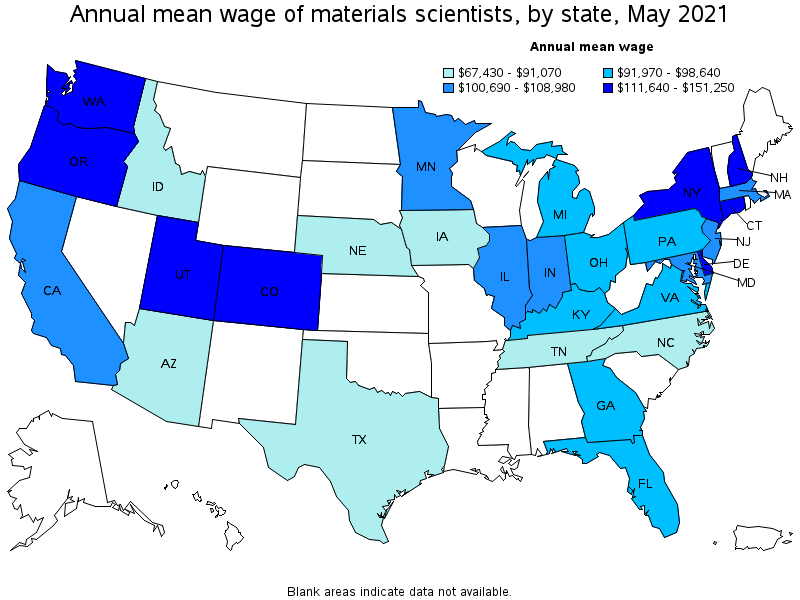
Top paying states for Materials Scientists:
| State | Employment (1) | Employment per thousand jobs | Location quotient (9) | Hourly mean wage | Annual mean wage (2) |
|---|---|---|---|---|---|
| New Hampshire | 130 | 0.21 | 4.36 | $ 72.72 | $ 151,250 |
| Connecticut | 60 | 0.04 | 0.84 | $ 67.82 | $ 141,070 |
| Colorado | 90 | 0.04 | 0.74 | $ 60.61 | $ 126,060 |
| Delaware | 110 | 0.25 | 5.24 | $ 57.43 | $ 119,450 |
| New York | 640 | 0.07 | 1.56 | $ 57.13 | $ 118,820 |
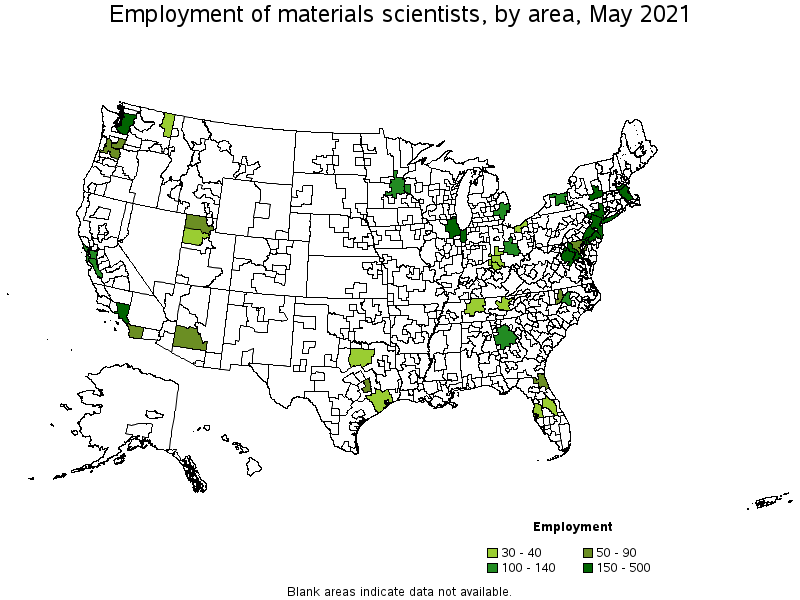
Metropolitan areas with the highest employment level in Materials Scientists:
| Metropolitan area | Employment (1) | Employment per thousand jobs | Location quotient (9) | Hourly mean wage | Annual mean wage (2) |
|---|---|---|---|---|---|
| New York-Newark-Jersey City, NY-NJ-PA | 500 | 0.06 | 1.20 | $ 53.84 | $ 111,980 |
| Chicago-Naperville-Elgin, IL-IN-WI | 470 | 0.11 | 2.33 | $ 52.25 | $ 108,690 |
| Philadelphia-Camden-Wilmington, PA-NJ-DE-MD | 370 | 0.14 | 2.91 | $ 50.34 | $ 104,720 |
| Boston-Cambridge-Nashua, MA-NH | 230 | 0.09 | 1.87 | $ 64.12 | $ 133,380 |
| Los Angeles-Long Beach-Anaheim, CA | 180 | 0.03 | 0.67 | $ 44.37 | $ 92,290 |
| Seattle-Tacoma-Bellevue, WA | 160 | 0.09 | 1.81 | $ 55.12 | $ 114,650 |
| Washington-Arlington-Alexandria, DC-VA-MD-WV | 150 | 0.05 | 1.08 | $ 46.81 | $ 97,370 |
| Albany-Schenectady-Troy, NY | 150 | 0.35 | 7.31 | $ 62.32 | $ 129,630 |
| San Francisco-Oakland-Hayward, CA | 140 | 0.06 | 1.27 | $ 56.20 | $ 116,900 |
| San Jose-Sunnyvale-Santa Clara, CA | 110 | 0.10 | 2.20 | $ 65.14 | $ 135,480 |
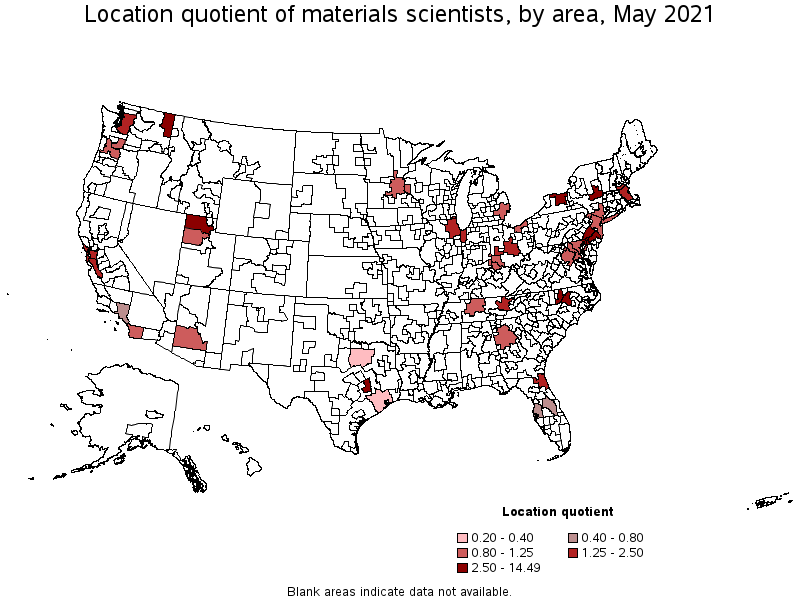
Metropolitan areas with the highest concentration of jobs and location quotients in Materials Scientists:
| Metropolitan area | Employment (1) | Employment per thousand jobs | Location quotient (9) | Hourly mean wage | Annual mean wage (2) |
|---|---|---|---|---|---|
| College Station-Bryan, TX | 80 | 0.69 | 14.49 | $ 13.89 | $ 28,880 |
| Albany-Schenectady-Troy, NY | 150 | 0.35 | 7.31 | $ 62.32 | $ 129,630 |
| Ogden-Clearfield, UT | 70 | 0.28 | 5.80 | $ 62.70 | $ 130,410 |
| Durham-Chapel Hill, NC | 80 | 0.24 | 5.11 | (8) | (8) |
| Rochester, NY | 110 | 0.23 | 4.85 | (8) | (8) |
| Raleigh, NC | 100 | 0.16 | 3.44 | $ 38.02 | $ 79,090 |
| Philadelphia-Camden-Wilmington, PA-NJ-DE-MD | 370 | 0.14 | 2.91 | $ 50.34 | $ 104,720 |
| Spokane-Spokane Valley, WA | 30 | 0.13 | 2.81 | $ 46.07 | $ 95,830 |
| Chicago-Naperville-Elgin, IL-IN-WI | 470 | 0.11 | 2.33 | $ 52.25 | $ 108,690 |
| Dayton, OH | 40 | 0.11 | 2.27 | $ 44.66 | $ 92,900 |
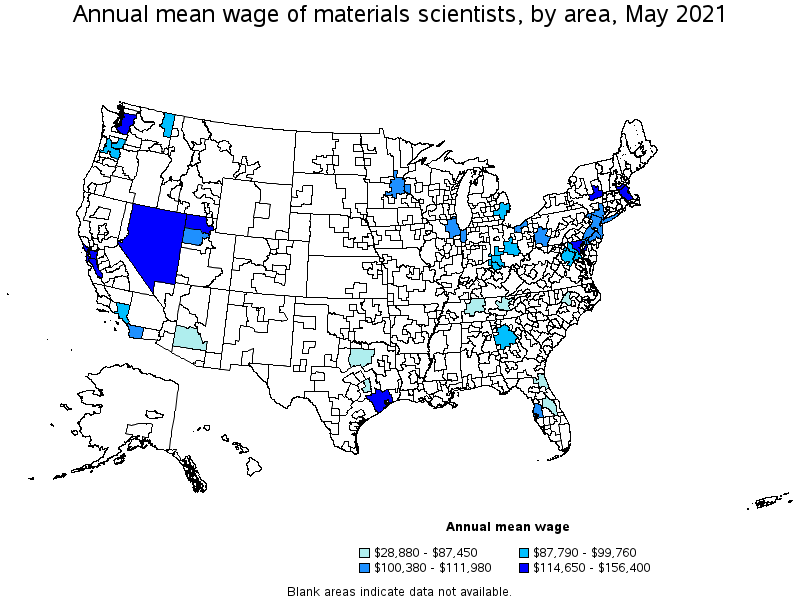
Top paying metropolitan areas for Materials Scientists:
| Metropolitan area | Employment (1) | Employment per thousand jobs | Location quotient (9) | Hourly mean wage | Annual mean wage (2) |
|---|---|---|---|---|---|
| Baltimore-Columbia-Towson, MD | 60 | 0.04 | 0.95 | $ 68.47 | $ 142,410 |
| San Jose-Sunnyvale-Santa Clara, CA | 110 | 0.10 | 2.20 | $ 65.14 | $ 135,480 |
| Boston-Cambridge-Nashua, MA-NH | 230 | 0.09 | 1.87 | $ 64.12 | $ 133,380 |
| Ogden-Clearfield, UT | 70 | 0.28 | 5.80 | $ 62.70 | $ 130,410 |
| Albany-Schenectady-Troy, NY | 150 | 0.35 | 7.31 | $ 62.32 | $ 129,630 |
| Houston-The Woodlands-Sugar Land, TX | 30 | 0.01 | 0.23 | $ 56.36 | $ 117,220 |
| San Francisco-Oakland-Hayward, CA | 140 | 0.06 | 1.27 | $ 56.20 | $ 116,900 |
| Seattle-Tacoma-Bellevue, WA | 160 | 0.09 | 1.81 | $ 55.12 | $ 114,650 |
| New York-Newark-Jersey City, NY-NJ-PA | 500 | 0.06 | 1.20 | $ 53.84 | $ 111,980 |
| San Diego-Carlsbad, CA | 70 | 0.05 | 1.06 | $ 53.00 | $ 110,250 |
These estimates are calculated with data collected from employers in all industry sectors, all metropolitan and nonmetropolitan areas, and all states and the District of Columbia. The top employment and wage figures are provided above. The complete list is available in the downloadable XLS files.
The percentile wage estimate is the value of a wage below which a certain percent of workers fall. The median wage is the 50th percentile wage estimate—50 percent of workers earn less than the median and 50 percent of workers earn more than the median. More about percentile wages.
(1) Estimates for detailed occupations do not sum to the totals because the totals include occupations not shown separately. Estimates do not include self-employed workers.
(2) Annual wages have been calculated by multiplying the hourly mean wage by a "year-round, full-time" hours figure of 2,080 hours; for those occupations where there is not an hourly wage published, the annual wage has been directly calculated from the reported survey data.
(3) The relative standard error (RSE) is a measure of the reliability of a survey statistic. The smaller the relative standard error, the more precise the estimate.
(8) Estimate not released.
(9) The location quotient is the ratio of the area concentration of occupational employment to the national average concentration. A location quotient greater than one indicates the occupation has a higher share of employment than average, and a location quotient less than one indicates the occupation is less prevalent in the area than average.
Other OEWS estimates and related information:
May 2021 National Occupational Employment and Wage Estimates
May 2021 State Occupational Employment and Wage Estimates
May 2021 Metropolitan and Nonmetropolitan Area Occupational Employment and Wage Estimates
May 2021 National Industry-Specific Occupational Employment and Wage Estimates
Last Modified Date: March 31, 2022