
An official website of the United States government
An official website of the United States government
The .gov means it's official.
Federal government websites often end in .gov or .mil. Before sharing sensitive information,
make sure you're on a federal government site.
The site is secure.
The
https:// ensures that you are connecting to the official website and that any
information you provide is encrypted and transmitted securely.
Develop comprehensive plans and programs for use of land and physical facilities of jurisdictions, such as towns, cities, counties, and metropolitan areas.
Employment estimate and mean wage estimates for Urban and Regional Planners:
| Employment (1) | Employment RSE (3) |
Mean hourly wage |
Mean annual wage (2) |
Wage RSE (3) |
|---|---|---|---|---|
| 38,940 | 1.7 % | $ 39.09 | $ 81,310 | 1.1 % |
Percentile wage estimates for Urban and Regional Planners:
| Percentile | 10% | 25% | 50% (Median) |
75% | 90% |
|---|---|---|---|---|---|
| Hourly Wage | $ 23.42 | $ 29.75 | $ 37.74 | $ 47.64 | $ 57.38 |
| Annual Wage (2) | $ 48,720 | $ 61,880 | $ 78,500 | $ 99,090 | $ 119,340 |
Industries with the highest published employment and wages for Urban and Regional Planners are provided. For a list of all industries with employment in Urban and Regional Planners, see the Create Customized Tables function.
Industries with the highest levels of employment in Urban and Regional Planners:
| Industry | Employment (1) | Percent of industry employment | Hourly mean wage | Annual mean wage (2) |
|---|---|---|---|---|
| Local Government, excluding schools and hospitals (OEWS Designation) | 27,770 | 0.52 | $ 38.04 | $ 79,120 |
| Architectural, Engineering, and Related Services | 3,850 | 0.25 | $ 43.41 | $ 90,290 |
| State Government, excluding schools and hospitals (OEWS Designation) | 3,730 | 0.17 | $ 38.41 | $ 79,880 |
| Management, Scientific, and Technical Consulting Services | 970 | 0.06 | $ 39.11 | $ 81,340 |
| Federal Executive Branch (OEWS Designation) | 880 | 0.04 | $ 49.86 | $ 103,720 |
Industries with the highest concentration of employment in Urban and Regional Planners:
| Industry | Employment (1) | Percent of industry employment | Hourly mean wage | Annual mean wage (2) |
|---|---|---|---|---|
| Local Government, excluding schools and hospitals (OEWS Designation) | 27,770 | 0.52 | $ 38.04 | $ 79,120 |
| Architectural, Engineering, and Related Services | 3,850 | 0.25 | $ 43.41 | $ 90,290 |
| State Government, excluding schools and hospitals (OEWS Designation) | 3,730 | 0.17 | $ 38.41 | $ 79,880 |
| Natural Gas Distribution | 110 | 0.10 | (8) | (8) |
| Other Professional, Scientific, and Technical Services | 460 | 0.06 | $ 45.50 | $ 94,650 |
Top paying industries for Urban and Regional Planners:
| Industry | Employment (1) | Percent of industry employment | Hourly mean wage | Annual mean wage (2) |
|---|---|---|---|---|
| Residential Building Construction | 40 | 0.01 | $ 52.70 | $ 109,610 |
| Federal Executive Branch (OEWS Designation) | 880 | 0.04 | $ 49.86 | $ 103,720 |
| Business, Professional, Labor, Political, and Similar Organizations | (8) | (8) | $ 47.07 | $ 97,900 |
| Electric Power Generation, Transmission and Distribution | 70 | 0.02 | $ 46.24 | $ 96,180 |
| Other Professional, Scientific, and Technical Services | 460 | 0.06 | $ 45.50 | $ 94,650 |
States and areas with the highest published employment, location quotients, and wages for Urban and Regional Planners are provided. For a list of all areas with employment in Urban and Regional Planners, see the Create Customized Tables function.
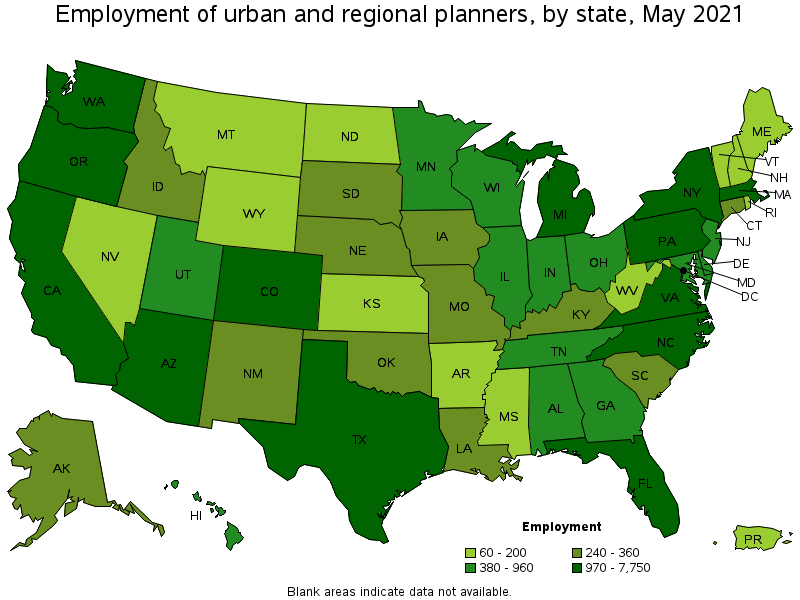
States with the highest employment level in Urban and Regional Planners:
| State | Employment (1) | Employment per thousand jobs | Location quotient (9) | Hourly mean wage | Annual mean wage (2) |
|---|---|---|---|---|---|
| California | 7,750 | 0.47 | 1.70 | $ 46.88 | $ 97,510 |
| Florida | 2,540 | 0.30 | 1.07 | $ 35.23 | $ 73,270 |
| Washington | 2,250 | 0.70 | 2.54 | $ 44.51 | $ 92,580 |
| Texas | 1,920 | 0.16 | 0.57 | $ 34.19 | $ 71,110 |
| North Carolina | 1,580 | 0.36 | 1.30 | $ 33.20 | $ 69,060 |
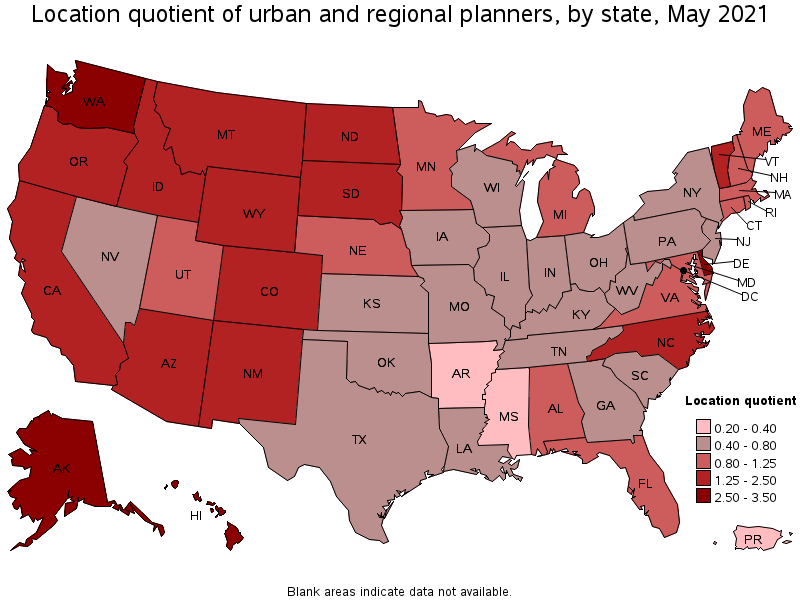
States with the highest concentration of jobs and location quotients in Urban and Regional Planners:
| State | Employment (1) | Employment per thousand jobs | Location quotient (9) | Hourly mean wage | Annual mean wage (2) |
|---|---|---|---|---|---|
| Delaware | 390 | 0.89 | 3.23 | $ 28.17 | $ 58,600 |
| Hawaii | 490 | 0.89 | 3.22 | $ 40.30 | $ 83,830 |
| Alaska | 260 | 0.87 | 3.16 | $ 43.49 | $ 90,460 |
| Washington | 2,250 | 0.70 | 2.54 | $ 44.51 | $ 92,580 |
| Vermont | 190 | 0.67 | 2.44 | $ 32.33 | $ 67,250 |
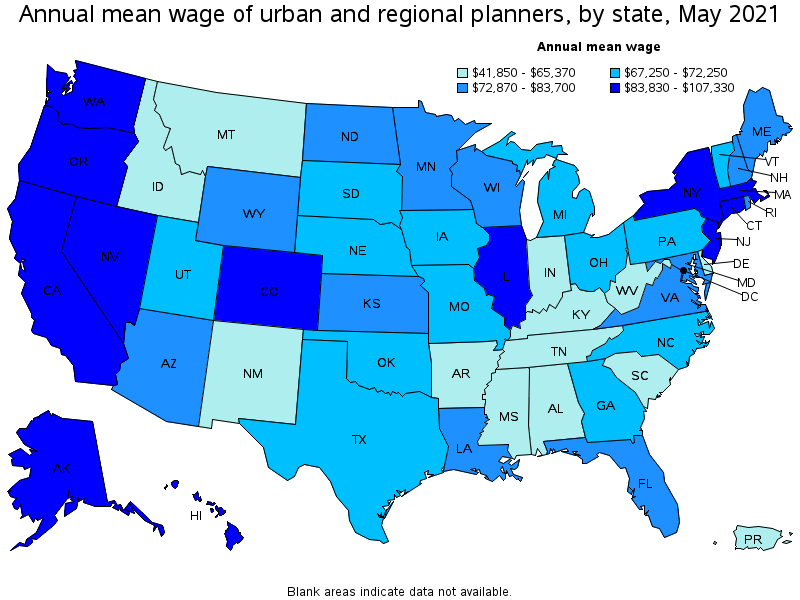
Top paying states for Urban and Regional Planners:
| State | Employment (1) | Employment per thousand jobs | Location quotient (9) | Hourly mean wage | Annual mean wage (2) |
|---|---|---|---|---|---|
| District of Columbia | 320 | 0.48 | 1.75 | $ 51.60 | $ 107,330 |
| California | 7,750 | 0.47 | 1.70 | $ 46.88 | $ 97,510 |
| New York | 1,470 | 0.17 | 0.62 | $ 44.55 | $ 92,660 |
| Washington | 2,250 | 0.70 | 2.54 | $ 44.51 | $ 92,580 |
| Nevada | 200 | 0.15 | 0.55 | $ 44.36 | $ 92,280 |
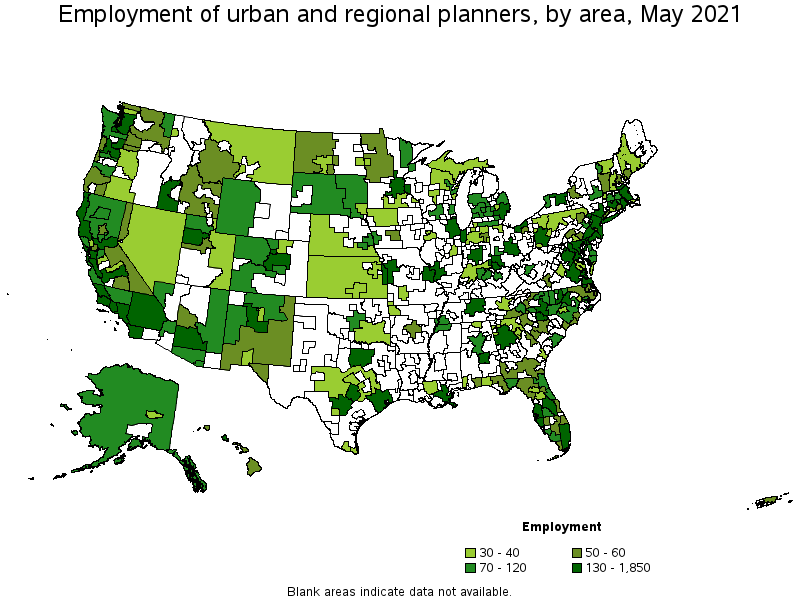
Metropolitan areas with the highest employment level in Urban and Regional Planners:
| Metropolitan area | Employment (1) | Employment per thousand jobs | Location quotient (9) | Hourly mean wage | Annual mean wage (2) |
|---|---|---|---|---|---|
| Los Angeles-Long Beach-Anaheim, CA | 1,850 | 0.32 | 1.17 | $ 47.15 | $ 98,060 |
| San Francisco-Oakland-Hayward, CA | 1,330 | 0.59 | 2.14 | $ 54.20 | $ 112,740 |
| New York-Newark-Jersey City, NY-NJ-PA | 1,150 | 0.13 | 0.48 | $ 46.42 | $ 96,560 |
| Seattle-Tacoma-Bellevue, WA | 1,100 | 0.57 | 2.07 | $ 48.14 | $ 100,120 |
| Washington-Arlington-Alexandria, DC-VA-MD-WV | 1,060 | 0.36 | 1.31 | $ 45.54 | $ 94,720 |
| Boston-Cambridge-Nashua, MA-NH | 920 | 0.36 | 1.29 | $ 40.63 | $ 84,510 |
| Sacramento--Roseville--Arden-Arcade, CA | 870 | 0.89 | 3.22 | $ 45.10 | $ 93,800 |
| San Diego-Carlsbad, CA | 800 | 0.57 | 2.07 | $ 44.48 | $ 92,520 |
| Chicago-Naperville-Elgin, IL-IN-WI | 790 | 0.19 | 0.67 | $ 41.64 | $ 86,600 |
| Miami-Fort Lauderdale-West Palm Beach, FL | 750 | 0.31 | 1.11 | $ 39.65 | $ 82,470 |
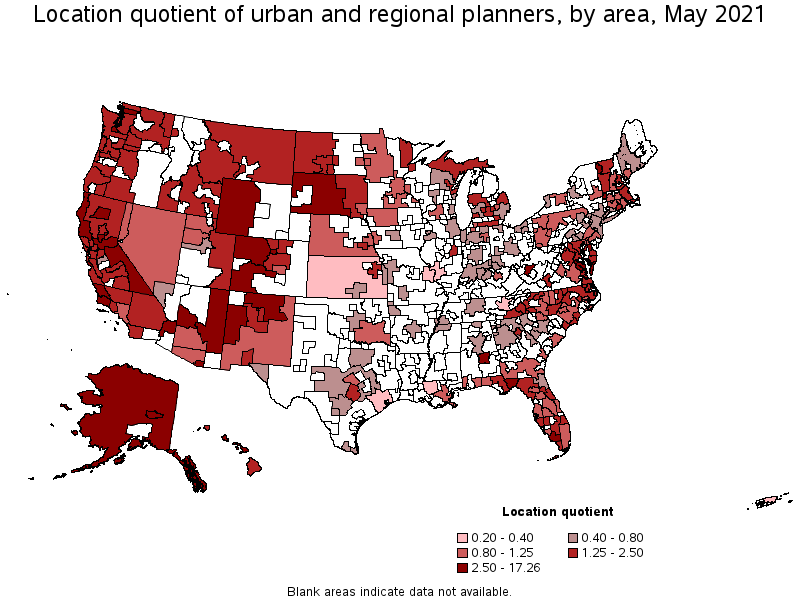
Metropolitan areas with the highest concentration of jobs and location quotients in Urban and Regional Planners:
| Metropolitan area | Employment (1) | Employment per thousand jobs | Location quotient (9) | Hourly mean wage | Annual mean wage (2) |
|---|---|---|---|---|---|
| Olympia-Tumwater, WA | 530 | 4.77 | 17.26 | $ 43.71 | $ 90,910 |
| Yuba City, CA | 90 | 1.95 | 7.05 | $ 38.69 | $ 80,480 |
| Dover, DE | 120 | 1.90 | 6.87 | $ 28.29 | $ 58,830 |
| San Luis Obispo-Paso Robles-Arroyo Grande, CA | 140 | 1.26 | 4.57 | $ 44.37 | $ 92,300 |
| Redding, CA | 80 | 1.16 | 4.20 | $ 42.21 | $ 87,800 |
| Urban Honolulu, HI | 380 | 0.96 | 3.47 | $ 40.54 | $ 84,330 |
| Fairbanks, AK | 30 | 0.95 | 3.42 | $ 40.53 | $ 84,310 |
| Pittsfield, MA | 30 | 0.94 | 3.40 | $ 38.14 | $ 79,320 |
| Montgomery, AL | 140 | 0.90 | 3.26 | $ 27.89 | $ 58,010 |
| Sacramento--Roseville--Arden-Arcade, CA | 870 | 0.89 | 3.22 | $ 45.10 | $ 93,800 |
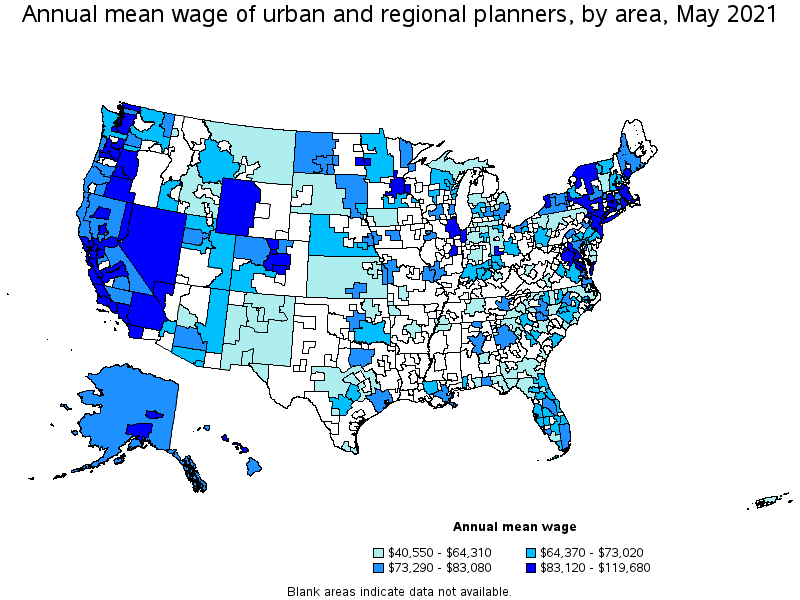
Top paying metropolitan areas for Urban and Regional Planners:
| Metropolitan area | Employment (1) | Employment per thousand jobs | Location quotient (9) | Hourly mean wage | Annual mean wage (2) |
|---|---|---|---|---|---|
| Boulder, CO | 140 | 0.79 | 2.85 | $ 57.54 | $ 119,680 |
| San Jose-Sunnyvale-Santa Clara, CA | 420 | 0.39 | 1.41 | $ 54.21 | $ 112,760 |
| San Francisco-Oakland-Hayward, CA | 1,330 | 0.59 | 2.14 | $ 54.20 | $ 112,740 |
| Napa, CA | 40 | 0.58 | 2.08 | $ 53.94 | $ 112,200 |
| Vallejo-Fairfield, CA | 60 | 0.47 | 1.71 | $ 51.28 | $ 106,670 |
| Santa Cruz-Watsonville, CA | 70 | 0.73 | 2.63 | $ 49.71 | $ 103,400 |
| Salinas, CA | 90 | 0.54 | 1.94 | $ 48.82 | $ 101,550 |
| Santa Rosa, CA | 80 | 0.42 | 1.52 | $ 48.79 | $ 101,480 |
| Reno, NV | 50 | 0.22 | 0.80 | $ 48.37 | $ 100,600 |
| Seattle-Tacoma-Bellevue, WA | 1,100 | 0.57 | 2.07 | $ 48.14 | $ 100,120 |
Nonmetropolitan areas with the highest employment in Urban and Regional Planners:
| Nonmetropolitan area | Employment (1) | Employment per thousand jobs | Location quotient (9) | Hourly mean wage | Annual mean wage (2) |
|---|---|---|---|---|---|
| North Coast Region of California nonmetropolitan area | 170 | 1.69 | 6.10 | $ 36.78 | $ 76,500 |
| Northwest Colorado nonmetropolitan area | 120 | 1.07 | 3.87 | $ 36.50 | $ 75,910 |
| Piedmont North Carolina nonmetropolitan area | 110 | 0.44 | 1.58 | $ 28.21 | $ 58,670 |
| Balance of Lower Peninsula of Michigan nonmetropolitan area | 100 | 0.39 | 1.40 | $ 26.77 | $ 55,670 |
| Northern New Mexico nonmetropolitan area | 90 | 1.18 | 4.28 | $ 28.59 | $ 59,460 |
Nonmetropolitan areas with the highest concentration of jobs and location quotients in Urban and Regional Planners:
| Nonmetropolitan area | Employment (1) | Employment per thousand jobs | Location quotient (9) | Hourly mean wage | Annual mean wage (2) |
|---|---|---|---|---|---|
| North Coast Region of California nonmetropolitan area | 170 | 1.69 | 6.10 | $ 36.78 | $ 76,500 |
| West South Dakota nonmetropolitan area | 90 | 1.46 | 5.29 | $ 30.37 | $ 63,170 |
| Northern New Mexico nonmetropolitan area | 90 | 1.18 | 4.28 | $ 28.59 | $ 59,460 |
| Northwest Colorado nonmetropolitan area | 120 | 1.07 | 3.87 | $ 36.50 | $ 75,910 |
| Eastern Sierra-Mother Lode Region of California nonmetropolitan area | 60 | 1.05 | 3.81 | $ 38.33 | $ 79,720 |
Top paying nonmetropolitan areas for Urban and Regional Planners:
| Nonmetropolitan area | Employment (1) | Employment per thousand jobs | Location quotient (9) | Hourly mean wage | Annual mean wage (2) |
|---|---|---|---|---|---|
| Northeast Virginia nonmetropolitan area | 40 | 0.76 | 2.74 | $ 50.59 | $ 105,230 |
| Central East New York nonmetropolitan area | (8) | (8) | (8) | $ 43.28 | $ 90,030 |
| Central Oregon nonmetropolitan area | 40 | 0.59 | 2.12 | $ 43.26 | $ 89,980 |
| Capital/Northern New York nonmetropolitan area | (8) | (8) | (8) | $ 42.15 | $ 87,660 |
| Nevada nonmetropolitan area | 30 | 0.34 | 1.21 | $ 41.23 | $ 85,760 |
These estimates are calculated with data collected from employers in all industry sectors, all metropolitan and nonmetropolitan areas, and all states and the District of Columbia. The top employment and wage figures are provided above. The complete list is available in the downloadable XLS files.
The percentile wage estimate is the value of a wage below which a certain percent of workers fall. The median wage is the 50th percentile wage estimate—50 percent of workers earn less than the median and 50 percent of workers earn more than the median. More about percentile wages.
(1) Estimates for detailed occupations do not sum to the totals because the totals include occupations not shown separately. Estimates do not include self-employed workers.
(2) Annual wages have been calculated by multiplying the hourly mean wage by a "year-round, full-time" hours figure of 2,080 hours; for those occupations where there is not an hourly wage published, the annual wage has been directly calculated from the reported survey data.
(3) The relative standard error (RSE) is a measure of the reliability of a survey statistic. The smaller the relative standard error, the more precise the estimate.
(8) Estimate not released.
(9) The location quotient is the ratio of the area concentration of occupational employment to the national average concentration. A location quotient greater than one indicates the occupation has a higher share of employment than average, and a location quotient less than one indicates the occupation is less prevalent in the area than average.
Other OEWS estimates and related information:
May 2021 National Occupational Employment and Wage Estimates
May 2021 State Occupational Employment and Wage Estimates
May 2021 Metropolitan and Nonmetropolitan Area Occupational Employment and Wage Estimates
May 2021 National Industry-Specific Occupational Employment and Wage Estimates
Last Modified Date: March 31, 2022