
An official website of the United States government
An official website of the United States government
The .gov means it's official.
Federal government websites often end in .gov or .mil. Before sharing sensitive information,
make sure you're on a federal government site.
The site is secure.
The
https:// ensures that you are connecting to the official website and that any
information you provide is encrypted and transmitted securely.
Study the origin, development, and behavior of human beings. May study the way of life, language, or physical characteristics of people in various parts of the world. May engage in systematic recovery and examination of material evidence, such as tools or pottery remaining from past human cultures, in order to determine the history, customs, and living habits of earlier civilizations.
Employment estimate and mean wage estimates for Anthropologists and Archeologists:
| Employment (1) | Employment RSE (3) |
Mean hourly wage |
Mean annual wage (2) |
Wage RSE (3) |
|---|---|---|---|---|
| 6,650 | 8.7 % | $ 32.12 | $ 66,800 | 1.7 % |
Percentile wage estimates for Anthropologists and Archeologists:
| Percentile | 10% | 25% | 50% (Median) |
75% | 90% |
|---|---|---|---|---|---|
| Hourly Wage | $ 18.21 | $ 23.28 | $ 29.76 | $ 37.95 | $ 48.00 |
| Annual Wage (2) | $ 37,870 | $ 48,420 | $ 61,910 | $ 78,930 | $ 99,830 |
Industries with the highest published employment and wages for Anthropologists and Archeologists are provided. For a list of all industries with employment in Anthropologists and Archeologists, see the Create Customized Tables function.
Industries with the highest levels of employment in Anthropologists and Archeologists:
| Industry | Employment (1) | Percent of industry employment | Hourly mean wage | Annual mean wage (2) |
|---|---|---|---|---|
| Scientific Research and Development Services | 2,100 | 0.26 | $ 27.46 | $ 57,120 |
| Federal Executive Branch (OEWS Designation) | 1,500 | 0.07 | $ 40.30 | $ 83,830 |
| Management, Scientific, and Technical Consulting Services | 1,340 | 0.09 | $ 30.39 | $ 63,200 |
| Architectural, Engineering, and Related Services | 550 | 0.04 | $ 35.70 | $ 74,250 |
| State Government, excluding schools and hospitals (OEWS Designation) | 330 | 0.02 | $ 31.40 | $ 65,320 |
Industries with the highest concentration of employment in Anthropologists and Archeologists:
| Industry | Employment (1) | Percent of industry employment | Hourly mean wage | Annual mean wage (2) |
|---|---|---|---|---|
| Scientific Research and Development Services | 2,100 | 0.26 | $ 27.46 | $ 57,120 |
| Management, Scientific, and Technical Consulting Services | 1,340 | 0.09 | $ 30.39 | $ 63,200 |
| Museums, Historical Sites, and Similar Institutions | 100 | 0.07 | $ 27.19 | $ 56,550 |
| Federal Executive Branch (OEWS Designation) | 1,500 | 0.07 | $ 40.30 | $ 83,830 |
| Architectural, Engineering, and Related Services | 550 | 0.04 | $ 35.70 | $ 74,250 |
Top paying industries for Anthropologists and Archeologists:
| Industry | Employment (1) | Percent of industry employment | Hourly mean wage | Annual mean wage (2) |
|---|---|---|---|---|
| Federal Executive Branch (OEWS Designation) | 1,500 | 0.07 | $ 40.30 | $ 83,830 |
| Architectural, Engineering, and Related Services | 550 | 0.04 | $ 35.70 | $ 74,250 |
| State Government, excluding schools and hospitals (OEWS Designation) | 330 | 0.02 | $ 31.40 | $ 65,320 |
| Local Government, excluding schools and hospitals (OEWS Designation) | 200 | (7) | $ 30.86 | $ 64,190 |
| Management, Scientific, and Technical Consulting Services | 1,340 | 0.09 | $ 30.39 | $ 63,200 |
States and areas with the highest published employment, location quotients, and wages for Anthropologists and Archeologists are provided. For a list of all areas with employment in Anthropologists and Archeologists, see the Create Customized Tables function.
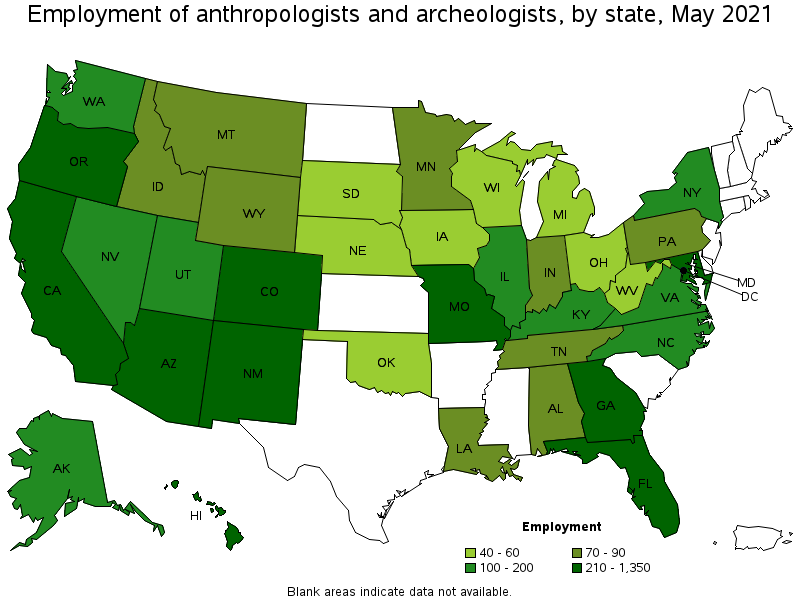
States with the highest employment level in Anthropologists and Archeologists:
| State | Employment (1) | Employment per thousand jobs | Location quotient (9) | Hourly mean wage | Annual mean wage (2) |
|---|---|---|---|---|---|
| California | 1,350 | 0.08 | 1.73 | $ 35.59 | $ 74,020 |
| Arizona | 360 | 0.13 | 2.65 | $ 29.52 | $ 61,390 |
| Hawaii | 240 | 0.43 | 9.15 | $ 39.03 | $ 81,180 |
| Oregon | 230 | 0.13 | 2.69 | $ 36.23 | $ 75,360 |
| Maryland | 230 | 0.09 | 1.91 | $ 28.49 | $ 59,260 |
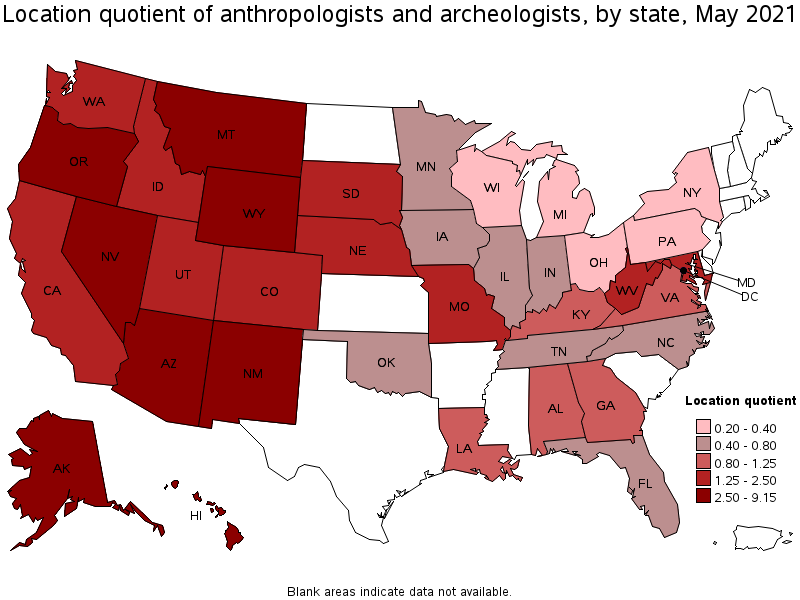
States with the highest concentration of jobs and location quotients in Anthropologists and Archeologists:
| State | Employment (1) | Employment per thousand jobs | Location quotient (9) | Hourly mean wage | Annual mean wage (2) |
|---|---|---|---|---|---|
| Hawaii | 240 | 0.43 | 9.15 | $ 39.03 | $ 81,180 |
| Alaska | 110 | 0.37 | 7.75 | $ 39.64 | $ 82,450 |
| Wyoming | 90 | 0.35 | 7.45 | $ 33.21 | $ 69,070 |
| New Mexico | 230 | 0.29 | 6.23 | $ 29.26 | $ 60,850 |
| Montana | 70 | 0.15 | 3.19 | $ 31.26 | $ 65,030 |
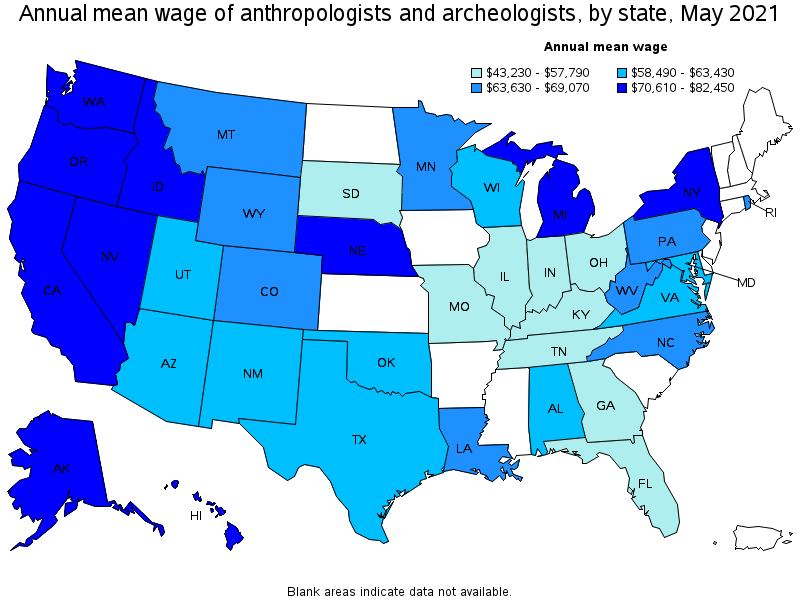
Top paying states for Anthropologists and Archeologists:
| State | Employment (1) | Employment per thousand jobs | Location quotient (9) | Hourly mean wage | Annual mean wage (2) |
|---|---|---|---|---|---|
| Alaska | 110 | 0.37 | 7.75 | $ 39.64 | $ 82,450 |
| Hawaii | 240 | 0.43 | 9.15 | $ 39.03 | $ 81,180 |
| Idaho | 80 | 0.10 | 2.22 | $ 38.28 | $ 79,610 |
| Nebraska | 60 | 0.06 | 1.32 | $ 37.51 | $ 78,020 |
| Washington | 200 | 0.06 | 1.29 | $ 36.91 | $ 76,770 |
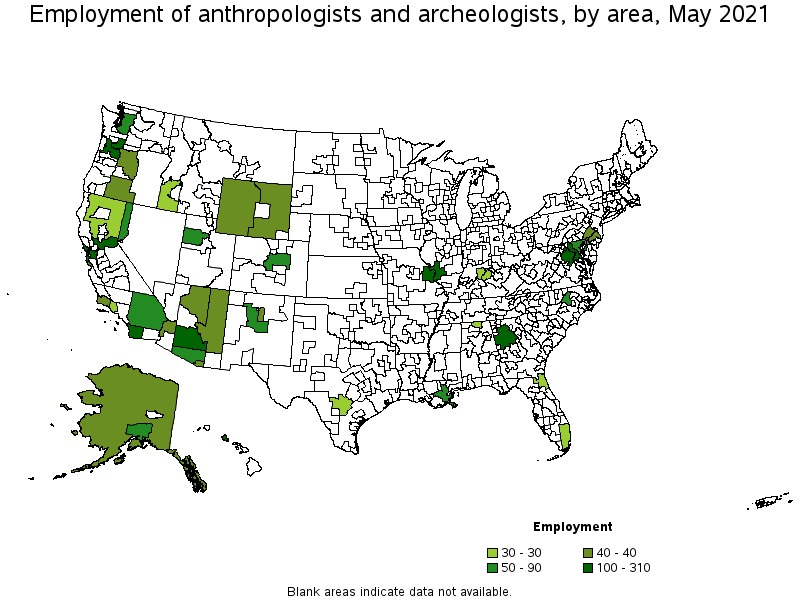
Metropolitan areas with the highest employment level in Anthropologists and Archeologists:
| Metropolitan area | Employment (1) | Employment per thousand jobs | Location quotient (9) | Hourly mean wage | Annual mean wage (2) |
|---|---|---|---|---|---|
| Washington-Arlington-Alexandria, DC-VA-MD-WV | 310 | 0.11 | 2.25 | $ 35.36 | $ 73,550 |
| Urban Honolulu, HI | 210 | 0.54 | 11.36 | $ 39.42 | $ 81,990 |
| San Diego-Carlsbad, CA | 190 | 0.13 | 2.83 | $ 33.99 | $ 70,700 |
| Sacramento--Roseville--Arden-Arcade, CA | 190 | 0.19 | 4.00 | $ 38.77 | $ 80,640 |
| Phoenix-Mesa-Scottsdale, AZ | 180 | 0.08 | 1.80 | $ 27.87 | $ 57,970 |
| Atlanta-Sandy Springs-Roswell, GA | 170 | 0.06 | 1.36 | $ 26.58 | $ 55,290 |
| San Francisco-Oakland-Hayward, CA | 160 | 0.07 | 1.55 | $ 36.42 | $ 75,760 |
| Portland-Vancouver-Hillsboro, OR-WA | 110 | 0.10 | 2.02 | $ 38.17 | $ 79,380 |
| St. Louis, MO-IL | 100 | 0.08 | 1.73 | $ 21.90 | $ 45,550 |
| Albuquerque, NM | 90 | 0.25 | 5.39 | $ 27.17 | $ 56,510 |
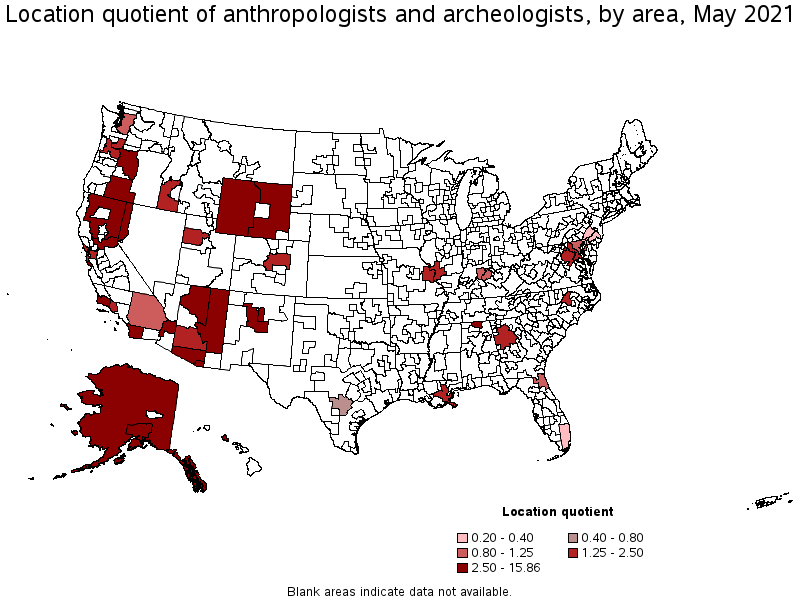
Metropolitan areas with the highest concentration of jobs and location quotients in Anthropologists and Archeologists:
| Metropolitan area | Employment (1) | Employment per thousand jobs | Location quotient (9) | Hourly mean wage | Annual mean wage (2) |
|---|---|---|---|---|---|
| Flagstaff, AZ | 40 | 0.75 | 15.86 | $ 32.04 | $ 66,650 |
| Santa Fe, NM | 40 | 0.70 | 14.75 | $ 27.80 | $ 57,830 |
| Urban Honolulu, HI | 210 | 0.54 | 11.36 | $ 39.42 | $ 81,990 |
| Santa Cruz-Watsonville, CA | 40 | 0.45 | 9.63 | $ 38.13 | $ 79,310 |
| Reno, NV | 90 | 0.39 | 8.22 | $ 34.53 | $ 71,810 |
| Anchorage, AK | 50 | 0.33 | 7.02 | $ 40.92 | $ 85,120 |
| Albuquerque, NM | 90 | 0.25 | 5.39 | $ 27.17 | $ 56,510 |
| Sacramento--Roseville--Arden-Arcade, CA | 190 | 0.19 | 4.00 | $ 38.77 | $ 80,640 |
| Santa Maria-Santa Barbara, CA | 40 | 0.18 | 3.90 | $ 36.58 | $ 76,080 |
| Tucson, AZ | 60 | 0.17 | 3.71 | $ 31.72 | $ 65,970 |
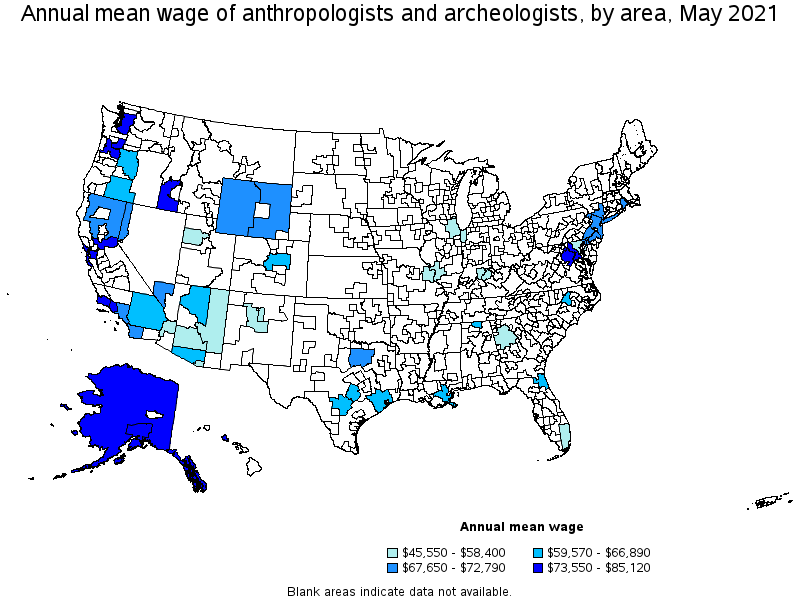
Top paying metropolitan areas for Anthropologists and Archeologists:
| Metropolitan area | Employment (1) | Employment per thousand jobs | Location quotient (9) | Hourly mean wage | Annual mean wage (2) |
|---|---|---|---|---|---|
| Anchorage, AK | 50 | 0.33 | 7.02 | $ 40.92 | $ 85,120 |
| Oxnard-Thousand Oaks-Ventura, CA | 30 | 0.10 | 2.14 | $ 40.53 | $ 84,300 |
| Urban Honolulu, HI | 210 | 0.54 | 11.36 | $ 39.42 | $ 81,990 |
| Sacramento--Roseville--Arden-Arcade, CA | 190 | 0.19 | 4.00 | $ 38.77 | $ 80,640 |
| Portland-Vancouver-Hillsboro, OR-WA | 110 | 0.10 | 2.02 | $ 38.17 | $ 79,380 |
| Santa Cruz-Watsonville, CA | 40 | 0.45 | 9.63 | $ 38.13 | $ 79,310 |
| Seattle-Tacoma-Bellevue, WA | 90 | 0.04 | 0.94 | $ 37.53 | $ 78,070 |
| Santa Maria-Santa Barbara, CA | 40 | 0.18 | 3.90 | $ 36.58 | $ 76,080 |
| Boise City, ID | 30 | 0.09 | 2.00 | $ 36.55 | $ 76,030 |
| San Francisco-Oakland-Hayward, CA | 160 | 0.07 | 1.55 | $ 36.42 | $ 75,760 |
Nonmetropolitan areas with the highest employment in Anthropologists and Archeologists:
| Nonmetropolitan area | Employment (1) | Employment per thousand jobs | Location quotient (9) | Hourly mean wage | Annual mean wage (2) |
|---|---|---|---|---|---|
| Alaska nonmetropolitan area | 40 | 0.43 | 9.06 | $ 38.45 | $ 79,980 |
| Eastern Wyoming nonmetropolitan area | 40 | 0.52 | 11.04 | $ 32.92 | $ 68,480 |
| Western Wyoming nonmetropolitan area | 40 | 0.41 | 8.79 | $ 32.64 | $ 67,880 |
| Arizona nonmetropolitan area | 40 | 0.41 | 8.63 | $ 26.88 | $ 55,900 |
| Central Oregon nonmetropolitan area | 40 | 0.59 | 12.40 | $ 31.10 | $ 64,690 |
Nonmetropolitan areas with the highest concentration of jobs and location quotients in Anthropologists and Archeologists:
| Nonmetropolitan area | Employment (1) | Employment per thousand jobs | Location quotient (9) | Hourly mean wage | Annual mean wage (2) |
|---|---|---|---|---|---|
| Central Oregon nonmetropolitan area | 40 | 0.59 | 12.40 | $ 31.10 | $ 64,690 |
| Eastern Wyoming nonmetropolitan area | 40 | 0.52 | 11.04 | $ 32.92 | $ 68,480 |
| Alaska nonmetropolitan area | 40 | 0.43 | 9.06 | $ 38.45 | $ 79,980 |
| Western Wyoming nonmetropolitan area | 40 | 0.41 | 8.79 | $ 32.64 | $ 67,880 |
| Arizona nonmetropolitan area | 40 | 0.41 | 8.63 | $ 26.88 | $ 55,900 |
Top paying nonmetropolitan areas for Anthropologists and Archeologists:
| Nonmetropolitan area | Employment (1) | Employment per thousand jobs | Location quotient (9) | Hourly mean wage | Annual mean wage (2) |
|---|---|---|---|---|---|
| Alaska nonmetropolitan area | 40 | 0.43 | 9.06 | $ 38.45 | $ 79,980 |
| North Valley-Northern Mountains Region of California nonmetropolitan area | 30 | 0.31 | 6.49 | $ 33.73 | $ 70,150 |
| Eastern Wyoming nonmetropolitan area | 40 | 0.52 | 11.04 | $ 32.92 | $ 68,480 |
| Western Wyoming nonmetropolitan area | 40 | 0.41 | 8.79 | $ 32.64 | $ 67,880 |
| Central Oregon nonmetropolitan area | 40 | 0.59 | 12.40 | $ 31.10 | $ 64,690 |
These estimates are calculated with data collected from employers in all industry sectors, all metropolitan and nonmetropolitan areas, and all states and the District of Columbia. The top employment and wage figures are provided above. The complete list is available in the downloadable XLS files.
The percentile wage estimate is the value of a wage below which a certain percent of workers fall. The median wage is the 50th percentile wage estimate—50 percent of workers earn less than the median and 50 percent of workers earn more than the median. More about percentile wages.
(1) Estimates for detailed occupations do not sum to the totals because the totals include occupations not shown separately. Estimates do not include self-employed workers.
(2) Annual wages have been calculated by multiplying the hourly mean wage by a "year-round, full-time" hours figure of 2,080 hours; for those occupations where there is not an hourly wage published, the annual wage has been directly calculated from the reported survey data.
(3) The relative standard error (RSE) is a measure of the reliability of a survey statistic. The smaller the relative standard error, the more precise the estimate.
(7) The value is less than .005 percent of industry employment.
(9) The location quotient is the ratio of the area concentration of occupational employment to the national average concentration. A location quotient greater than one indicates the occupation has a higher share of employment than average, and a location quotient less than one indicates the occupation is less prevalent in the area than average.
Other OEWS estimates and related information:
May 2021 National Occupational Employment and Wage Estimates
May 2021 State Occupational Employment and Wage Estimates
May 2021 Metropolitan and Nonmetropolitan Area Occupational Employment and Wage Estimates
May 2021 National Industry-Specific Occupational Employment and Wage Estimates
Last Modified Date: March 31, 2022