
An official website of the United States government
An official website of the United States government
The .gov means it's official.
Federal government websites often end in .gov or .mil. Before sharing sensitive information,
make sure you're on a federal government site.
The site is secure.
The
https:// ensures that you are connecting to the official website and that any
information you provide is encrypted and transmitted securely.
Conduct chemical and physical laboratory tests to assist scientists in making qualitative and quantitative analyses of solids, liquids, and gaseous materials for research and development of new products or processes, quality control, maintenance of environmental standards, and other work involving experimental, theoretical, or practical application of chemistry and related sciences.
Employment estimate and mean wage estimates for Chemical Technicians:
| Employment (1) | Employment RSE (3) |
Mean hourly wage |
Mean annual wage (2) |
Wage RSE (3) |
|---|---|---|---|---|
| 57,690 | 1.7 % | $ 26.46 | $ 55,040 | 0.7 % |
Percentile wage estimates for Chemical Technicians:
| Percentile | 10% | 25% | 50% (Median) |
75% | 90% |
|---|---|---|---|---|---|
| Hourly Wage | $ 15.38 | $ 18.63 | $ 23.56 | $ 30.38 | $ 38.74 |
| Annual Wage (2) | $ 31,980 | $ 38,740 | $ 48,990 | $ 63,180 | $ 80,570 |
Industries with the highest published employment and wages for Chemical Technicians are provided. For a list of all industries with employment in Chemical Technicians, see the Create Customized Tables function.
Industries with the highest levels of employment in Chemical Technicians:
| Industry | Employment (1) | Percent of industry employment | Hourly mean wage | Annual mean wage (2) |
|---|---|---|---|---|
| Architectural, Engineering, and Related Services | 10,070 | 0.67 | $ 22.16 | $ 46,080 |
| Chemical Manufacturing (3251, 3252, 3253, and 3259 only) | 9,960 | 2.84 | $ 29.53 | $ 61,420 |
| Scientific Research and Development Services | 6,280 | 0.79 | $ 30.68 | $ 63,820 |
| Pharmaceutical and Medicine Manufacturing | 5,740 | 1.83 | $ 25.25 | $ 52,520 |
| Chemical Manufacturing (3255 and 3256 only) | 2,890 | 1.63 | $ 24.78 | $ 51,540 |
Industries with the highest concentration of employment in Chemical Technicians:
| Industry | Employment (1) | Percent of industry employment | Hourly mean wage | Annual mean wage (2) |
|---|---|---|---|---|
| Chemical Manufacturing (3251, 3252, 3253, and 3259 only) | 9,960 | 2.84 | $ 29.53 | $ 61,420 |
| Tobacco Manufacturing | 270 | 2.47 | $ 35.17 | $ 73,160 |
| Pharmaceutical and Medicine Manufacturing | 5,740 | 1.83 | $ 25.25 | $ 52,520 |
| Chemical Manufacturing (3255 and 3256 only) | 2,890 | 1.63 | $ 24.78 | $ 51,540 |
| Metal Ore Mining | 620 | 1.51 | $ 28.91 | $ 60,140 |
Top paying industries for Chemical Technicians:
| Industry | Employment (1) | Percent of industry employment | Hourly mean wage | Annual mean wage (2) |
|---|---|---|---|---|
| Electric Power Generation, Transmission and Distribution | 780 | 0.21 | $ 44.99 | $ 93,580 |
| Federal Executive Branch (OEWS Designation) | 40 | (7) | $ 39.13 | $ 81,400 |
| General Medical and Surgical Hospitals | 60 | (7) | $ 37.75 | $ 78,520 |
| Oil and Gas Extraction | 150 | 0.14 | $ 37.65 | $ 78,320 |
| Petroleum and Coal Products Manufacturing | 1,510 | 1.46 | $ 36.78 | $ 76,490 |
States and areas with the highest published employment, location quotients, and wages for Chemical Technicians are provided. For a list of all areas with employment in Chemical Technicians, see the Create Customized Tables function.
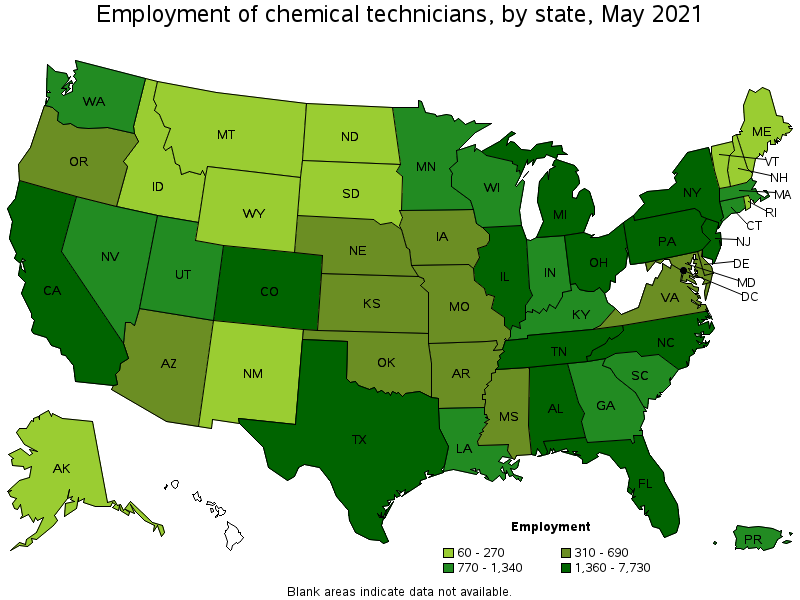
States with the highest employment level in Chemical Technicians:
| State | Employment (1) | Employment per thousand jobs | Location quotient (9) | Hourly mean wage | Annual mean wage (2) |
|---|---|---|---|---|---|
| California | 7,730 | 0.47 | 1.14 | $ 24.74 | $ 51,450 |
| Texas | 4,470 | 0.37 | 0.89 | $ 32.06 | $ 66,680 |
| New Jersey | 4,200 | 1.09 | 2.67 | $ 27.33 | $ 56,850 |
| Pennsylvania | 3,910 | 0.70 | 1.71 | $ 28.19 | $ 58,630 |
| North Carolina | 2,200 | 0.50 | 1.21 | $ 25.27 | $ 52,550 |
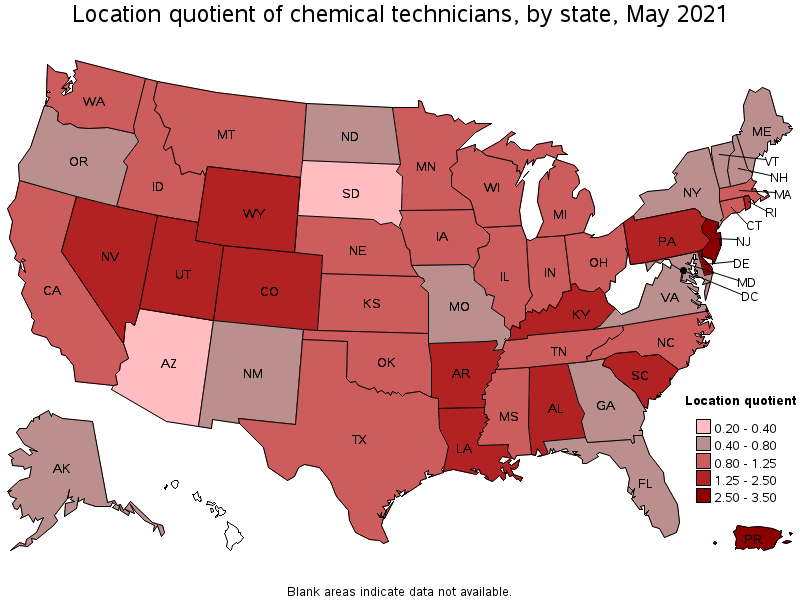
States with the highest concentration of jobs and location quotients in Chemical Technicians:
| State | Employment (1) | Employment per thousand jobs | Location quotient (9) | Hourly mean wage | Annual mean wage (2) |
|---|---|---|---|---|---|
| New Jersey | 4,200 | 1.09 | 2.67 | $ 27.33 | $ 56,850 |
| Delaware | 450 | 1.02 | 2.50 | $ 33.02 | $ 68,680 |
| Wyoming | 250 | 0.98 | 2.39 | $ 24.87 | $ 51,720 |
| Louisiana | 1,330 | 0.74 | 1.81 | $ 31.36 | $ 65,240 |
| Alabama | 1,360 | 0.70 | 1.72 | $ 25.91 | $ 53,900 |
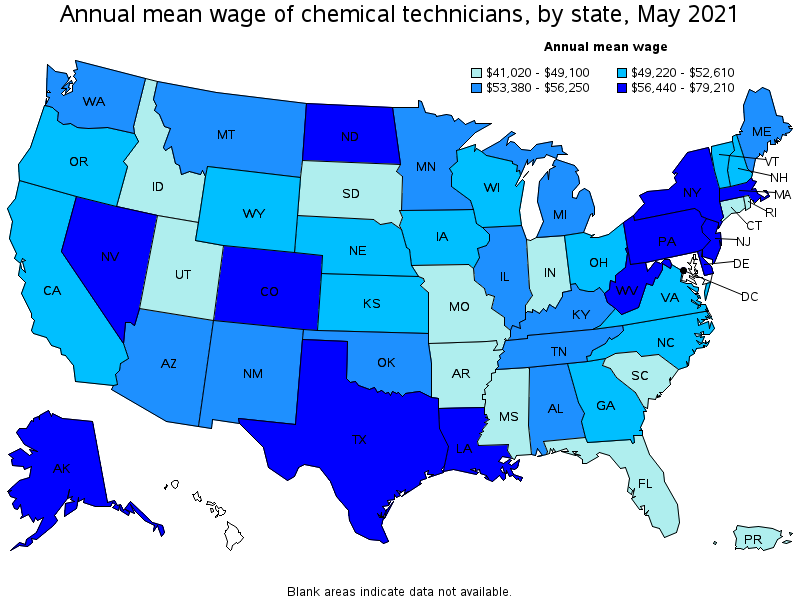
Top paying states for Chemical Technicians:
| State | Employment (1) | Employment per thousand jobs | Location quotient (9) | Hourly mean wage | Annual mean wage (2) |
|---|---|---|---|---|---|
| Alaska | 60 | 0.19 | 0.47 | $ 38.08 | $ 79,210 |
| District of Columbia | 70 | 0.10 | 0.24 | $ 35.07 | $ 72,940 |
| Delaware | 450 | 1.02 | 2.50 | $ 33.02 | $ 68,680 |
| Texas | 4,470 | 0.37 | 0.89 | $ 32.06 | $ 66,680 |
| Louisiana | 1,330 | 0.74 | 1.81 | $ 31.36 | $ 65,240 |
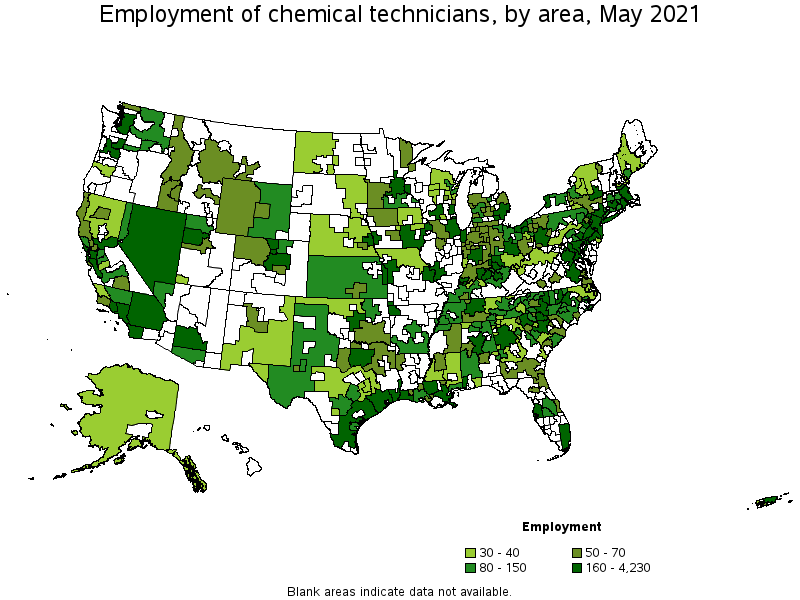
Metropolitan areas with the highest employment level in Chemical Technicians:
| Metropolitan area | Employment (1) | Employment per thousand jobs | Location quotient (9) | Hourly mean wage | Annual mean wage (2) |
|---|---|---|---|---|---|
| New York-Newark-Jersey City, NY-NJ-PA | 4,230 | 0.49 | 1.19 | $ 28.01 | $ 58,270 |
| Los Angeles-Long Beach-Anaheim, CA | 2,570 | 0.45 | 1.10 | $ 23.59 | $ 49,060 |
| Philadelphia-Camden-Wilmington, PA-NJ-DE-MD | 2,300 | 0.87 | 2.12 | $ 31.63 | $ 65,790 |
| Houston-The Woodlands-Sugar Land, TX | 2,200 | 0.76 | 1.86 | $ 35.40 | $ 73,630 |
| Chicago-Naperville-Elgin, IL-IN-WI | 1,780 | 0.42 | 1.03 | $ 27.46 | $ 57,120 |
| San Diego-Carlsbad, CA | 1,210 | 0.87 | 2.13 | $ 24.02 | $ 49,970 |
| San Francisco-Oakland-Hayward, CA | 1,180 | 0.53 | 1.28 | $ 29.86 | $ 62,100 |
| Minneapolis-St. Paul-Bloomington, MN-WI | 1,000 | 0.55 | 1.35 | $ 28.19 | $ 58,630 |
| Boston-Cambridge-Nashua, MA-NH | 930 | 0.36 | 0.88 | $ 27.40 | $ 56,990 |
| Pittsburgh, PA | 810 | 0.78 | 1.89 | $ 29.11 | $ 60,540 |
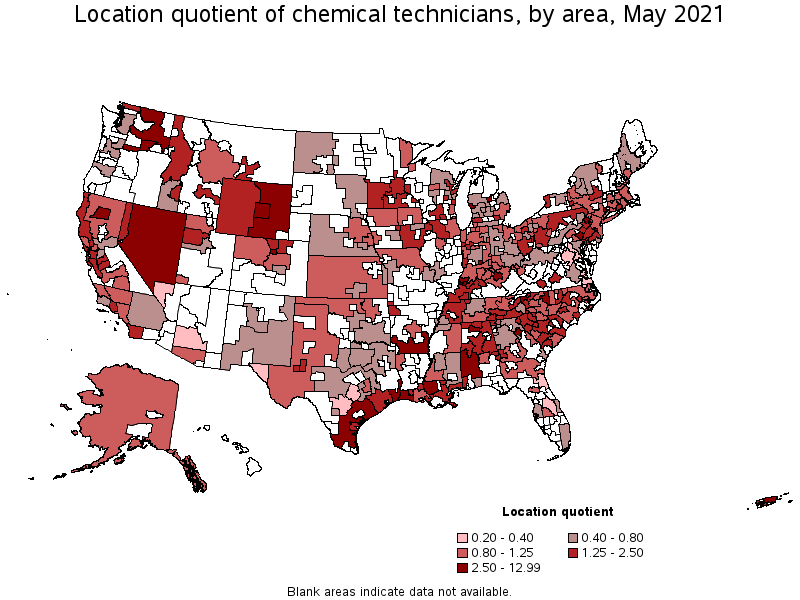
Metropolitan areas with the highest concentration of jobs and location quotients in Chemical Technicians:
| Metropolitan area | Employment (1) | Employment per thousand jobs | Location quotient (9) | Hourly mean wage | Annual mean wage (2) |
|---|---|---|---|---|---|
| Midland, MI | 130 | 3.71 | 9.07 | $ 26.90 | $ 55,960 |
| Beaumont-Port Arthur, TX | 380 | 2.60 | 6.35 | $ 33.25 | $ 69,160 |
| Decatur, AL | 130 | 2.41 | 5.88 | $ 30.81 | $ 64,080 |
| Lake Charles, LA | 210 | 2.34 | 5.71 | $ 29.91 | $ 62,210 |
| Trenton, NJ | 450 | 1.99 | 4.86 | $ 27.03 | $ 56,220 |
| Boulder, CO | 340 | 1.89 | 4.61 | $ 28.23 | $ 58,720 |
| Evansville, IN-KY | 270 | 1.82 | 4.45 | $ 21.66 | $ 45,040 |
| Johnson City, TN | 130 | 1.63 | 3.99 | (8) | (8) |
| Athens-Clarke County, GA | 120 | 1.39 | 3.39 | $ 24.87 | $ 51,730 |
| Lexington-Fayette, KY | 350 | 1.37 | 3.33 | $ 23.53 | $ 48,940 |
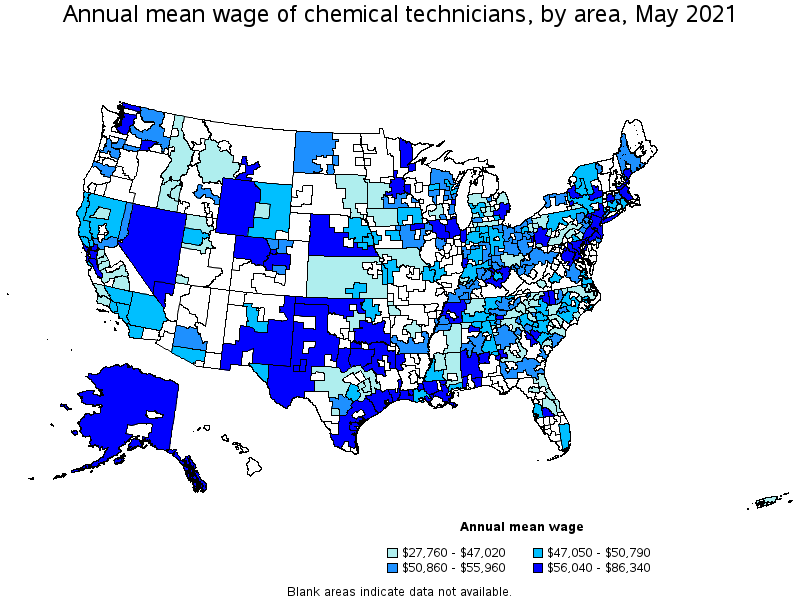
Top paying metropolitan areas for Chemical Technicians:
| Metropolitan area | Employment (1) | Employment per thousand jobs | Location quotient (9) | Hourly mean wage | Annual mean wage (2) |
|---|---|---|---|---|---|
| Billings, MT | 50 | 0.57 | 1.38 | $ 41.51 | $ 86,340 |
| Las Vegas-Henderson-Paradise, NV | 120 | 0.13 | 0.31 | $ 37.50 | $ 78,000 |
| Baton Rouge, LA | 440 | 1.21 | 2.95 | $ 37.03 | $ 77,020 |
| Houston-The Woodlands-Sugar Land, TX | 2,200 | 0.76 | 1.86 | $ 35.40 | $ 73,630 |
| Midland, TX | 90 | 0.98 | 2.40 | $ 35.04 | $ 72,870 |
| Corpus Christi, TX | 140 | 0.82 | 2.00 | $ 33.93 | $ 70,570 |
| Beaumont-Port Arthur, TX | 380 | 2.60 | 6.35 | $ 33.25 | $ 69,160 |
| Portsmouth, NH-ME | 30 | 0.35 | 0.86 | $ 32.85 | $ 68,330 |
| Winston-Salem, NC | 350 | 1.34 | 3.28 | $ 32.79 | $ 68,200 |
| Cedar Rapids, IA | 40 | 0.27 | 0.65 | $ 31.82 | $ 66,190 |
Nonmetropolitan areas with the highest employment in Chemical Technicians:
| Nonmetropolitan area | Employment (1) | Employment per thousand jobs | Location quotient (9) | Hourly mean wage | Annual mean wage (2) |
|---|---|---|---|---|---|
| Nevada nonmetropolitan area | 520 | 5.32 | 12.99 | $ 27.69 | $ 57,580 |
| Southeast Iowa nonmetropolitan area | 200 | 0.96 | 2.34 | $ 25.34 | $ 52,710 |
| Coastal Plains Region of Texas nonmetropolitan area | 180 | 1.25 | 3.04 | $ 36.23 | $ 75,360 |
| Eastern Wyoming nonmetropolitan area | 140 | 1.71 | 4.17 | $ 22.78 | $ 47,390 |
| Kansas nonmetropolitan area | 130 | 0.36 | 0.87 | $ 22.01 | $ 45,780 |
Nonmetropolitan areas with the highest concentration of jobs and location quotients in Chemical Technicians:
| Nonmetropolitan area | Employment (1) | Employment per thousand jobs | Location quotient (9) | Hourly mean wage | Annual mean wage (2) |
|---|---|---|---|---|---|
| Nevada nonmetropolitan area | 520 | 5.32 | 12.99 | $ 27.69 | $ 57,580 |
| Eastern Wyoming nonmetropolitan area | 140 | 1.71 | 4.17 | $ 22.78 | $ 47,390 |
| Southwest Alabama nonmetropolitan area | 110 | 1.66 | 4.06 | $ 32.04 | $ 66,640 |
| Coastal Plains Region of Texas nonmetropolitan area | 180 | 1.25 | 3.04 | $ 36.23 | $ 75,360 |
| South Arkansas nonmetropolitan area | 100 | 1.10 | 2.68 | $ 25.74 | $ 53,540 |
Top paying nonmetropolitan areas for Chemical Technicians:
| Nonmetropolitan area | Employment (1) | Employment per thousand jobs | Location quotient (9) | Hourly mean wage | Annual mean wage (2) |
|---|---|---|---|---|---|
| Alaska nonmetropolitan area | 40 | 0.45 | 1.11 | $ 38.17 | $ 79,390 |
| Northwest Illinois nonmetropolitan area | 70 | 0.58 | 1.41 | $ 37.28 | $ 77,550 |
| Coastal Plains Region of Texas nonmetropolitan area | 180 | 1.25 | 3.04 | $ 36.23 | $ 75,360 |
| Western Wyoming nonmetropolitan area | 60 | 0.65 | 1.59 | $ 32.82 | $ 68,260 |
| Southwest Alabama nonmetropolitan area | 110 | 1.66 | 4.06 | $ 32.04 | $ 66,640 |
These estimates are calculated with data collected from employers in all industry sectors, all metropolitan and nonmetropolitan areas, and all states and the District of Columbia. The top employment and wage figures are provided above. The complete list is available in the downloadable XLS files.
The percentile wage estimate is the value of a wage below which a certain percent of workers fall. The median wage is the 50th percentile wage estimate—50 percent of workers earn less than the median and 50 percent of workers earn more than the median. More about percentile wages.
(1) Estimates for detailed occupations do not sum to the totals because the totals include occupations not shown separately. Estimates do not include self-employed workers.
(2) Annual wages have been calculated by multiplying the hourly mean wage by a "year-round, full-time" hours figure of 2,080 hours; for those occupations where there is not an hourly wage published, the annual wage has been directly calculated from the reported survey data.
(3) The relative standard error (RSE) is a measure of the reliability of a survey statistic. The smaller the relative standard error, the more precise the estimate.
(7) The value is less than .005 percent of industry employment.
(8) Estimate not released.
(9) The location quotient is the ratio of the area concentration of occupational employment to the national average concentration. A location quotient greater than one indicates the occupation has a higher share of employment than average, and a location quotient less than one indicates the occupation is less prevalent in the area than average.
Other OEWS estimates and related information:
May 2021 National Occupational Employment and Wage Estimates
May 2021 State Occupational Employment and Wage Estimates
May 2021 Metropolitan and Nonmetropolitan Area Occupational Employment and Wage Estimates
May 2021 National Industry-Specific Occupational Employment and Wage Estimates
Last Modified Date: March 31, 2022