
An official website of the United States government
An official website of the United States government
The .gov means it's official.
Federal government websites often end in .gov or .mil. Before sharing sensitive information,
make sure you're on a federal government site.
The site is secure.
The
https:// ensures that you are connecting to the official website and that any
information you provide is encrypted and transmitted securely.
All life, physical, and social science technicians not listed separately.
Employment estimate and mean wage estimates for Life, Physical, and Social Science Technicians, All Other:
| Employment (1) | Employment RSE (3) |
Mean hourly wage |
Mean annual wage (2) |
Wage RSE (3) |
|---|---|---|---|---|
| 62,230 | 2.4 % | $ 26.65 | $ 55,420 | 0.8 % |
Percentile wage estimates for Life, Physical, and Social Science Technicians, All Other:
| Percentile | 10% | 25% | 50% (Median) |
75% | 90% |
|---|---|---|---|---|---|
| Hourly Wage | $ 14.54 | $ 18.19 | $ 23.57 | $ 30.38 | $ 38.85 |
| Annual Wage (2) | $ 30,240 | $ 37,830 | $ 49,030 | $ 63,180 | $ 80,810 |
Industries with the highest published employment and wages for Life, Physical, and Social Science Technicians, All Other are provided. For a list of all industries with employment in Life, Physical, and Social Science Technicians, All Other, see the Create Customized Tables function.
Industries with the highest levels of employment in Life, Physical, and Social Science Technicians, All Other:
| Industry | Employment (1) | Percent of industry employment | Hourly mean wage | Annual mean wage (2) |
|---|---|---|---|---|
| Colleges, Universities, and Professional Schools | 16,200 | 0.54 | $ 24.05 | $ 50,020 |
| Employment Services | 9,450 | 0.27 | $ 21.88 | $ 45,510 |
| Scientific Research and Development Services | 9,340 | 1.17 | $ 30.82 | $ 64,110 |
| Federal Executive Branch (OEWS Designation) | 6,090 | 0.29 | $ 31.32 | $ 65,150 |
| Architectural, Engineering, and Related Services | 3,110 | 0.21 | $ 30.54 | $ 63,530 |
Industries with the highest concentration of employment in Life, Physical, and Social Science Technicians, All Other:
| Industry | Employment (1) | Percent of industry employment | Hourly mean wage | Annual mean wage (2) |
|---|---|---|---|---|
| Scientific Research and Development Services | 9,340 | 1.17 | $ 30.82 | $ 64,110 |
| Colleges, Universities, and Professional Schools | 16,200 | 0.54 | $ 24.05 | $ 50,020 |
| Pharmaceutical and Medicine Manufacturing | 1,020 | 0.32 | $ 35.59 | $ 74,030 |
| Federal Executive Branch (OEWS Designation) | 6,090 | 0.29 | $ 31.32 | $ 65,150 |
| Employment Services | 9,450 | 0.27 | $ 21.88 | $ 45,510 |
Top paying industries for Life, Physical, and Social Science Technicians, All Other:
| Industry | Employment (1) | Percent of industry employment | Hourly mean wage | Annual mean wage (2) |
|---|---|---|---|---|
| Telecommunications | (8) | (8) | $ 41.69 | $ 86,720 |
| Electric Power Generation, Transmission and Distribution | 110 | 0.03 | $ 41.41 | $ 86,140 |
| Grantmaking and Giving Services | 70 | 0.05 | $ 37.63 | $ 78,280 |
| Support Activities for Mining | 150 | 0.07 | $ 37.05 | $ 77,070 |
| Merchant Wholesalers, Durable Goods (4232, 4233, 4235, 4236, 4237, and 4239 only) | 220 | 0.02 | $ 37.01 | $ 76,980 |
States and areas with the highest published employment, location quotients, and wages for Life, Physical, and Social Science Technicians, All Other are provided. For a list of all areas with employment in Life, Physical, and Social Science Technicians, All Other, see the Create Customized Tables function.
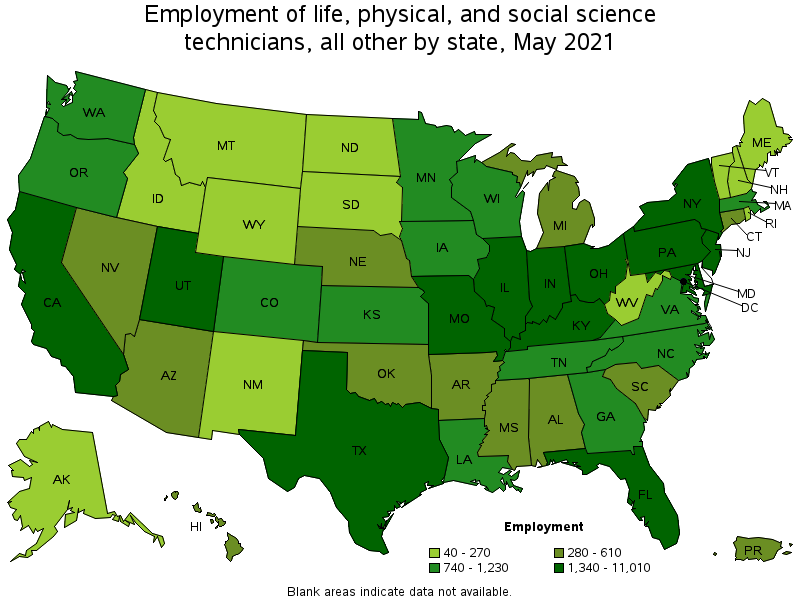
States with the highest employment level in Life, Physical, and Social Science Technicians, All Other:
| State | Employment (1) | Employment per thousand jobs | Location quotient (9) | Hourly mean wage | Annual mean wage (2) |
|---|---|---|---|---|---|
| California | 11,010 | 0.67 | 1.51 | $ 29.51 | $ 61,380 |
| New York | 6,000 | 0.69 | 1.57 | $ 28.88 | $ 60,070 |
| Texas | 5,030 | 0.41 | 0.93 | $ 21.08 | $ 43,850 |
| Missouri | 3,030 | 1.11 | 2.52 | $ 22.57 | $ 46,950 |
| New Jersey | 2,470 | 0.64 | 1.45 | $ 23.62 | $ 49,120 |
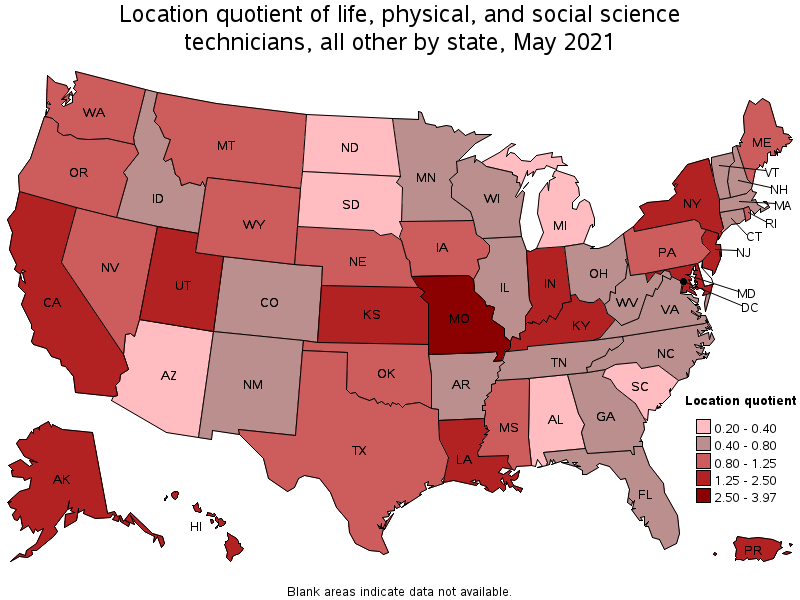
States with the highest concentration of jobs and location quotients in Life, Physical, and Social Science Technicians, All Other:
| State | Employment (1) | Employment per thousand jobs | Location quotient (9) | Hourly mean wage | Annual mean wage (2) |
|---|---|---|---|---|---|
| District of Columbia | 1,160 | 1.75 | 3.97 | (8) | (8) |
| Missouri | 3,030 | 1.11 | 2.52 | $ 22.57 | $ 46,950 |
| Hawaii | 590 | 1.07 | 2.42 | $ 27.02 | $ 56,210 |
| Utah | 1,500 | 0.97 | 2.19 | $ 19.40 | $ 40,360 |
| Kentucky | 1,480 | 0.80 | 1.82 | $ 24.57 | $ 51,100 |
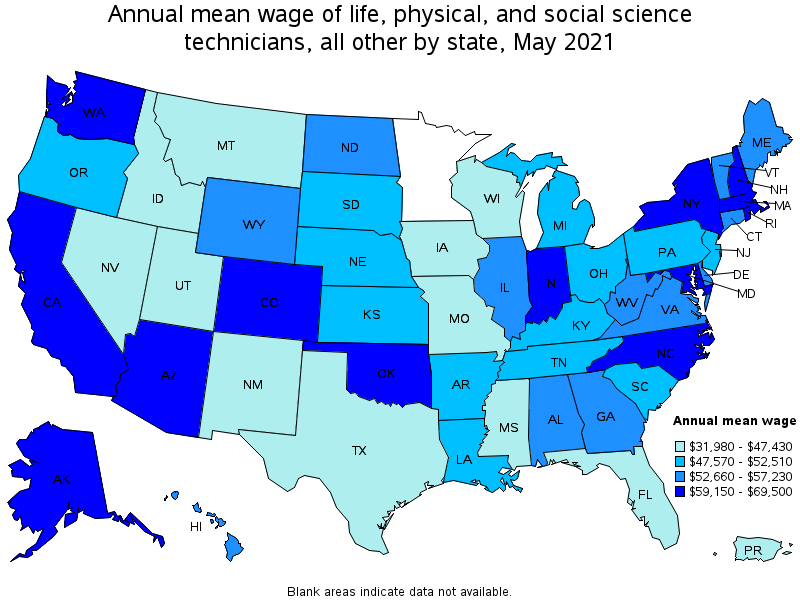
Top paying states for Life, Physical, and Social Science Technicians, All Other:
| State | Employment (1) | Employment per thousand jobs | Location quotient (9) | Hourly mean wage | Annual mean wage (2) |
|---|---|---|---|---|---|
| Oklahoma | 590 | 0.38 | 0.85 | $ 33.41 | $ 69,500 |
| Massachusetts | 1,190 | 0.35 | 0.79 | $ 32.61 | $ 67,830 |
| Maryland | 2,040 | 0.80 | 1.81 | $ 32.54 | $ 67,690 |
| Arizona | 330 | 0.12 | 0.26 | $ 31.26 | $ 65,020 |
| Washington | 1,220 | 0.38 | 0.86 | $ 31.24 | $ 64,990 |
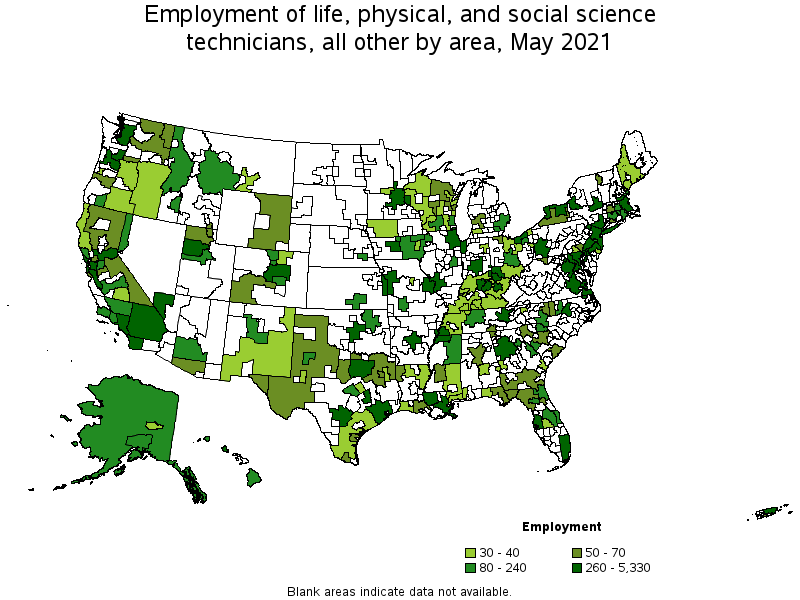
Metropolitan areas with the highest employment level in Life, Physical, and Social Science Technicians, All Other:
| Metropolitan area | Employment (1) | Employment per thousand jobs | Location quotient (9) | Hourly mean wage | Annual mean wage (2) |
|---|---|---|---|---|---|
| New York-Newark-Jersey City, NY-NJ-PA | 5,330 | 0.61 | 1.39 | $ 29.18 | $ 60,690 |
| Los Angeles-Long Beach-Anaheim, CA | 3,030 | 0.53 | 1.20 | $ 28.24 | $ 58,750 |
| San Francisco-Oakland-Hayward, CA | 2,510 | 1.12 | 2.54 | $ 33.57 | $ 69,830 |
| Washington-Arlington-Alexandria, DC-VA-MD-WV | 2,360 | 0.81 | 1.82 | $ 35.29 | $ 73,410 |
| St. Louis, MO-IL | 1,920 | 1.50 | 3.40 | $ 21.61 | $ 44,940 |
| Dallas-Fort Worth-Arlington, TX | 1,890 | 0.53 | 1.20 | $ 18.88 | $ 39,270 |
| San Diego-Carlsbad, CA | 1,480 | 1.06 | 2.41 | $ 30.02 | $ 62,430 |
| Salt Lake City, UT | 1,250 | 1.69 | 3.82 | $ 18.88 | $ 39,270 |
| Philadelphia-Camden-Wilmington, PA-NJ-DE-MD | 1,230 | 0.46 | 1.05 | $ 28.38 | $ 59,020 |
| Houston-The Woodlands-Sugar Land, TX | 1,120 | 0.39 | 0.87 | $ 25.16 | $ 52,320 |
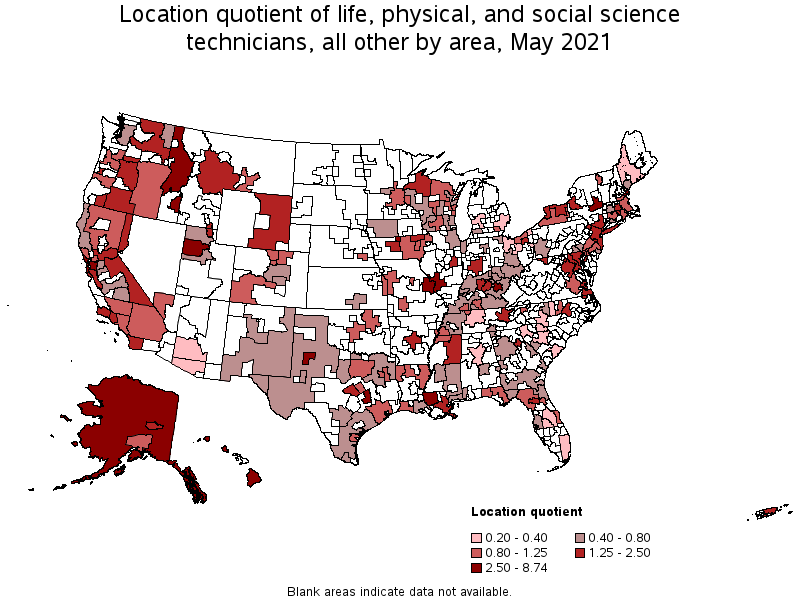
Metropolitan areas with the highest concentration of jobs and location quotients in Life, Physical, and Social Science Technicians, All Other:
| Metropolitan area | Employment (1) | Employment per thousand jobs | Location quotient (9) | Hourly mean wage | Annual mean wage (2) |
|---|---|---|---|---|---|
| College Station-Bryan, TX | 440 | 3.86 | 8.74 | $ 14.84 | $ 30,870 |
| Lexington-Fayette, KY | 650 | 2.51 | 5.69 | $ 28.07 | $ 58,390 |
| Ames, IA | 80 | 1.79 | 4.05 | $ 26.93 | $ 56,000 |
| Salt Lake City, UT | 1,250 | 1.69 | 3.82 | $ 18.88 | $ 39,270 |
| Portsmouth, NH-ME | 140 | 1.56 | 3.54 | $ 33.23 | $ 69,120 |
| St. Louis, MO-IL | 1,920 | 1.50 | 3.40 | $ 21.61 | $ 44,940 |
| Lubbock, TX | 190 | 1.35 | 3.06 | $ 18.60 | $ 38,680 |
| Albany-Schenectady-Troy, NY | 550 | 1.31 | 2.97 | $ 24.16 | $ 50,260 |
| Baton Rouge, LA | 450 | 1.24 | 2.80 | $ 25.46 | $ 52,960 |
| San Francisco-Oakland-Hayward, CA | 2,510 | 1.12 | 2.54 | $ 33.57 | $ 69,830 |
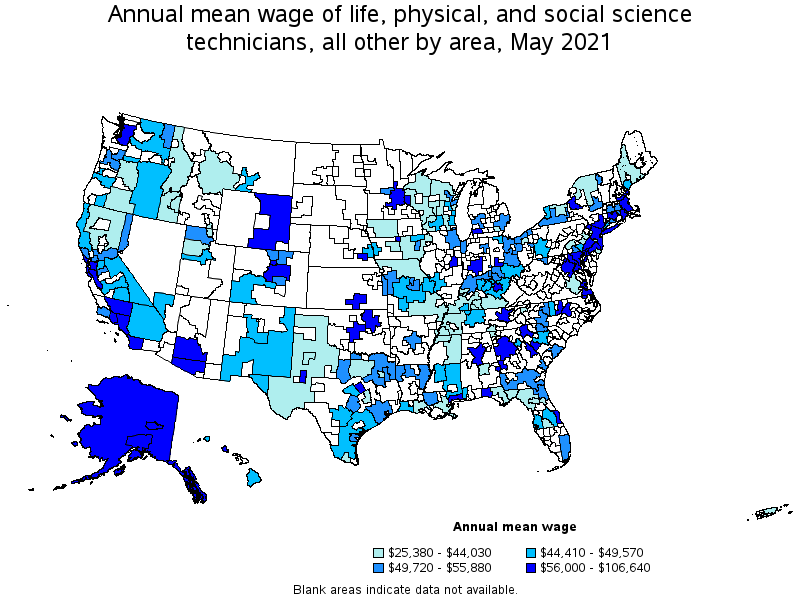
Top paying metropolitan areas for Life, Physical, and Social Science Technicians, All Other:
| Metropolitan area | Employment (1) | Employment per thousand jobs | Location quotient (9) | Hourly mean wage | Annual mean wage (2) |
|---|---|---|---|---|---|
| Minneapolis-St. Paul-Bloomington, MN-WI | 670 | 0.37 | 0.83 | $ 51.27 | $ 106,640 |
| Oklahoma City, OK | 330 | 0.55 | 1.24 | $ 39.00 | $ 81,130 |
| Boulder, CO | 90 | 0.48 | 1.09 | $ 37.32 | $ 77,620 |
| San Jose-Sunnyvale-Santa Clara, CA | 860 | 0.80 | 1.81 | $ 35.71 | $ 74,270 |
| Washington-Arlington-Alexandria, DC-VA-MD-WV | 2,360 | 0.81 | 1.82 | $ 35.29 | $ 73,410 |
| Phoenix-Mesa-Scottsdale, AZ | 190 | 0.09 | 0.20 | $ 35.26 | $ 73,350 |
| Boston-Cambridge-Nashua, MA-NH | 920 | 0.35 | 0.80 | $ 34.85 | $ 72,490 |
| San Francisco-Oakland-Hayward, CA | 2,510 | 1.12 | 2.54 | $ 33.57 | $ 69,830 |
| Birmingham-Hoover, AL | 50 | 0.11 | 0.25 | $ 33.45 | $ 69,570 |
| Portsmouth, NH-ME | 140 | 1.56 | 3.54 | $ 33.23 | $ 69,120 |
Nonmetropolitan areas with the highest employment in Life, Physical, and Social Science Technicians, All Other:
| Nonmetropolitan area | Employment (1) | Employment per thousand jobs | Location quotient (9) | Hourly mean wage | Annual mean wage (2) |
|---|---|---|---|---|---|
| Northeast Mississippi nonmetropolitan area | 230 | 1.05 | 2.39 | $ 20.33 | $ 42,290 |
| Southwest Montana nonmetropolitan area | 130 | 0.90 | 2.04 | $ 20.99 | $ 43,660 |
| Alaska nonmetropolitan area | 110 | 1.16 | 2.62 | $ 29.39 | $ 61,140 |
| Hawaii / Kauai nonmetropolitan area | 110 | 1.20 | 2.72 | $ 23.71 | $ 49,310 |
| Northwestern Idaho nonmetropolitan area | 100 | 1.49 | 3.37 | $ 19.40 | $ 40,360 |
Nonmetropolitan areas with the highest concentration of jobs and location quotients in Life, Physical, and Social Science Technicians, All Other:
| Nonmetropolitan area | Employment (1) | Employment per thousand jobs | Location quotient (9) | Hourly mean wage | Annual mean wage (2) |
|---|---|---|---|---|---|
| Northwestern Idaho nonmetropolitan area | 100 | 1.49 | 3.37 | $ 19.40 | $ 40,360 |
| Hawaii / Kauai nonmetropolitan area | 110 | 1.20 | 2.72 | $ 23.71 | $ 49,310 |
| Alaska nonmetropolitan area | 110 | 1.16 | 2.62 | $ 29.39 | $ 61,140 |
| Northeast Mississippi nonmetropolitan area | 230 | 1.05 | 2.39 | $ 20.33 | $ 42,290 |
| Eastern Wyoming nonmetropolitan area | 70 | 0.94 | 2.13 | $ 28.39 | $ 59,060 |
Top paying nonmetropolitan areas for Life, Physical, and Social Science Technicians, All Other:
| Nonmetropolitan area | Employment (1) | Employment per thousand jobs | Location quotient (9) | Hourly mean wage | Annual mean wage (2) |
|---|---|---|---|---|---|
| Alaska nonmetropolitan area | 110 | 1.16 | 2.62 | $ 29.39 | $ 61,140 |
| Eastern Wyoming nonmetropolitan area | 70 | 0.94 | 2.13 | $ 28.39 | $ 59,060 |
| Southwest New York nonmetropolitan area | 70 | 0.44 | 1.01 | $ 26.80 | $ 55,740 |
| South Georgia nonmetropolitan area | 60 | 0.33 | 0.75 | $ 25.63 | $ 53,300 |
| Southern Indiana nonmetropolitan area | 30 | 0.18 | 0.41 | $ 24.64 | $ 51,240 |
These estimates are calculated with data collected from employers in all industry sectors, all metropolitan and nonmetropolitan areas, and all states and the District of Columbia. The top employment and wage figures are provided above. The complete list is available in the downloadable XLS files.
The percentile wage estimate is the value of a wage below which a certain percent of workers fall. The median wage is the 50th percentile wage estimate—50 percent of workers earn less than the median and 50 percent of workers earn more than the median. More about percentile wages.
(1) Estimates for detailed occupations do not sum to the totals because the totals include occupations not shown separately. Estimates do not include self-employed workers.
(2) Annual wages have been calculated by multiplying the hourly mean wage by a "year-round, full-time" hours figure of 2,080 hours; for those occupations where there is not an hourly wage published, the annual wage has been directly calculated from the reported survey data.
(3) The relative standard error (RSE) is a measure of the reliability of a survey statistic. The smaller the relative standard error, the more precise the estimate.
(8) Estimate not released.
(9) The location quotient is the ratio of the area concentration of occupational employment to the national average concentration. A location quotient greater than one indicates the occupation has a higher share of employment than average, and a location quotient less than one indicates the occupation is less prevalent in the area than average.
Other OEWS estimates and related information:
May 2021 National Occupational Employment and Wage Estimates
May 2021 State Occupational Employment and Wage Estimates
May 2021 Metropolitan and Nonmetropolitan Area Occupational Employment and Wage Estimates
May 2021 National Industry-Specific Occupational Employment and Wage Estimates
Last Modified Date: March 31, 2022