
An official website of the United States government
An official website of the United States government
The .gov means it's official.
Federal government websites often end in .gov or .mil. Before sharing sensitive information,
make sure you're on a federal government site.
The site is secure.
The
https:// ensures that you are connecting to the official website and that any
information you provide is encrypted and transmitted securely.
Collect data on work environments for analysis by occupational health and safety specialists. Implement and conduct evaluation of programs designed to limit chemical, physical, biological, and ergonomic risks to workers.
Employment estimate and mean wage estimates for Occupational Health and Safety Technicians:
| Employment (1) | Employment RSE (3) |
Mean hourly wage |
Mean annual wage (2) |
Wage RSE (3) |
|---|---|---|---|---|
| 21,750 | 7.0 % | $ 27.67 | $ 57,560 | 2.2 % |
Percentile wage estimates for Occupational Health and Safety Technicians:
| Percentile | 10% | 25% | 50% (Median) |
75% | 90% |
|---|---|---|---|---|---|
| Hourly Wage | $ 14.58 | $ 18.67 | $ 24.58 | $ 35.51 | $ 43.88 |
| Annual Wage (2) | $ 30,330 | $ 38,840 | $ 51,120 | $ 73,860 | $ 91,260 |
Industries with the highest published employment and wages for Occupational Health and Safety Technicians are provided. For a list of all industries with employment in Occupational Health and Safety Technicians, see the Create Customized Tables function.
Industries with the highest levels of employment in Occupational Health and Safety Technicians:
| Industry | Employment (1) | Percent of industry employment | Hourly mean wage | Annual mean wage (2) |
|---|---|---|---|---|
| Management, Scientific, and Technical Consulting Services | 3,830 | 0.25 | $ 23.65 | $ 49,190 |
| Local Government, excluding schools and hospitals (OEWS Designation) | 1,180 | 0.02 | $ 28.75 | $ 59,800 |
| Truck Transportation | 940 | 0.06 | $ 22.64 | $ 47,090 |
| Colleges, Universities, and Professional Schools | 840 | 0.03 | $ 27.53 | $ 57,270 |
| Management of Companies and Enterprises | 830 | 0.03 | $ 32.61 | $ 67,830 |
Industries with the highest concentration of employment in Occupational Health and Safety Technicians:
| Industry | Employment (1) | Percent of industry employment | Hourly mean wage | Annual mean wage (2) |
|---|---|---|---|---|
| Waste Treatment and Disposal | 410 | 0.41 | $ 37.63 | $ 78,260 |
| Coal Mining | 120 | 0.33 | $ 31.26 | $ 65,020 |
| Management, Scientific, and Technical Consulting Services | 3,830 | 0.25 | $ 23.65 | $ 49,190 |
| Support Activities for Mining | 430 | 0.20 | $ 26.67 | $ 55,470 |
| Iron and Steel Mills and Ferroalloy Manufacturing | 110 | 0.14 | $ 30.51 | $ 63,470 |
Top paying industries for Occupational Health and Safety Technicians:
| Industry | Employment (1) | Percent of industry employment | Hourly mean wage | Annual mean wage (2) |
|---|---|---|---|---|
| Electric Power Generation, Transmission and Distribution | 160 | 0.04 | $ 45.26 | $ 94,150 |
| Natural Gas Distribution | 50 | 0.04 | $ 43.62 | $ 90,740 |
| Insurance and Employee Benefit Funds | (8) | (8) | $ 40.38 | $ 83,990 |
| Scientific Research and Development Services | 280 | 0.04 | $ 39.45 | $ 82,060 |
| Waste Treatment and Disposal | 410 | 0.41 | $ 37.63 | $ 78,260 |
States and areas with the highest published employment, location quotients, and wages for Occupational Health and Safety Technicians are provided. For a list of all areas with employment in Occupational Health and Safety Technicians, see the Create Customized Tables function.
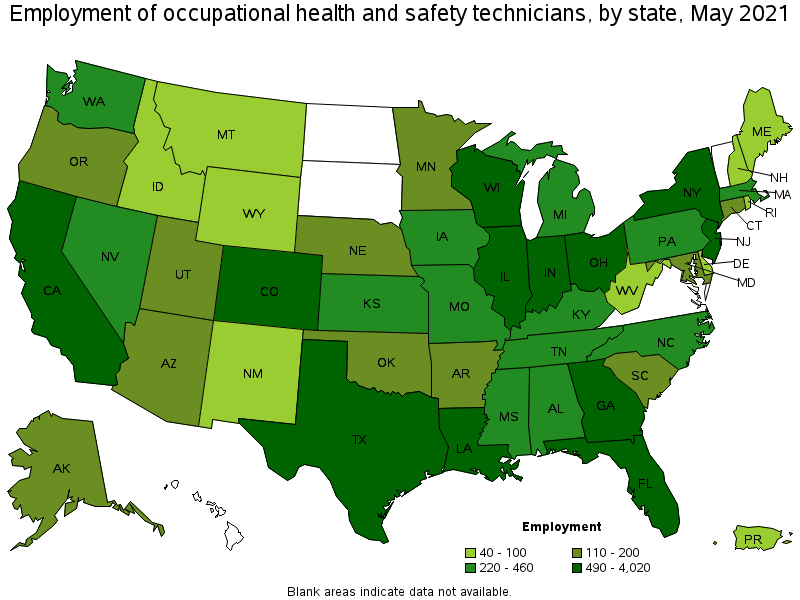
States with the highest employment level in Occupational Health and Safety Technicians:
| State | Employment (1) | Employment per thousand jobs | Location quotient (9) | Hourly mean wage | Annual mean wage (2) |
|---|---|---|---|---|---|
| Texas | 4,020 | 0.33 | 2.13 | $ 23.17 | $ 48,200 |
| California | 2,710 | 0.16 | 1.06 | $ 28.23 | $ 58,710 |
| Indiana | 1,020 | 0.34 | 2.21 | $ 31.05 | $ 64,590 |
| New York | 900 | 0.10 | 0.68 | $ 29.09 | $ 60,510 |
| Wisconsin | 770 | 0.28 | 1.80 | $ 28.94 | $ 60,190 |
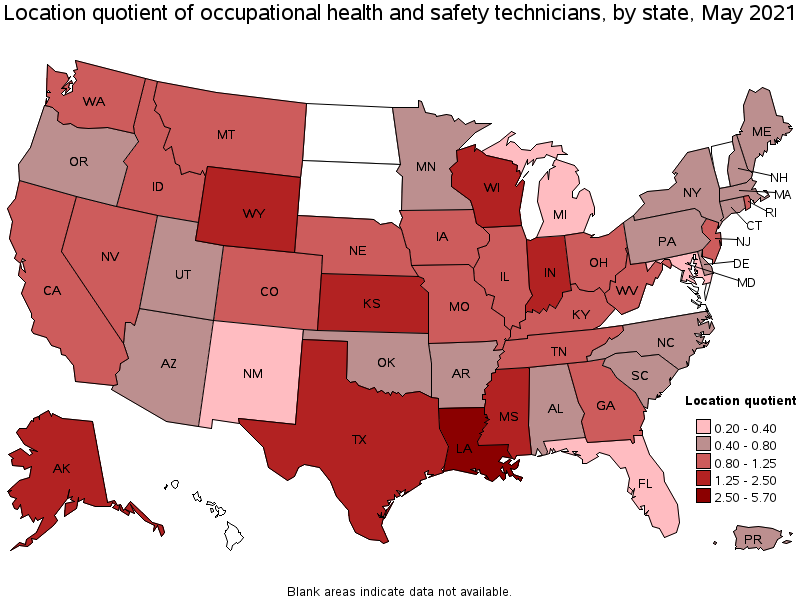
States with the highest concentration of jobs and location quotients in Occupational Health and Safety Technicians:
| State | Employment (1) | Employment per thousand jobs | Location quotient (9) | Hourly mean wage | Annual mean wage (2) |
|---|---|---|---|---|---|
| Louisiana | 730 | 0.41 | 2.64 | $ 21.04 | $ 43,770 |
| Alaska | 110 | 0.36 | 2.36 | $ 36.29 | $ 75,480 |
| Indiana | 1,020 | 0.34 | 2.21 | $ 31.05 | $ 64,590 |
| Mississippi | 360 | 0.33 | 2.13 | $ 29.06 | $ 60,440 |
| Texas | 4,020 | 0.33 | 2.13 | $ 23.17 | $ 48,200 |
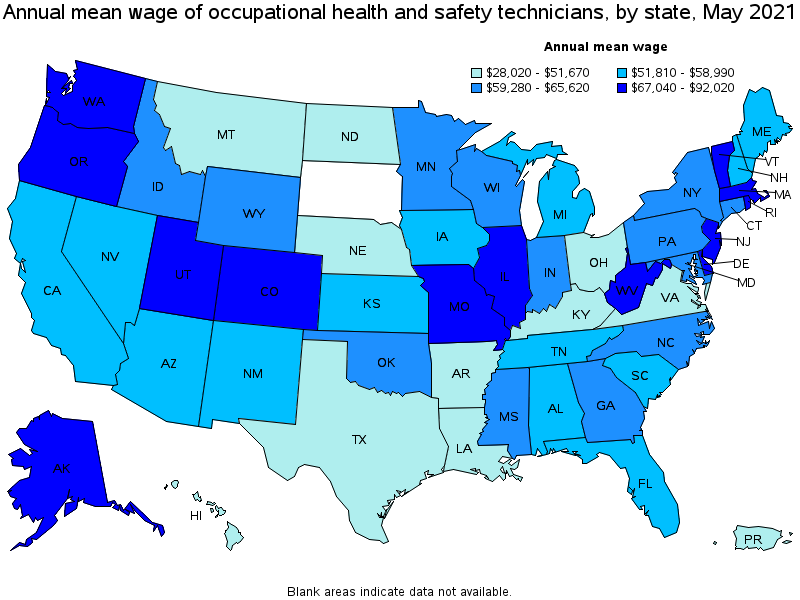
Top paying states for Occupational Health and Safety Technicians:
| State | Employment (1) | Employment per thousand jobs | Location quotient (9) | Hourly mean wage | Annual mean wage (2) |
|---|---|---|---|---|---|
| Vermont | (8) | (8) | (8) | $ 44.24 | $ 92,020 |
| Washington | 460 | 0.14 | 0.93 | $ 37.27 | $ 77,520 |
| Alaska | 110 | 0.36 | 2.36 | $ 36.29 | $ 75,480 |
| Colorado | 490 | 0.19 | 1.21 | $ 34.73 | $ 72,240 |
| Massachusetts | 300 | 0.09 | 0.58 | $ 34.13 | $ 70,990 |
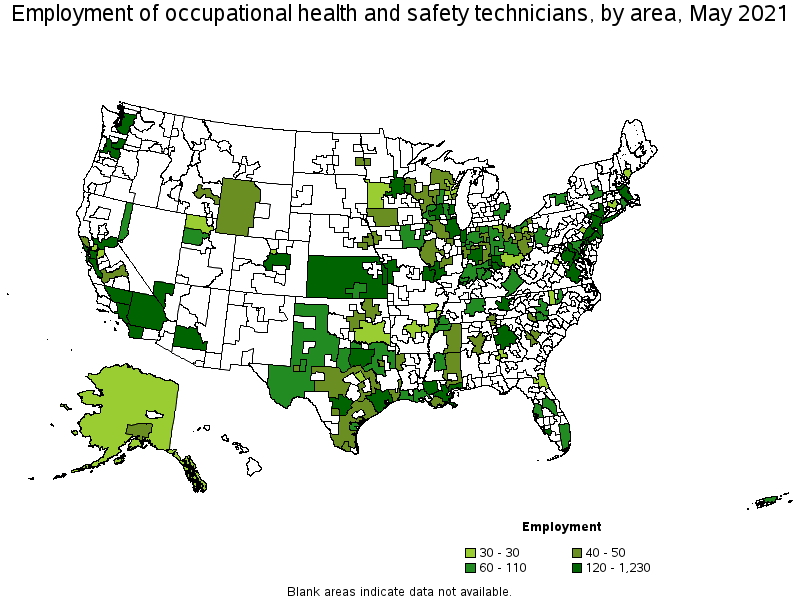
Metropolitan areas with the highest employment level in Occupational Health and Safety Technicians:
| Metropolitan area | Employment (1) | Employment per thousand jobs | Location quotient (9) | Hourly mean wage | Annual mean wage (2) |
|---|---|---|---|---|---|
| Dallas-Fort Worth-Arlington, TX | 1,230 | 0.34 | 2.21 | $ 21.74 | $ 45,210 |
| New York-Newark-Jersey City, NY-NJ-PA | 1,000 | 0.12 | 0.75 | $ 32.02 | $ 66,600 |
| Houston-The Woodlands-Sugar Land, TX | 890 | 0.31 | 1.98 | $ 29.85 | $ 62,090 |
| San Francisco-Oakland-Hayward, CA | 630 | 0.28 | 1.81 | $ 32.00 | $ 66,570 |
| Los Angeles-Long Beach-Anaheim, CA | 610 | 0.11 | 0.69 | $ 27.92 | $ 58,080 |
| Chicago-Naperville-Elgin, IL-IN-WI | 600 | 0.14 | 0.92 | $ 34.21 | $ 71,150 |
| Atlanta-Sandy Springs-Roswell, GA | 480 | 0.19 | 1.21 | $ 33.77 | $ 70,240 |
| San Diego-Carlsbad, CA | 360 | 0.26 | 1.68 | $ 25.96 | $ 53,990 |
| San Antonio-New Braunfels, TX | 310 | 0.31 | 2.02 | $ 20.27 | $ 42,160 |
| Denver-Aurora-Lakewood, CO | 300 | 0.21 | 1.35 | $ 36.44 | $ 75,800 |
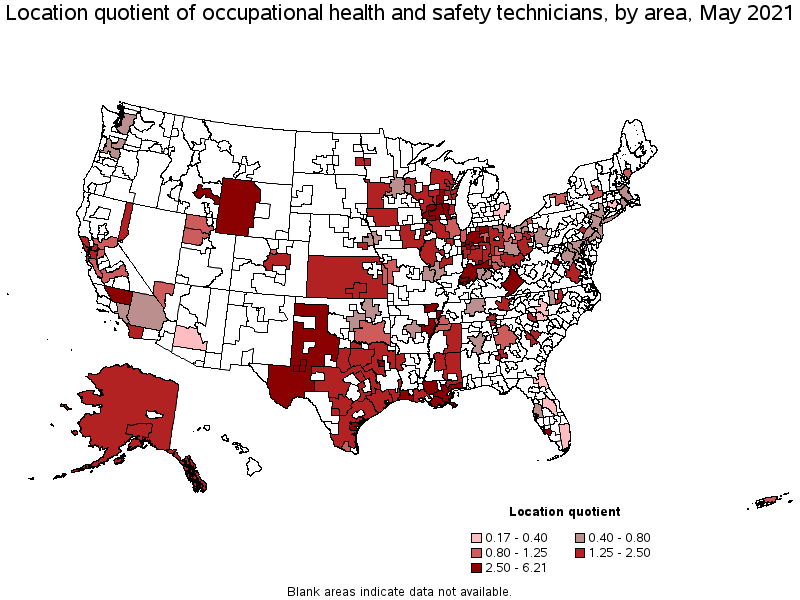
Metropolitan areas with the highest concentration of jobs and location quotients in Occupational Health and Safety Technicians:
| Metropolitan area | Employment (1) | Employment per thousand jobs | Location quotient (9) | Hourly mean wage | Annual mean wage (2) |
|---|---|---|---|---|---|
| Midland, TX | 90 | 0.96 | 6.21 | $ 28.57 | $ 59,430 |
| Gulfport-Biloxi-Pascagoula, MS | 130 | 0.92 | 5.94 | $ 22.30 | $ 46,390 |
| Columbus, IN | 40 | 0.88 | 5.73 | $ 29.67 | $ 61,710 |
| Lake Charles, LA | 70 | 0.81 | 5.23 | $ 21.80 | $ 45,340 |
| Lafayette-West Lafayette, IN | 70 | 0.80 | 5.16 | $ 24.92 | $ 51,840 |
| Odessa, TX | 40 | 0.63 | 4.07 | $ 23.01 | $ 47,850 |
| Houma-Thibodaux, LA | 40 | 0.53 | 3.46 | $ 23.70 | $ 49,290 |
| Cape Coral-Fort Myers, FL | 140 | 0.53 | 3.44 | $ 16.12 | $ 33,530 |
| Evansville, IN-KY | 80 | 0.53 | 3.41 | $ 37.44 | $ 77,880 |
| Corpus Christi, TX | 90 | 0.50 | 3.26 | $ 19.42 | $ 40,400 |
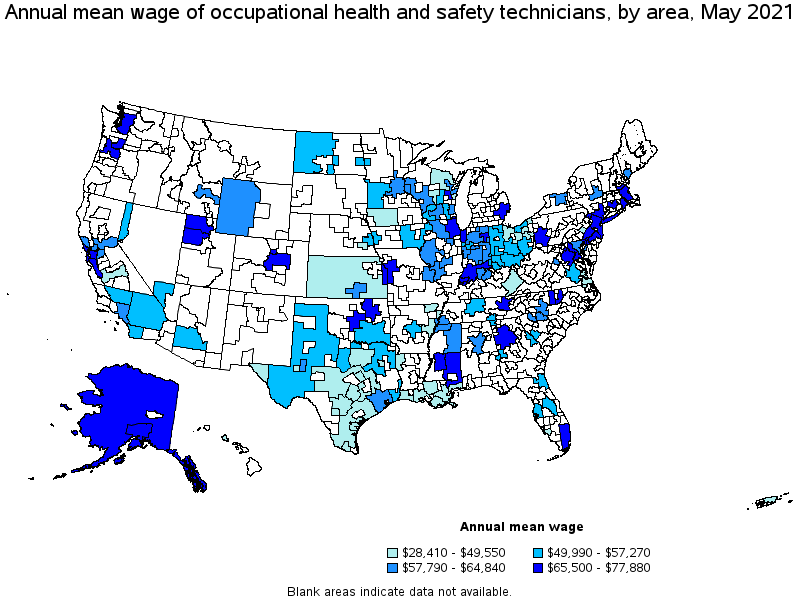
Top paying metropolitan areas for Occupational Health and Safety Technicians:
| Metropolitan area | Employment (1) | Employment per thousand jobs | Location quotient (9) | Hourly mean wage | Annual mean wage (2) |
|---|---|---|---|---|---|
| Evansville, IN-KY | 80 | 0.53 | 3.41 | $ 37.44 | $ 77,880 |
| Anchorage, AK | 50 | 0.32 | 2.05 | $ 37.35 | $ 77,690 |
| Oklahoma City, OK | 40 | 0.06 | 0.41 | $ 37.07 | $ 77,100 |
| Boston-Cambridge-Nashua, MA-NH | 240 | 0.09 | 0.60 | $ 36.74 | $ 76,420 |
| Boulder, CO | 30 | 0.17 | 1.09 | $ 36.61 | $ 76,140 |
| Denver-Aurora-Lakewood, CO | 300 | 0.21 | 1.35 | $ 36.44 | $ 75,800 |
| Ogden-Clearfield, UT | 30 | 0.12 | 0.80 | $ 36.19 | $ 75,270 |
| Appleton, WI | 30 | 0.27 | 1.77 | $ 35.70 | $ 74,260 |
| Seattle-Tacoma-Bellevue, WA | 130 | 0.07 | 0.45 | $ 35.35 | $ 73,530 |
| Jackson, MS | 60 | 0.23 | 1.50 | $ 34.55 | $ 71,850 |
Nonmetropolitan areas with the highest employment in Occupational Health and Safety Technicians:
| Nonmetropolitan area | Employment (1) | Employment per thousand jobs | Location quotient (9) | Hourly mean wage | Annual mean wage (2) |
|---|---|---|---|---|---|
| Kansas nonmetropolitan area | 140 | 0.37 | 2.41 | $ 22.34 | $ 46,470 |
| South Central Wisconsin nonmetropolitan area | 90 | 0.44 | 2.86 | $ 24.78 | $ 51,550 |
| North Texas Region of Texas nonmetropolitan area | 90 | 0.33 | 2.13 | $ 25.43 | $ 52,890 |
| Southern Indiana nonmetropolitan area | 90 | 0.47 | 3.07 | $ 31.49 | $ 65,500 |
| Northern Indiana nonmetropolitan area | 80 | 0.39 | 2.54 | $ 30.17 | $ 62,760 |
Nonmetropolitan areas with the highest concentration of jobs and location quotients in Occupational Health and Safety Technicians:
| Nonmetropolitan area | Employment (1) | Employment per thousand jobs | Location quotient (9) | Hourly mean wage | Annual mean wage (2) |
|---|---|---|---|---|---|
| East Kentucky nonmetropolitan area | 60 | 0.61 | 3.93 | $ 20.04 | $ 41,680 |
| East Arkansas nonmetropolitan area | 30 | 0.53 | 3.41 | $ 23.82 | $ 49,550 |
| Southern Indiana nonmetropolitan area | 90 | 0.47 | 3.07 | $ 31.49 | $ 65,500 |
| Western Wyoming nonmetropolitan area | 40 | 0.47 | 3.03 | $ 28.24 | $ 58,730 |
| South Central Wisconsin nonmetropolitan area | 90 | 0.44 | 2.86 | $ 24.78 | $ 51,550 |
Top paying nonmetropolitan areas for Occupational Health and Safety Technicians:
| Nonmetropolitan area | Employment (1) | Employment per thousand jobs | Location quotient (9) | Hourly mean wage | Annual mean wage (2) |
|---|---|---|---|---|---|
| Southeast Mississippi nonmetropolitan area | 40 | 0.30 | 1.95 | $ 36.82 | $ 76,590 |
| Alaska nonmetropolitan area | 30 | 0.35 | 2.29 | $ 36.76 | $ 76,460 |
| Southern Indiana nonmetropolitan area | 90 | 0.47 | 3.07 | $ 31.49 | $ 65,500 |
| West Central Illinois nonmetropolitan area | 40 | 0.22 | 1.45 | $ 31.04 | $ 64,550 |
| Northern Indiana nonmetropolitan area | 80 | 0.39 | 2.54 | $ 30.17 | $ 62,760 |
These estimates are calculated with data collected from employers in all industry sectors, all metropolitan and nonmetropolitan areas, and all states and the District of Columbia. The top employment and wage figures are provided above. The complete list is available in the downloadable XLS files.
The percentile wage estimate is the value of a wage below which a certain percent of workers fall. The median wage is the 50th percentile wage estimate—50 percent of workers earn less than the median and 50 percent of workers earn more than the median. More about percentile wages.
(1) Estimates for detailed occupations do not sum to the totals because the totals include occupations not shown separately. Estimates do not include self-employed workers.
(2) Annual wages have been calculated by multiplying the hourly mean wage by a "year-round, full-time" hours figure of 2,080 hours; for those occupations where there is not an hourly wage published, the annual wage has been directly calculated from the reported survey data.
(3) The relative standard error (RSE) is a measure of the reliability of a survey statistic. The smaller the relative standard error, the more precise the estimate.
(8) Estimate not released.
(9) The location quotient is the ratio of the area concentration of occupational employment to the national average concentration. A location quotient greater than one indicates the occupation has a higher share of employment than average, and a location quotient less than one indicates the occupation is less prevalent in the area than average.
Other OEWS estimates and related information:
May 2021 National Occupational Employment and Wage Estimates
May 2021 State Occupational Employment and Wage Estimates
May 2021 Metropolitan and Nonmetropolitan Area Occupational Employment and Wage Estimates
May 2021 National Industry-Specific Occupational Employment and Wage Estimates
Last Modified Date: March 31, 2022