
An official website of the United States government
An official website of the United States government
The .gov means it's official.
Federal government websites often end in .gov or .mil. Before sharing sensitive information,
make sure you're on a federal government site.
The site is secure.
The
https:// ensures that you are connecting to the official website and that any
information you provide is encrypted and transmitted securely.
Provide individuals, families, and groups with the psychosocial support needed to cope with chronic, acute, or terminal illnesses. Services include advising family caregivers. Provide patients with information and counseling, and make referrals for other services. May also provide case and care management or interventions designed to promote health, prevent disease, and address barriers to access to healthcare.
Employment estimate and mean wage estimates for Healthcare Social Workers:
| Employment (1) | Employment RSE (3) |
Mean hourly wage |
Mean annual wage (2) |
Wage RSE (3) |
|---|---|---|---|---|
| 173,860 | 1.2 % | $ 29.96 | $ 62,310 | 0.5 % |
Percentile wage estimates for Healthcare Social Workers:
| Percentile | 10% | 25% | 50% (Median) |
75% | 90% |
|---|---|---|---|---|---|
| Hourly Wage | $ 18.09 | $ 22.90 | $ 29.25 | $ 36.98 | $ 41.74 |
| Annual Wage (2) | $ 37,630 | $ 47,630 | $ 60,840 | $ 76,920 | $ 86,820 |
Industries with the highest published employment and wages for Healthcare Social Workers are provided. For a list of all industries with employment in Healthcare Social Workers, see the Create Customized Tables function.
Industries with the highest levels of employment in Healthcare Social Workers:
| Industry | Employment (1) | Percent of industry employment | Hourly mean wage | Annual mean wage (2) |
|---|---|---|---|---|
| General Medical and Surgical Hospitals | 43,120 | 0.77 | $ 34.35 | $ 71,440 |
| Individual and Family Services | 22,040 | 0.83 | $ 24.47 | $ 50,910 |
| Home Health Care Services | 21,350 | 1.41 | $ 32.29 | $ 67,150 |
| Nursing Care Facilities (Skilled Nursing Facilities) | 13,510 | 0.96 | $ 26.69 | $ 55,510 |
| Outpatient Care Centers | 13,480 | 1.37 | $ 31.30 | $ 65,090 |
Industries with the highest concentration of employment in Healthcare Social Workers:
| Industry | Employment (1) | Percent of industry employment | Hourly mean wage | Annual mean wage (2) |
|---|---|---|---|---|
| Home Health Care Services | 21,350 | 1.41 | $ 32.29 | $ 67,150 |
| Outpatient Care Centers | 13,480 | 1.37 | $ 31.30 | $ 65,090 |
| Community Food and Housing, and Emergency and Other Relief Services | 2,250 | 1.18 | $ 22.29 | $ 46,370 |
| Psychiatric and Substance Abuse Hospitals | 2,420 | 1.01 | $ 28.76 | $ 59,820 |
| Nursing Care Facilities (Skilled Nursing Facilities) | 13,510 | 0.96 | $ 26.69 | $ 55,510 |
Top paying industries for Healthcare Social Workers:
| Industry | Employment (1) | Percent of industry employment | Hourly mean wage | Annual mean wage (2) |
|---|---|---|---|---|
| Scientific Research and Development Services | 130 | 0.02 | $ 44.73 | $ 93,030 |
| Offices of Dentists | (8) | (8) | $ 38.87 | $ 80,860 |
| Insurance Carriers | 5,260 | 0.44 | $ 34.78 | $ 72,330 |
| Specialty (except Psychiatric and Substance Abuse) Hospitals | 2,530 | 0.94 | $ 34.48 | $ 71,710 |
| General Medical and Surgical Hospitals | 43,120 | 0.77 | $ 34.35 | $ 71,440 |
States and areas with the highest published employment, location quotients, and wages for Healthcare Social Workers are provided. For a list of all areas with employment in Healthcare Social Workers, see the Create Customized Tables function.
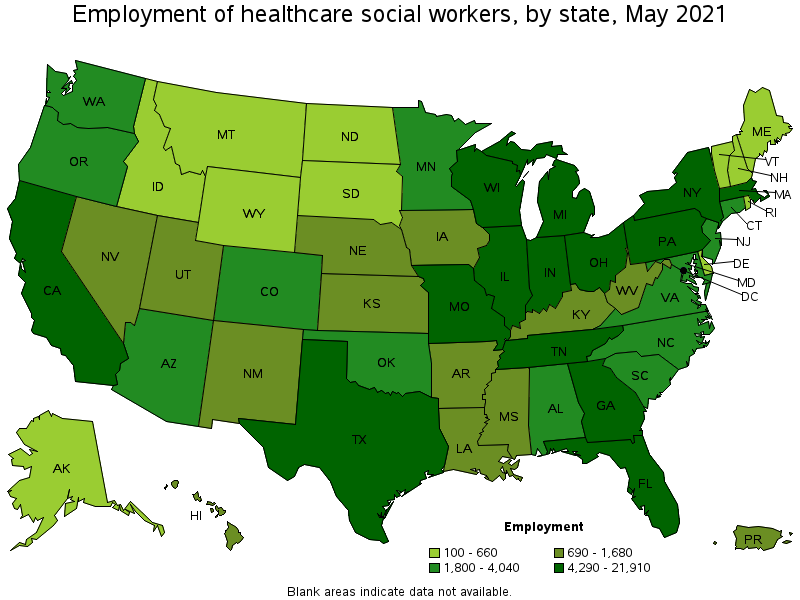
States with the highest employment level in Healthcare Social Workers:
| State | Employment (1) | Employment per thousand jobs | Location quotient (9) | Hourly mean wage | Annual mean wage (2) |
|---|---|---|---|---|---|
| New York | 21,910 | 2.53 | 2.05 | $ 29.66 | $ 61,680 |
| California | 13,050 | 0.79 | 0.64 | $ 40.72 | $ 84,690 |
| Texas | 11,550 | 0.94 | 0.77 | $ 31.17 | $ 64,840 |
| Massachusetts | 10,830 | 3.19 | 2.58 | $ 30.89 | $ 64,250 |
| Florida | 9,010 | 1.05 | 0.85 | $ 28.09 | $ 58,420 |
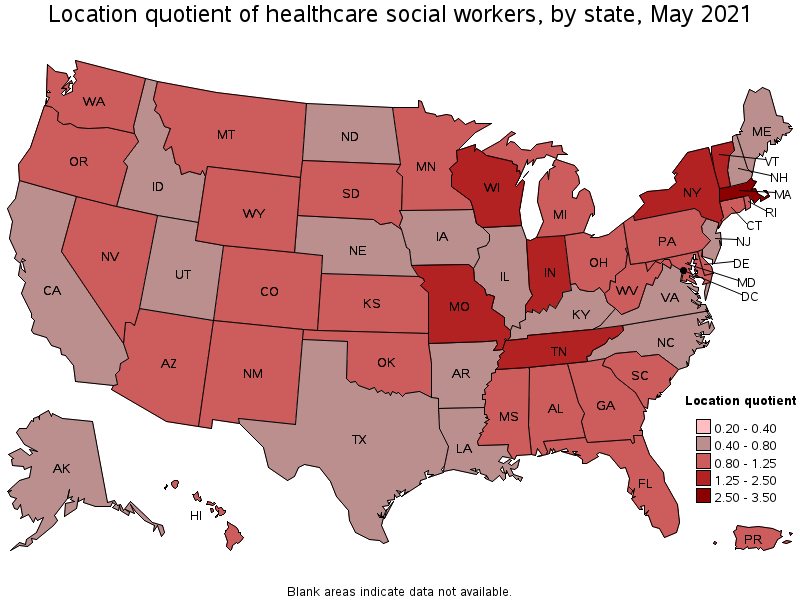
States with the highest concentration of jobs and location quotients in Healthcare Social Workers:
| State | Employment (1) | Employment per thousand jobs | Location quotient (9) | Hourly mean wage | Annual mean wage (2) |
|---|---|---|---|---|---|
| Massachusetts | 10,830 | 3.19 | 2.58 | $ 30.89 | $ 64,250 |
| New York | 21,910 | 2.53 | 2.05 | $ 29.66 | $ 61,680 |
| Tennessee | 7,440 | 2.49 | 2.02 | $ 25.44 | $ 52,920 |
| Vermont | 530 | 1.87 | 1.51 | $ 27.42 | $ 57,020 |
| Missouri | 5,010 | 1.84 | 1.49 | $ 24.69 | $ 51,340 |
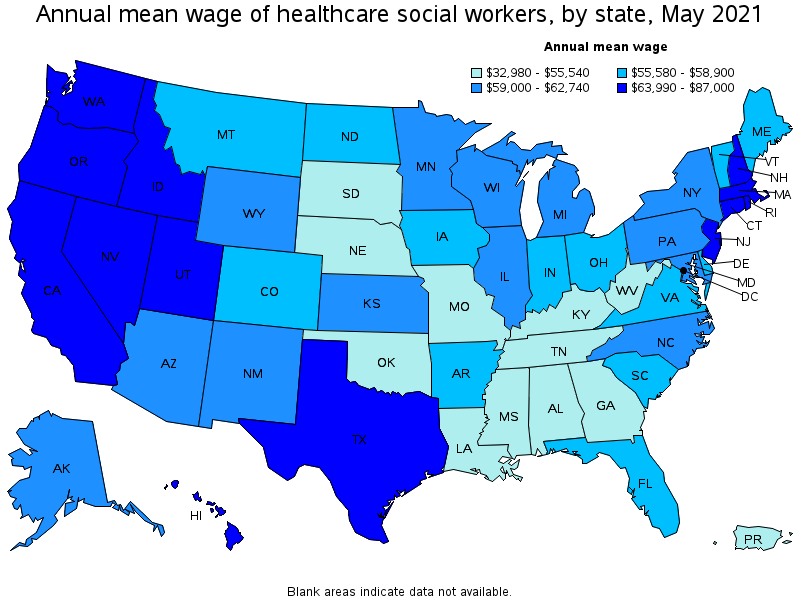
Top paying states for Healthcare Social Workers:
| State | Employment (1) | Employment per thousand jobs | Location quotient (9) | Hourly mean wage | Annual mean wage (2) |
|---|---|---|---|---|---|
| District of Columbia | 370 | 0.55 | 0.45 | $ 41.83 | $ 87,000 |
| California | 13,050 | 0.79 | 0.64 | $ 40.72 | $ 84,690 |
| Oregon | 1,830 | 1.00 | 0.81 | $ 38.40 | $ 79,870 |
| Hawaii | 690 | 1.25 | 1.01 | $ 35.56 | $ 73,960 |
| Rhode Island | 620 | 1.36 | 1.10 | $ 35.21 | $ 73,230 |
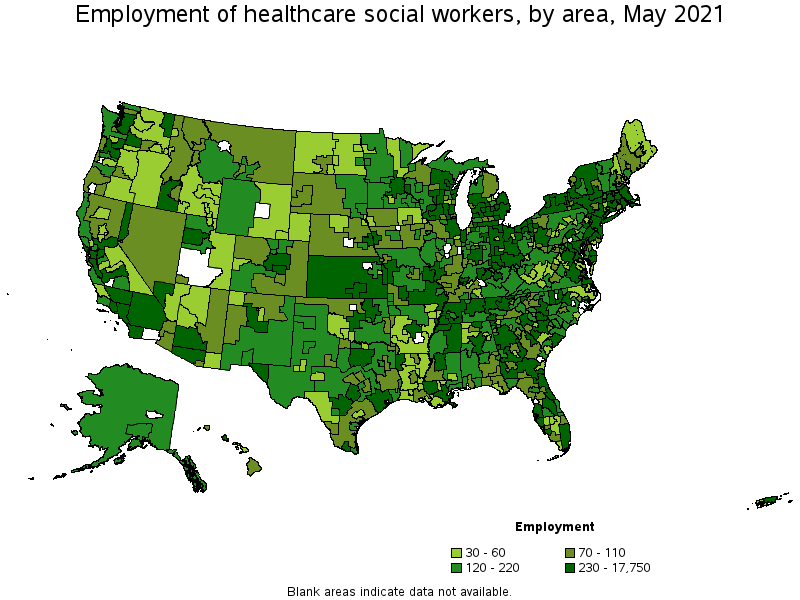
Metropolitan areas with the highest employment level in Healthcare Social Workers:
| Metropolitan area | Employment (1) | Employment per thousand jobs | Location quotient (9) | Hourly mean wage | Annual mean wage (2) |
|---|---|---|---|---|---|
| New York-Newark-Jersey City, NY-NJ-PA | 17,750 | 2.04 | 1.66 | $ 31.68 | $ 65,890 |
| Boston-Cambridge-Nashua, MA-NH | 6,150 | 2.38 | 1.93 | $ 31.94 | $ 66,440 |
| Los Angeles-Long Beach-Anaheim, CA | 4,320 | 0.76 | 0.61 | $ 39.26 | $ 81,660 |
| Chicago-Naperville-Elgin, IL-IN-WI | 3,710 | 0.88 | 0.71 | $ 30.22 | $ 62,870 |
| Dallas-Fort Worth-Arlington, TX | 3,240 | 0.90 | 0.73 | $ 32.22 | $ 67,020 |
| Philadelphia-Camden-Wilmington, PA-NJ-DE-MD | 3,210 | 1.21 | 0.98 | $ 31.17 | $ 64,820 |
| Miami-Fort Lauderdale-West Palm Beach, FL | 2,860 | 1.17 | 0.95 | $ 29.91 | $ 62,210 |
| Houston-The Woodlands-Sugar Land, TX | 2,690 | 0.93 | 0.75 | $ 31.32 | $ 65,140 |
| Phoenix-Mesa-Scottsdale, AZ | 2,640 | 1.25 | 1.01 | $ 29.78 | $ 61,950 |
| Nashville-Davidson--Murfreesboro--Franklin, TN | 2,540 | 2.60 | 2.11 | $ 26.88 | $ 55,910 |
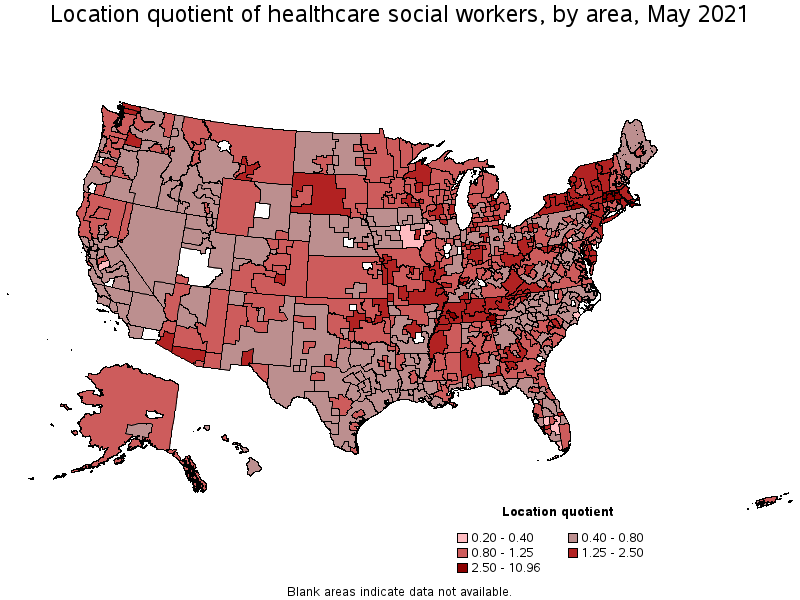
Metropolitan areas with the highest concentration of jobs and location quotients in Healthcare Social Workers:
| Metropolitan area | Employment (1) | Employment per thousand jobs | Location quotient (9) | Hourly mean wage | Annual mean wage (2) |
|---|---|---|---|---|---|
| New Bedford, MA | 840 | 13.53 | 10.96 | $ 31.76 | $ 66,060 |
| Springfield, MA-CT | 1,690 | 5.50 | 4.45 | $ 26.58 | $ 55,290 |
| Pittsfield, MA | 180 | 4.82 | 3.91 | $ 26.26 | $ 54,620 |
| Leominster-Gardner, MA | 200 | 4.02 | 3.25 | $ 28.27 | $ 58,800 |
| Worcester, MA-CT | 1,020 | 3.79 | 3.07 | $ 31.71 | $ 65,950 |
| Chattanooga, TN-GA | 840 | 3.41 | 2.77 | $ 28.49 | $ 59,250 |
| Binghamton, NY | 280 | 3.11 | 2.52 | $ 22.86 | $ 47,560 |
| Jackson, TN | 200 | 3.08 | 2.50 | $ 22.45 | $ 46,690 |
| Johnson City, TN | 230 | 2.97 | 2.41 | $ 21.57 | $ 44,870 |
| Ann Arbor, MI | 600 | 2.97 | 2.41 | $ 31.97 | $ 66,500 |
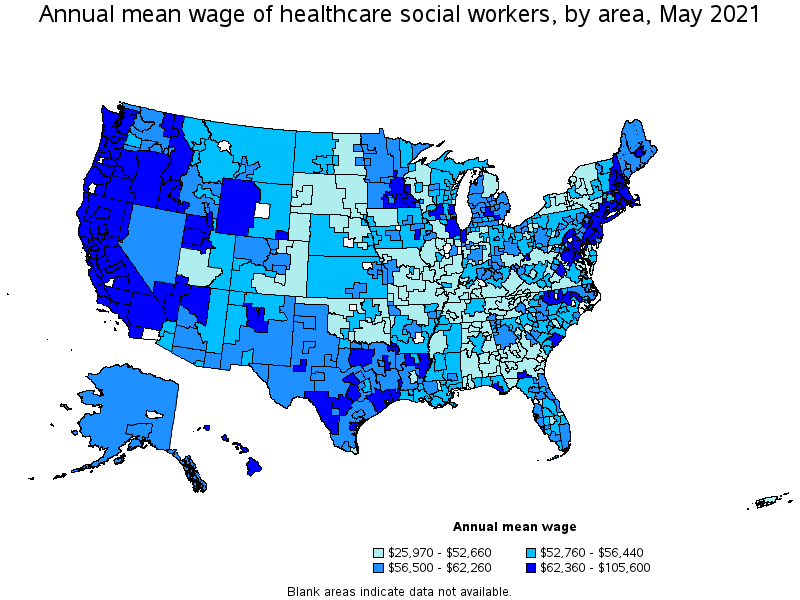
Top paying metropolitan areas for Healthcare Social Workers:
| Metropolitan area | Employment (1) | Employment per thousand jobs | Location quotient (9) | Hourly mean wage | Annual mean wage (2) |
|---|---|---|---|---|---|
| San Jose-Sunnyvale-Santa Clara, CA | 720 | 0.67 | 0.54 | $ 50.77 | $ 105,600 |
| Santa Rosa, CA | 150 | 0.79 | 0.64 | $ 48.51 | $ 100,890 |
| San Francisco-Oakland-Hayward, CA | 1,920 | 0.85 | 0.69 | $ 47.28 | $ 98,340 |
| Vallejo-Fairfield, CA | 120 | 0.93 | 0.76 | $ 46.23 | $ 96,170 |
| Sacramento--Roseville--Arden-Arcade, CA | 880 | 0.89 | 0.72 | $ 43.88 | $ 91,270 |
| Salinas, CA | 120 | 0.70 | 0.57 | $ 43.67 | $ 90,840 |
| Yuba City, CA | 40 | 0.84 | 0.68 | $ 42.55 | $ 88,510 |
| Modesto, CA | 190 | 1.05 | 0.85 | $ 42.25 | $ 87,880 |
| Napa, CA | 50 | 0.79 | 0.64 | $ 40.32 | $ 83,860 |
| Fresno, CA | 280 | 0.75 | 0.60 | $ 39.35 | $ 81,840 |
Nonmetropolitan areas with the highest employment in Healthcare Social Workers:
| Nonmetropolitan area | Employment (1) | Employment per thousand jobs | Location quotient (9) | Hourly mean wage | Annual mean wage (2) |
|---|---|---|---|---|---|
| Kansas nonmetropolitan area | 410 | 1.09 | 0.89 | $ 25.69 | $ 53,420 |
| Central East New York nonmetropolitan area | 360 | 2.37 | 1.92 | $ 24.92 | $ 51,830 |
| Middle Georgia nonmetropolitan area | 340 | 2.70 | 2.19 | $ 19.35 | $ 40,240 |
| Southeast Missouri nonmetropolitan area | 310 | 1.98 | 1.60 | $ 21.64 | $ 45,000 |
| West Tennessee nonmetropolitan area | 280 | 2.20 | 1.78 | $ 22.61 | $ 47,020 |
Nonmetropolitan areas with the highest concentration of jobs and location quotients in Healthcare Social Workers:
| Nonmetropolitan area | Employment (1) | Employment per thousand jobs | Location quotient (9) | Hourly mean wage | Annual mean wage (2) |
|---|---|---|---|---|---|
| Massachusetts nonmetropolitan area | 240 | 4.20 | 3.41 | $ 38.39 | $ 79,860 |
| Middle Georgia nonmetropolitan area | 340 | 2.70 | 2.19 | $ 19.35 | $ 40,240 |
| Central East New York nonmetropolitan area | 360 | 2.37 | 1.92 | $ 24.92 | $ 51,830 |
| North Central Tennessee nonmetropolitan area | 240 | 2.24 | 1.81 | $ 22.45 | $ 46,700 |
| Maryland nonmetropolitan area | 130 | 2.22 | 1.80 | $ 23.56 | $ 49,000 |
Top paying nonmetropolitan areas for Healthcare Social Workers:
| Nonmetropolitan area | Employment (1) | Employment per thousand jobs | Location quotient (9) | Hourly mean wage | Annual mean wage (2) |
|---|---|---|---|---|---|
| Massachusetts nonmetropolitan area | 240 | 4.20 | 3.41 | $ 38.39 | $ 79,860 |
| West Central-Southwest New Hampshire nonmetropolitan area | 130 | 1.33 | 1.07 | $ 35.23 | $ 73,280 |
| North Valley-Northern Mountains Region of California nonmetropolitan area | 100 | 1.00 | 0.81 | $ 34.54 | $ 71,850 |
| Coast Oregon nonmetropolitan area | 100 | 0.88 | 0.71 | $ 34.37 | $ 71,490 |
| North Coast Region of California nonmetropolitan area | 150 | 1.51 | 1.23 | $ 34.28 | $ 71,300 |
These estimates are calculated with data collected from employers in all industry sectors, all metropolitan and nonmetropolitan areas, and all states and the District of Columbia. The top employment and wage figures are provided above. The complete list is available in the downloadable XLS files.
The percentile wage estimate is the value of a wage below which a certain percent of workers fall. The median wage is the 50th percentile wage estimate—50 percent of workers earn less than the median and 50 percent of workers earn more than the median. More about percentile wages.
(1) Estimates for detailed occupations do not sum to the totals because the totals include occupations not shown separately. Estimates do not include self-employed workers.
(2) Annual wages have been calculated by multiplying the hourly mean wage by a "year-round, full-time" hours figure of 2,080 hours; for those occupations where there is not an hourly wage published, the annual wage has been directly calculated from the reported survey data.
(3) The relative standard error (RSE) is a measure of the reliability of a survey statistic. The smaller the relative standard error, the more precise the estimate.
(8) Estimate not released.
(9) The location quotient is the ratio of the area concentration of occupational employment to the national average concentration. A location quotient greater than one indicates the occupation has a higher share of employment than average, and a location quotient less than one indicates the occupation is less prevalent in the area than average.
Other OEWS estimates and related information:
May 2021 National Occupational Employment and Wage Estimates
May 2021 State Occupational Employment and Wage Estimates
May 2021 Metropolitan and Nonmetropolitan Area Occupational Employment and Wage Estimates
May 2021 National Industry-Specific Occupational Employment and Wage Estimates
Last Modified Date: March 31, 2022