
An official website of the United States government
An official website of the United States government
The .gov means it's official.
Federal government websites often end in .gov or .mil. Before sharing sensitive information,
make sure you're on a federal government site.
The site is secure.
The
https:// ensures that you are connecting to the official website and that any
information you provide is encrypted and transmitted securely.
Assist other social and human service providers in providing client services in a wide variety of fields, such as psychology, rehabilitation, or social work, including support for families. May assist clients in identifying and obtaining available benefits and social and community services. May assist social workers with developing, organizing, and conducting programs to prevent and resolve problems relevant to substance abuse, human relationships, rehabilitation, or dependent care. Excludes �Rehabilitation Counselors� (21-1015), �Psychiatric Technicians� (29-2053), �Personal Care Aides� (31-1122), and �Eligibility Interviewers, Government Programs� (43-4061).
Employment estimate and mean wage estimates for Social and Human Service Assistants:
| Employment (1) | Employment RSE (3) |
Mean hourly wage |
Mean annual wage (2) |
Wage RSE (3) |
|---|---|---|---|---|
| 398,380 | 1.0 % | $ 19.45 | $ 40,460 | 0.5 % |
Percentile wage estimates for Social and Human Service Assistants:
| Percentile | 10% | 25% | 50% (Median) |
75% | 90% |
|---|---|---|---|---|---|
| Hourly Wage | $ 13.42 | $ 14.64 | $ 18.08 | $ 22.58 | $ 28.60 |
| Annual Wage (2) | $ 27,910 | $ 30,440 | $ 37,610 | $ 46,960 | $ 59,490 |
Industries with the highest published employment and wages for Social and Human Service Assistants are provided. For a list of all industries with employment in Social and Human Service Assistants, see the Create Customized Tables function.
Industries with the highest levels of employment in Social and Human Service Assistants:
| Industry | Employment (1) | Percent of industry employment | Hourly mean wage | Annual mean wage (2) |
|---|---|---|---|---|
| Individual and Family Services | 116,000 | 4.37 | $ 18.95 | $ 39,420 |
| Local Government, excluding schools and hospitals (OEWS Designation) | 47,310 | 0.88 | $ 23.10 | $ 48,040 |
| State Government, excluding schools and hospitals (OEWS Designation) | 38,270 | 1.74 | $ 20.05 | $ 41,700 |
| Residential Intellectual and Developmental Disability, Mental Health, and Substance Abuse Facilities | 31,670 | 5.17 | $ 16.80 | $ 34,950 |
| Community Food and Housing, and Emergency and Other Relief Services | 28,520 | 15.00 | $ 17.65 | $ 36,710 |
Industries with the highest concentration of employment in Social and Human Service Assistants:
| Industry | Employment (1) | Percent of industry employment | Hourly mean wage | Annual mean wage (2) |
|---|---|---|---|---|
| Community Food and Housing, and Emergency and Other Relief Services | 28,520 | 15.00 | $ 17.65 | $ 36,710 |
| Other Residential Care Facilities | 10,930 | 7.24 | $ 16.30 | $ 33,900 |
| Social Advocacy Organizations | 15,530 | 6.94 | $ 19.33 | $ 40,200 |
| Residential Intellectual and Developmental Disability, Mental Health, and Substance Abuse Facilities | 31,670 | 5.17 | $ 16.80 | $ 34,950 |
| Vocational Rehabilitation Services | 12,160 | 4.55 | $ 17.15 | $ 35,670 |
Top paying industries for Social and Human Service Assistants:
| Industry | Employment (1) | Percent of industry employment | Hourly mean wage | Annual mean wage (2) |
|---|---|---|---|---|
| Miscellaneous Store Retailers (4532 and 4533 only) | 230 | 0.06 | $ 25.63 | $ 53,320 |
| Technical and Trade Schools | 30 | 0.03 | $ 25.10 | $ 52,220 |
| Insurance Carriers | 1,130 | 0.09 | $ 24.54 | $ 51,050 |
| Federal Executive Branch (OEWS Designation) | 1,340 | 0.06 | $ 24.31 | $ 50,570 |
| Specialty (except Psychiatric and Substance Abuse) Hospitals | 470 | 0.17 | $ 23.88 | $ 49,670 |
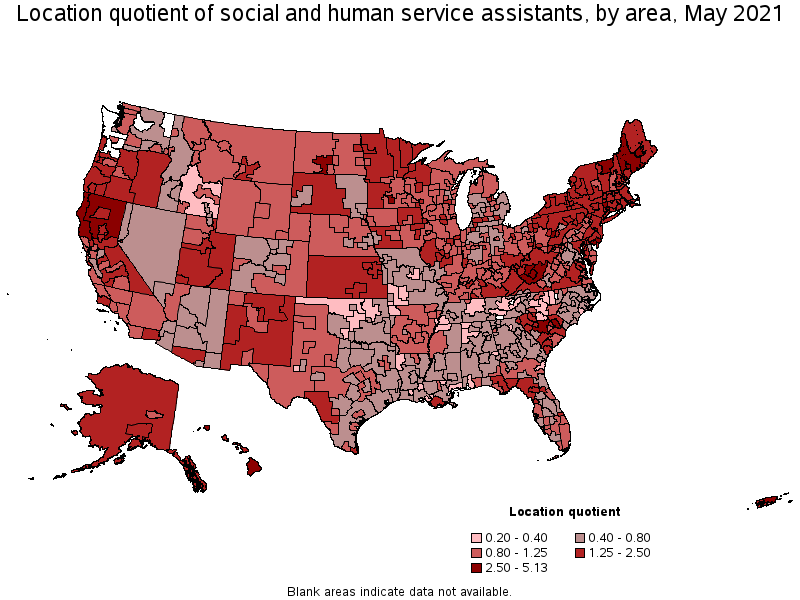
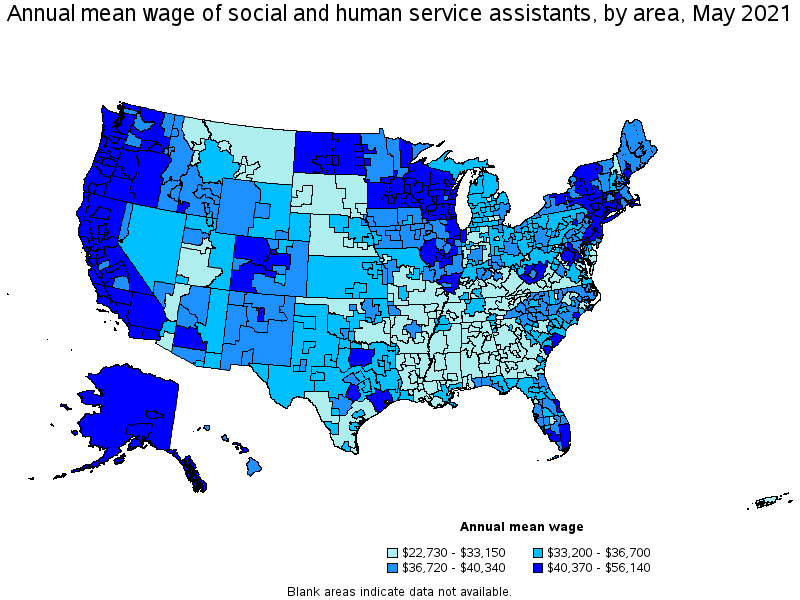
States and areas with the highest published employment, location quotients, and wages for Social and Human Service Assistants are provided. For a list of all areas with employment in Social and Human Service Assistants, see the Create Customized Tables function.
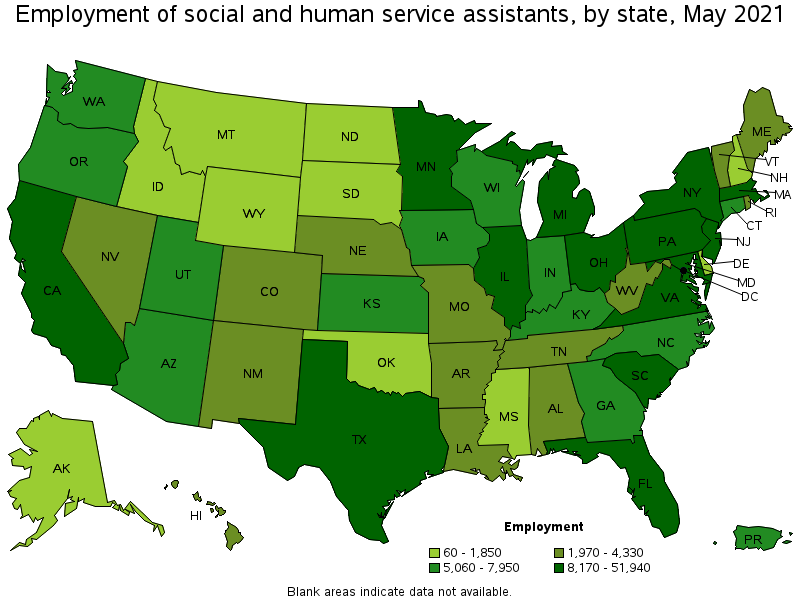
States with the highest employment level in Social and Human Service Assistants:
| State | Employment (1) | Employment per thousand jobs | Location quotient (9) | Hourly mean wage | Annual mean wage (2) |
|---|---|---|---|---|---|
| California | 51,940 | 3.14 | 1.11 | $ 23.26 | $ 48,380 |
| New York | 34,130 | 3.94 | 1.39 | $ 20.46 | $ 42,550 |
| New Jersey | 22,990 | 5.97 | 2.11 | $ 19.91 | $ 41,410 |
| Texas | 21,770 | 1.78 | 0.63 | $ 19.05 | $ 39,630 |
| Florida | 20,150 | 2.34 | 0.83 | $ 18.85 | $ 39,220 |
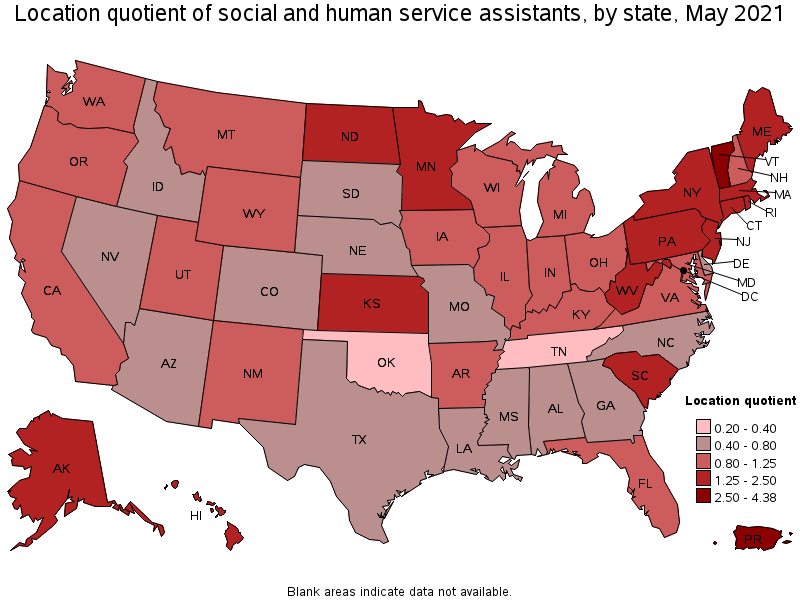
States with the highest concentration of jobs and location quotients in Social and Human Service Assistants:
| State | Employment (1) | Employment per thousand jobs | Location quotient (9) | Hourly mean wage | Annual mean wage (2) |
|---|---|---|---|---|---|
| Vermont | 3,520 | 12.38 | 4.38 | $ 16.94 | $ 35,240 |
| Rhode Island | 3,180 | 6.95 | 2.46 | $ 19.26 | $ 40,070 |
| Maine | 3,980 | 6.73 | 2.38 | $ 18.94 | $ 39,400 |
| West Virginia | 4,160 | 6.33 | 2.24 | $ 18.18 | $ 37,810 |
| New Jersey | 22,990 | 5.97 | 2.11 | $ 19.91 | $ 41,410 |
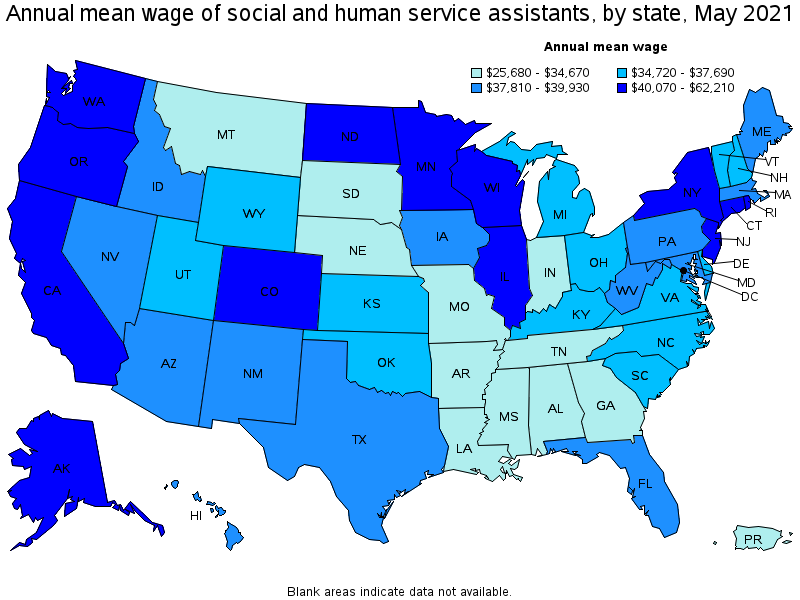
Top paying states for Social and Human Service Assistants:
| State | Employment (1) | Employment per thousand jobs | Location quotient (9) | Hourly mean wage | Annual mean wage (2) |
|---|---|---|---|---|---|
| District of Columbia | 900 | 1.36 | 0.48 | $ 29.91 | $ 62,210 |
| Connecticut | 7,950 | 5.05 | 1.79 | $ 24.75 | $ 51,480 |
| California | 51,940 | 3.14 | 1.11 | $ 23.26 | $ 48,380 |
| North Dakota | 1,550 | 3.92 | 1.39 | $ 22.66 | $ 47,140 |
| Alaska | 1,200 | 4.04 | 1.43 | $ 21.92 | $ 45,590 |
Metropolitan areas with the highest employment level in Social and Human Service Assistants:
| Metropolitan area | Employment (1) | Employment per thousand jobs | Location quotient (9) | Hourly mean wage | Annual mean wage (2) |
|---|---|---|---|---|---|
| New York-Newark-Jersey City, NY-NJ-PA | 34,400 | 3.96 | 1.40 | $ 20.79 | $ 43,240 |
| Los Angeles-Long Beach-Anaheim, CA | 19,000 | 3.32 | 1.17 | $ 23.35 | $ 48,560 |
| Philadelphia-Camden-Wilmington, PA-NJ-DE-MD | 12,240 | 4.61 | 1.63 | $ 19.98 | $ 41,560 |
| Boston-Cambridge-Nashua, MA-NH | 10,240 | 3.96 | 1.40 | $ 18.30 | $ 38,070 |
| Chicago-Naperville-Elgin, IL-IN-WI | 9,750 | 2.30 | 0.81 | $ 21.19 | $ 44,080 |
| San Francisco-Oakland-Hayward, CA | 7,340 | 3.27 | 1.16 | $ 25.24 | $ 52,500 |
| Minneapolis-St. Paul-Bloomington, MN-WI | 6,130 | 3.36 | 1.19 | $ 20.80 | $ 43,260 |
| Washington-Arlington-Alexandria, DC-VA-MD-WV | 5,810 | 1.98 | 0.70 | $ 22.07 | $ 45,900 |
| Miami-Fort Lauderdale-West Palm Beach, FL | 5,750 | 2.34 | 0.83 | $ 19.94 | $ 41,480 |
| Dallas-Fort Worth-Arlington, TX | 5,130 | 1.43 | 0.51 | $ 20.30 | $ 42,230 |
Metropolitan areas with the highest concentration of jobs and location quotients in Social and Human Service Assistants:
| Metropolitan area | Employment (1) | Employment per thousand jobs | Location quotient (9) | Hourly mean wage | Annual mean wage (2) |
|---|---|---|---|---|---|
| Vineland-Bridgeton, NJ | 740 | 12.63 | 4.46 | $ 17.50 | $ 36,390 |
| Johnstown, PA | 600 | 12.56 | 4.44 | $ 17.85 | $ 37,120 |
| Mankato-North Mankato, MN | 550 | 10.64 | 3.76 | $ 23.62 | $ 49,120 |
| Florence, SC | 880 | 10.40 | 3.68 | $ 17.22 | $ 35,830 |
| Beckley, WV | 410 | 10.25 | 3.62 | $ 18.66 | $ 38,810 |
| Bangor, ME | 620 | 9.93 | 3.51 | $ 18.69 | $ 38,880 |
| Trenton, NJ | 2,130 | 9.36 | 3.31 | $ 21.39 | $ 44,490 |
| Waterbury, CT | 560 | 8.69 | 3.07 | $ 19.59 | $ 40,750 |
| Bismarck, ND | 570 | 8.16 | 2.89 | $ 24.04 | $ 50,000 |
| Atlantic City-Hammonton, NJ | 910 | 7.83 | 2.77 | $ 18.31 | $ 38,090 |
Top paying metropolitan areas for Social and Human Service Assistants:
| Metropolitan area | Employment (1) | Employment per thousand jobs | Location quotient (9) | Hourly mean wage | Annual mean wage (2) |
|---|---|---|---|---|---|
| Hartford-West Hartford-East Hartford, CT | 3,100 | 5.70 | 2.02 | $ 26.99 | $ 56,140 |
| Danbury, CT | 370 | 5.15 | 1.82 | $ 26.38 | $ 54,870 |
| San Jose-Sunnyvale-Santa Clara, CA | 1,770 | 1.66 | 0.59 | $ 26.25 | $ 54,590 |
| Norwich-New London-Westerly, CT-RI | 650 | 5.61 | 1.98 | $ 26.02 | $ 54,120 |
| San Francisco-Oakland-Hayward, CA | 7,340 | 3.27 | 1.16 | $ 25.24 | $ 52,500 |
| Janesville-Beloit, WI | 300 | 4.65 | 1.65 | $ 24.46 | $ 50,880 |
| Sacramento--Roseville--Arden-Arcade, CA | 3,540 | 3.60 | 1.27 | $ 24.36 | $ 50,660 |
| Carson City, NV | 150 | 5.00 | 1.77 | $ 24.35 | $ 50,650 |
| Yuba City, CA | 240 | 5.04 | 1.78 | $ 24.34 | $ 50,620 |
| Santa Cruz-Watsonville, CA | 400 | 4.34 | 1.53 | $ 24.25 | $ 50,430 |
Nonmetropolitan areas with the highest employment in Social and Human Service Assistants:
| Nonmetropolitan area | Employment (1) | Employment per thousand jobs | Location quotient (9) | Hourly mean wage | Annual mean wage (2) |
|---|---|---|---|---|---|
| Kansas nonmetropolitan area | 1,620 | 4.31 | 1.53 | $ 16.17 | $ 33,630 |
| Southwest Maine nonmetropolitan area | 1,370 | 7.50 | 2.65 | $ 18.54 | $ 38,560 |
| Northwest Minnesota nonmetropolitan area | 1,020 | 5.60 | 1.98 | $ 19.32 | $ 40,190 |
| Southern West Virginia nonmetropolitan area | 970 | 14.51 | 5.13 | $ 19.67 | $ 40,920 |
| Southern Pennsylvania nonmetropolitan area | 950 | 5.30 | 1.88 | $ 17.57 | $ 36,550 |
Nonmetropolitan areas with the highest concentration of jobs and location quotients in Social and Human Service Assistants:
| Nonmetropolitan area | Employment (1) | Employment per thousand jobs | Location quotient (9) | Hourly mean wage | Annual mean wage (2) |
|---|---|---|---|---|---|
| Southern West Virginia nonmetropolitan area | 970 | 14.51 | 5.13 | $ 19.67 | $ 40,920 |
| North Valley-Northern Mountains Region of California nonmetropolitan area | 880 | 9.03 | 3.19 | $ 26.62 | $ 55,360 |
| Connecticut nonmetropolitan area | 260 | 8.17 | 2.89 | $ 22.52 | $ 46,850 |
| Hawaii / Kauai nonmetropolitan area | 670 | 7.56 | 2.68 | $ 17.82 | $ 37,060 |
| Southwest Maine nonmetropolitan area | 1,370 | 7.50 | 2.65 | $ 18.54 | $ 38,560 |
Top paying nonmetropolitan areas for Social and Human Service Assistants:
| Nonmetropolitan area | Employment (1) | Employment per thousand jobs | Location quotient (9) | Hourly mean wage | Annual mean wage (2) |
|---|---|---|---|---|---|
| North Valley-Northern Mountains Region of California nonmetropolitan area | 880 | 9.03 | 3.19 | $ 26.62 | $ 55,360 |
| West North Dakota nonmetropolitan area | 280 | 2.63 | 0.93 | $ 23.95 | $ 49,820 |
| West Central Illinois nonmetropolitan area | 750 | 4.73 | 1.67 | $ 23.51 | $ 48,890 |
| Connecticut nonmetropolitan area | 260 | 8.17 | 2.89 | $ 22.52 | $ 46,850 |
| Alaska nonmetropolitan area | 500 | 5.13 | 1.81 | $ 22.40 | $ 46,600 |
These estimates are calculated with data collected from employers in all industry sectors, all metropolitan and nonmetropolitan areas, and all states and the District of Columbia. The top employment and wage figures are provided above. The complete list is available in the downloadable XLS files.
The percentile wage estimate is the value of a wage below which a certain percent of workers fall. The median wage is the 50th percentile wage estimate—50 percent of workers earn less than the median and 50 percent of workers earn more than the median. More about percentile wages.
(1) Estimates for detailed occupations do not sum to the totals because the totals include occupations not shown separately. Estimates do not include self-employed workers.
(2) Annual wages have been calculated by multiplying the hourly mean wage by a "year-round, full-time" hours figure of 2,080 hours; for those occupations where there is not an hourly wage published, the annual wage has been directly calculated from the reported survey data.
(3) The relative standard error (RSE) is a measure of the reliability of a survey statistic. The smaller the relative standard error, the more precise the estimate.
(9) The location quotient is the ratio of the area concentration of occupational employment to the national average concentration. A location quotient greater than one indicates the occupation has a higher share of employment than average, and a location quotient less than one indicates the occupation is less prevalent in the area than average.
Other OEWS estimates and related information:
May 2021 National Occupational Employment and Wage Estimates
May 2021 State Occupational Employment and Wage Estimates
May 2021 Metropolitan and Nonmetropolitan Area Occupational Employment and Wage Estimates
May 2021 National Industry-Specific Occupational Employment and Wage Estimates
Last Modified Date: March 31, 2022