
An official website of the United States government
An official website of the United States government
The .gov means it's official.
Federal government websites often end in .gov or .mil. Before sharing sensitive information,
make sure you're on a federal government site.
The site is secure.
The
https:// ensures that you are connecting to the official website and that any
information you provide is encrypted and transmitted securely.
Teach courses pertaining to the culture and development of an area, an ethnic group, or any other group, such as Latin American studies, women�s studies, or urban affairs. Includes both teachers primarily engaged in teaching and those who do a combination of teaching and research.
Employment estimate and mean wage estimates for Area, Ethnic, and Cultural Studies Teachers, Postsecondary:
| Employment (1) | Employment RSE (3) |
Mean hourly wage |
Mean annual wage (2) |
Mean wage RSE (3) |
|---|---|---|---|---|
| 9,040 | 0.6 % | (4) | $ 91,680 | 0.4 % |
Percentile wage estimates for Area, Ethnic, and Cultural Studies Teachers, Postsecondary:
| Percentile | 10% | 25% | 50% (Median) |
75% | 90% |
|---|---|---|---|---|---|
| Annual Wage (2) | $ 45,650 | $ 61,690 | $ 78,910 | $ 103,890 | $ 161,290 |
Industries with the highest published employment and wages for Area, Ethnic, and Cultural Studies Teachers, Postsecondary are provided. For a list of all industries with employment in Area, Ethnic, and Cultural Studies Teachers, Postsecondary, see the Create Customized Tables function.
Industries with the highest levels of employment in Area, Ethnic, and Cultural Studies Teachers, Postsecondary:
| Industry | Employment (1) | Percent of industry employment | Hourly mean wage | Annual mean wage (2) |
|---|---|---|---|---|
| Colleges, Universities, and Professional Schools | 7,880 | 0.26 | (4) | $ 90,880 |
| Junior Colleges | 1,110 | 0.18 | (4) | $ 98,890 |
Industries with the highest concentration of employment in Area, Ethnic, and Cultural Studies Teachers, Postsecondary:
| Industry | Employment (1) | Percent of industry employment | Hourly mean wage | Annual mean wage (2) |
|---|---|---|---|---|
| Colleges, Universities, and Professional Schools | 7,880 | 0.26 | (4) | $ 90,880 |
| Junior Colleges | 1,110 | 0.18 | (4) | $ 98,890 |
Top paying industries for Area, Ethnic, and Cultural Studies Teachers, Postsecondary:
| Industry | Employment (1) | Percent of industry employment | Hourly mean wage | Annual mean wage (2) |
|---|---|---|---|---|
| Junior Colleges | 1,110 | 0.18 | (4) | $ 98,890 |
| Colleges, Universities, and Professional Schools | 7,880 | 0.26 | (4) | $ 90,880 |
States and areas with the highest published employment, location quotients, and wages for Area, Ethnic, and Cultural Studies Teachers, Postsecondary are provided. For a list of all areas with employment in Area, Ethnic, and Cultural Studies Teachers, Postsecondary, see the Create Customized Tables function.
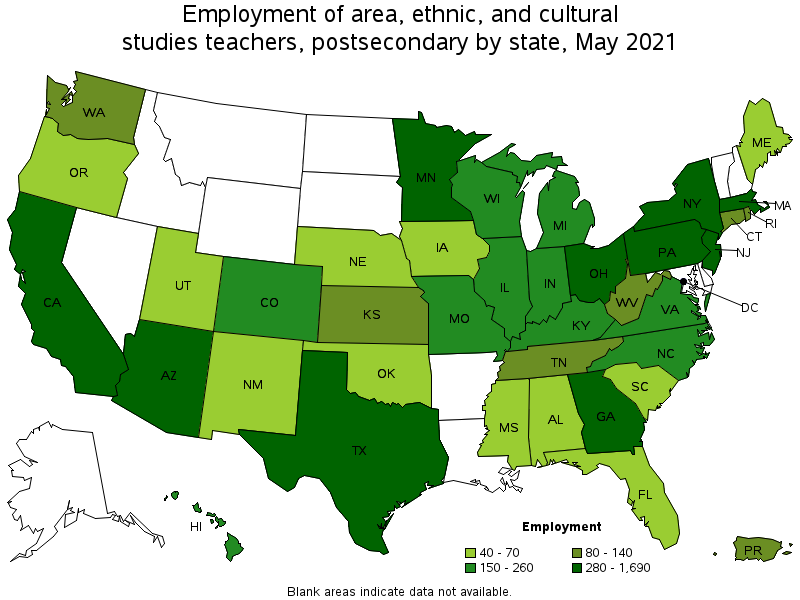
States with the highest employment level in Area, Ethnic, and Cultural Studies Teachers, Postsecondary:
| State | Employment (1) | Employment per thousand jobs | Location quotient (9) | Hourly mean wage | Annual mean wage (2) |
|---|---|---|---|---|---|
| New York | 1,690 | 0.19 | 3.03 | (4) | $ 111,320 |
| Texas | 720 | 0.06 | 0.91 | (4) | $ 67,320 |
| Massachusetts | 610 | 0.18 | 2.80 | (4) | $ 98,110 |
| California | 580 | 0.04 | 0.55 | (4) | $ 147,740 |
| Arizona | 390 | 0.13 | 2.10 | (4) | $ 78,800 |
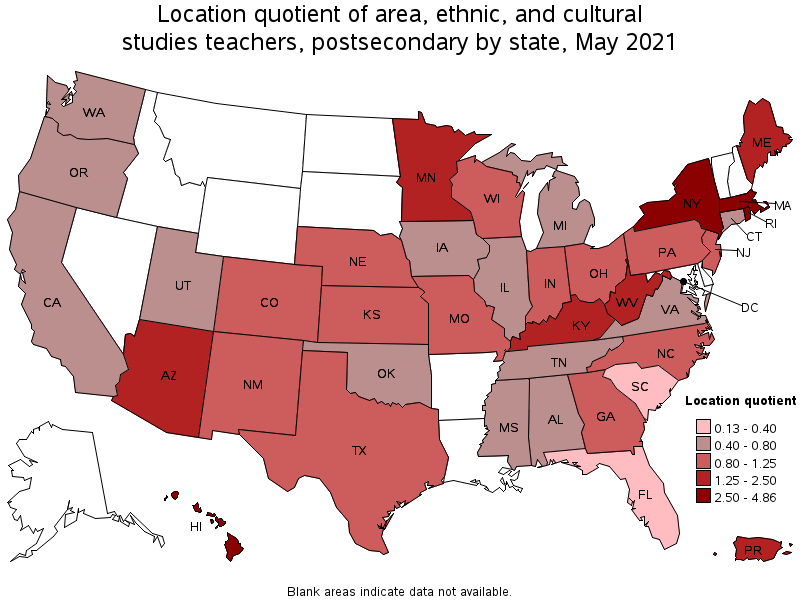
States with the highest concentration of jobs and location quotients in Area, Ethnic, and Cultural Studies Teachers, Postsecondary:
| State | Employment (1) | Employment per thousand jobs | Location quotient (9) | Hourly mean wage | Annual mean wage (2) |
|---|---|---|---|---|---|
| Rhode Island | 140 | 0.31 | 4.86 | (8) | (8) |
| Hawaii | 170 | 0.30 | 4.70 | (4) | $ 74,430 |
| New York | 1,690 | 0.19 | 3.03 | (4) | $ 111,320 |
| District of Columbia | 120 | 0.19 | 2.89 | (4) | $ 85,400 |
| Massachusetts | 610 | 0.18 | 2.80 | (4) | $ 98,110 |
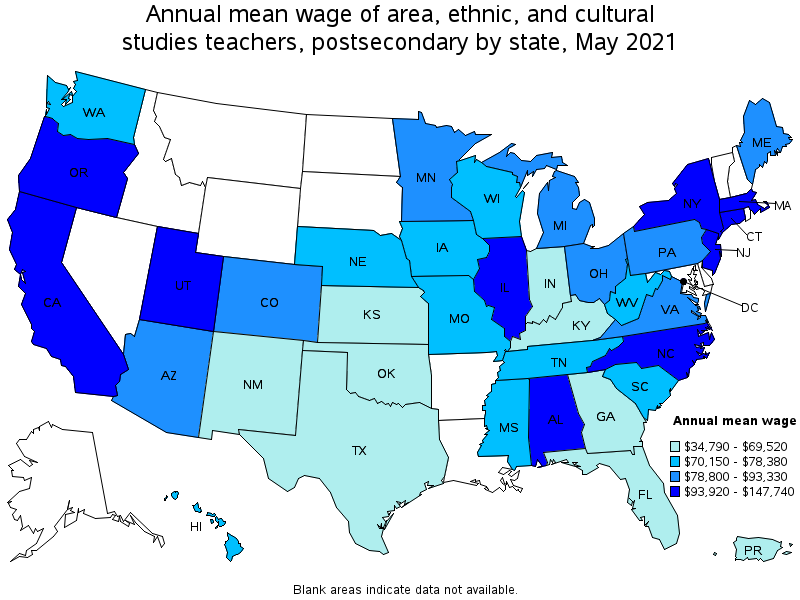
Top paying states for Area, Ethnic, and Cultural Studies Teachers, Postsecondary:
| State | Employment (1) | Employment per thousand jobs | Location quotient (9) | Hourly mean wage | Annual mean wage (2) |
|---|---|---|---|---|---|
| California | 580 | 0.04 | 0.55 | (4) | $ 147,740 |
| Alabama | 70 | 0.04 | 0.55 | (4) | $ 113,290 |
| New York | 1,690 | 0.19 | 3.03 | (4) | $ 111,320 |
| New Jersey | 300 | 0.08 | 1.20 | (4) | $ 98,760 |
| Massachusetts | 610 | 0.18 | 2.80 | (4) | $ 98,110 |
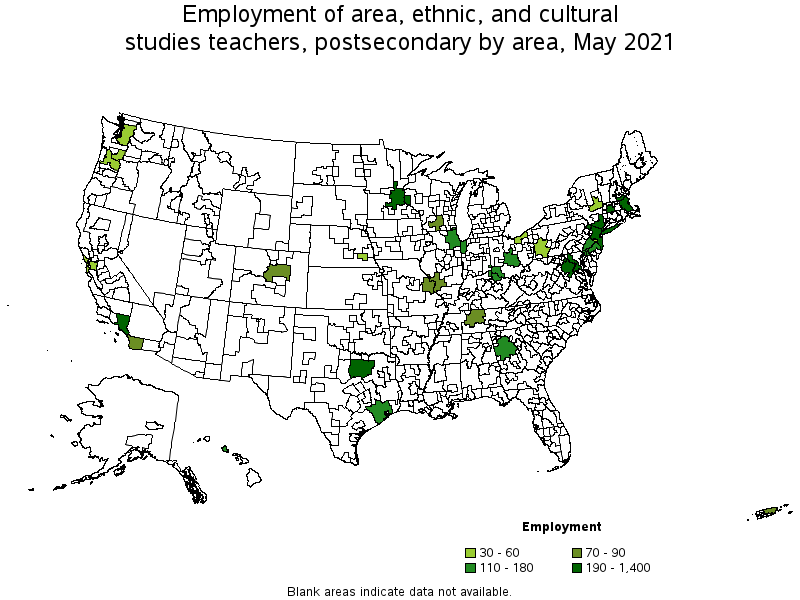
Metropolitan areas with the highest employment level in Area, Ethnic, and Cultural Studies Teachers, Postsecondary:
| Metropolitan area | Employment (1) | Employment per thousand jobs | Location quotient (9) | Hourly mean wage | Annual mean wage (2) |
|---|---|---|---|---|---|
| New York-Newark-Jersey City, NY-NJ-PA | 1,400 | 0.16 | 2.50 | (4) | $ 117,700 |
| Los Angeles-Long Beach-Anaheim, CA | 300 | 0.05 | 0.83 | (4) | $ 160,290 |
| Boston-Cambridge-Nashua, MA-NH | 250 | 0.10 | 1.53 | (4) | $ 104,030 |
| Springfield, MA-CT | 240 | 0.79 | 12.31 | (4) | $ 94,780 |
| Minneapolis-St. Paul-Bloomington, MN-WI | 220 | 0.12 | 1.89 | (4) | $ 84,690 |
| Washington-Arlington-Alexandria, DC-VA-MD-WV | 190 | 0.07 | 1.02 | (4) | $ 89,810 |
| Dallas-Fort Worth-Arlington, TX | 190 | 0.05 | 0.81 | (4) | $ 55,160 |
| Philadelphia-Camden-Wilmington, PA-NJ-DE-MD | 180 | 0.07 | 1.07 | (4) | $ 84,580 |
| Chicago-Naperville-Elgin, IL-IN-WI | 150 | 0.04 | 0.57 | (4) | $ 94,310 |
| Urban Honolulu, HI | 150 | 0.39 | 6.04 | (4) | $ 75,750 |
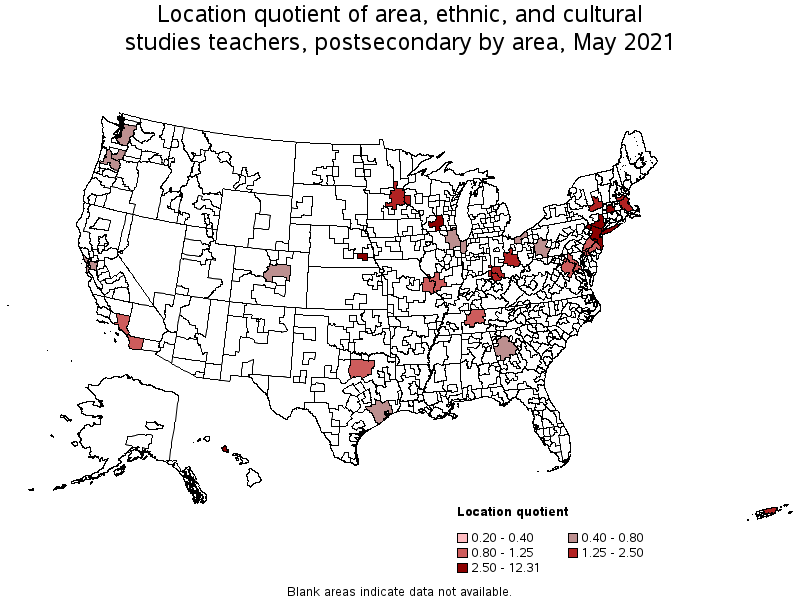
Metropolitan areas with the highest concentration of jobs and location quotients in Area, Ethnic, and Cultural Studies Teachers, Postsecondary:
| Metropolitan area | Employment (1) | Employment per thousand jobs | Location quotient (9) | Hourly mean wage | Annual mean wage (2) |
|---|---|---|---|---|---|
| Springfield, MA-CT | 240 | 0.79 | 12.31 | (4) | $ 94,780 |
| Urban Honolulu, HI | 150 | 0.39 | 6.04 | (4) | $ 75,750 |
| Lincoln, NE | 40 | 0.22 | 3.43 | (4) | $ 66,530 |
| Trenton, NJ | 50 | 0.22 | 3.43 | (4) | $ 90,570 |
| Madison, WI | 70 | 0.19 | 2.90 | (4) | $ 93,340 |
| New York-Newark-Jersey City, NY-NJ-PA | 1,400 | 0.16 | 2.50 | (4) | $ 117,700 |
| Cincinnati, OH-KY-IN | 140 | 0.14 | 2.16 | (4) | $ 68,450 |
| Albany-Schenectady-Troy, NY | 60 | 0.13 | 2.10 | (4) | $ 83,630 |
| Columbus, OH | 140 | 0.13 | 2.06 | (4) | $ 84,550 |
| Minneapolis-St. Paul-Bloomington, MN-WI | 220 | 0.12 | 1.89 | (4) | $ 84,690 |
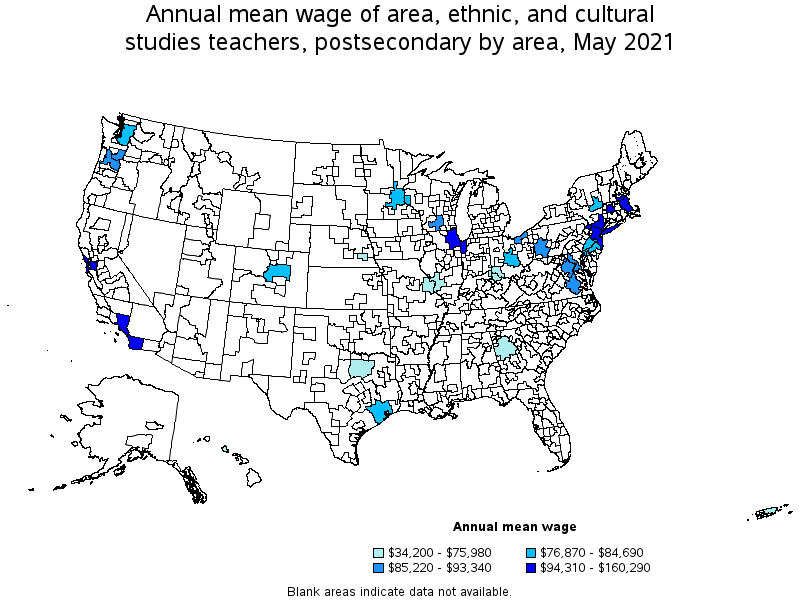
Top paying metropolitan areas for Area, Ethnic, and Cultural Studies Teachers, Postsecondary:
| Metropolitan area | Employment (1) | Employment per thousand jobs | Location quotient (9) | Hourly mean wage | Annual mean wage (2) |
|---|---|---|---|---|---|
| Los Angeles-Long Beach-Anaheim, CA | 300 | 0.05 | 0.83 | (4) | $ 160,290 |
| San Francisco-Oakland-Hayward, CA | 60 | 0.03 | 0.45 | (4) | $ 137,790 |
| San Diego-Carlsbad, CA | 80 | 0.05 | 0.85 | (4) | $ 119,510 |
| New York-Newark-Jersey City, NY-NJ-PA | 1,400 | 0.16 | 2.50 | (4) | $ 117,700 |
| Boston-Cambridge-Nashua, MA-NH | 250 | 0.10 | 1.53 | (4) | $ 104,030 |
| Springfield, MA-CT | 240 | 0.79 | 12.31 | (4) | $ 94,780 |
| Chicago-Naperville-Elgin, IL-IN-WI | 150 | 0.04 | 0.57 | (4) | $ 94,310 |
| Madison, WI | 70 | 0.19 | 2.90 | (4) | $ 93,340 |
| Richmond, VA | (8) | (8) | (8) | (4) | $ 92,890 |
| Trenton, NJ | 50 | 0.22 | 3.43 | (4) | $ 90,570 |
These estimates are calculated with data collected from employers in all industry sectors, all metropolitan and nonmetropolitan areas, and all states and the District of Columbia. The top employment and wage figures are provided above. The complete list is available in the downloadable XLS files.
The percentile wage estimate is the value of a wage below which a certain percent of workers fall. The median wage is the 50th percentile wage estimate—50 percent of workers earn less than the median and 50 percent of workers earn more than the median. More about percentile wages.
(1) Estimates for detailed occupations do not sum to the totals because the totals include occupations not shown separately. Estimates do not include self-employed workers.
(2) Annual wages have been calculated by multiplying the hourly mean wage by a "year-round, full-time" hours figure of 2,080 hours; for those occupations where there is not an hourly wage published, the annual wage has been directly calculated from the reported survey data.
(3) The relative standard error (RSE) is a measure of the reliability of a survey statistic. The smaller the relative standard error, the more precise the estimate.
(4) Wages for some occupations that do not generally work year-round, full time, are reported either as hourly wages or annual salaries depending on how they are typically paid.
(8) Estimate not released.
(9) The location quotient is the ratio of the area concentration of occupational employment to the national average concentration. A location quotient greater than one indicates the occupation has a higher share of employment than average, and a location quotient less than one indicates the occupation is less prevalent in the area than average.
Other OEWS estimates and related information:
May 2021 National Occupational Employment and Wage Estimates
May 2021 State Occupational Employment and Wage Estimates
May 2021 Metropolitan and Nonmetropolitan Area Occupational Employment and Wage Estimates
May 2021 National Industry-Specific Occupational Employment and Wage Estimates
Last Modified Date: March 31, 2022