
An official website of the United States government
An official website of the United States government
The .gov means it's official.
Federal government websites often end in .gov or .mil. Before sharing sensitive information,
make sure you're on a federal government site.
The site is secure.
The
https:// ensures that you are connecting to the official website and that any
information you provide is encrypted and transmitted securely.
Instruct preschool-aged students, following curricula or lesson plans, in activities designed to promote social, physical, and intellectual growth. Excludes �Special Education Teachers� (25-2050), �Substitute Teachers, Short-Term� (25-3031), and �Childcare Workers� (39-9011).
Employment estimate and mean wage estimates for Preschool Teachers, Except Special Education:
| Employment (1) | Employment RSE (3) |
Mean hourly wage |
Mean annual wage (2) |
Wage RSE (3) |
|---|---|---|---|---|
| 391,670 | 1.3 % | $ 17.53 | $ 36,460 | 0.7 % |
Percentile wage estimates for Preschool Teachers, Except Special Education:
| Percentile | 10% | 25% | 50% (Median) |
75% | 90% |
|---|---|---|---|---|---|
| Hourly Wage | $ 10.98 | $ 13.67 | $ 14.52 | $ 18.57 | $ 28.14 |
| Annual Wage (2) | $ 22,840 | $ 28,440 | $ 30,210 | $ 38,620 | $ 58,530 |
Industries with the highest published employment and wages for Preschool Teachers, Except Special Education are provided. For a list of all industries with employment in Preschool Teachers, Except Special Education, see the Create Customized Tables function.
Industries with the highest levels of employment in Preschool Teachers, Except Special Education:
| Industry | Employment (1) | Percent of industry employment | Hourly mean wage | Annual mean wage (2) |
|---|---|---|---|---|
| Child Day Care Services | 273,430 | 33.98 | $ 15.39 | $ 32,020 |
| Elementary and Secondary Schools | 71,730 | 0.89 | $ 25.20 | $ 52,420 |
| Individual and Family Services | 13,330 | 0.50 | $ 18.15 | $ 37,750 |
| Local Government, excluding schools and hospitals (OEWS Designation) | 6,600 | 0.12 | $ 20.10 | $ 41,820 |
| Religious Organizations | 5,970 | 3.33 | $ 18.06 | $ 37,560 |
Industries with the highest concentration of employment in Preschool Teachers, Except Special Education:
| Industry | Employment (1) | Percent of industry employment | Hourly mean wage | Annual mean wage (2) |
|---|---|---|---|---|
| Child Day Care Services | 273,430 | 33.98 | $ 15.39 | $ 32,020 |
| Religious Organizations | 5,970 | 3.33 | $ 18.06 | $ 37,560 |
| Civic and Social Organizations | 3,920 | 1.50 | $ 16.81 | $ 34,970 |
| Elementary and Secondary Schools | 71,730 | 0.89 | $ 25.20 | $ 52,420 |
| Social Advocacy Organizations | 1,790 | 0.80 | $ 17.74 | $ 36,900 |
Top paying industries for Preschool Teachers, Except Special Education:
| Industry | Employment (1) | Percent of industry employment | Hourly mean wage | Annual mean wage (2) |
|---|---|---|---|---|
| Business Schools and Computer and Management Training | 40 | 0.05 | $ 25.40 | $ 52,820 |
| Elementary and Secondary Schools | 71,730 | 0.89 | $ 25.20 | $ 52,420 |
| Residential Intellectual and Developmental Disability, Mental Health, and Substance Abuse Facilities | 90 | 0.01 | $ 24.98 | $ 51,970 |
| Junior Colleges | 1,150 | 0.19 | $ 24.62 | $ 51,200 |
| Outpatient Care Centers | 180 | 0.02 | $ 20.95 | $ 43,570 |
States and areas with the highest published employment, location quotients, and wages for Preschool Teachers, Except Special Education are provided. For a list of all areas with employment in Preschool Teachers, Except Special Education, see the Create Customized Tables function.
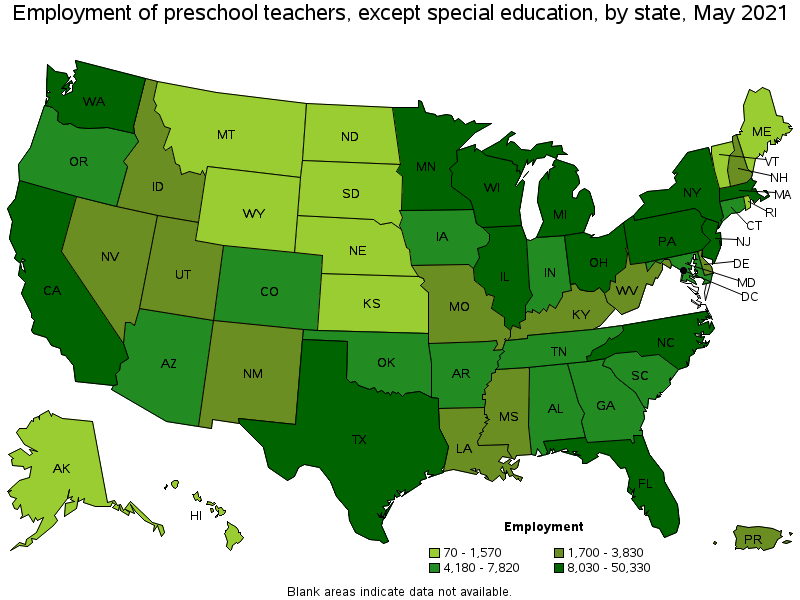
States with the highest employment level in Preschool Teachers, Except Special Education:
| State | Employment (1) | Employment per thousand jobs | Location quotient (9) | Hourly mean wage | Annual mean wage (2) |
|---|---|---|---|---|---|
| California | 50,330 | 3.05 | 1.10 | $ 20.29 | $ 42,210 |
| Texas | 33,440 | 2.74 | 0.98 | $ 17.68 | $ 36,760 |
| Florida | 25,900 | 3.01 | 1.08 | $ 14.37 | $ 29,890 |
| Illinois | 19,610 | 3.49 | 1.26 | $ 17.23 | $ 35,840 |
| New York | 19,480 | 2.25 | 0.81 | $ 21.10 | $ 43,880 |
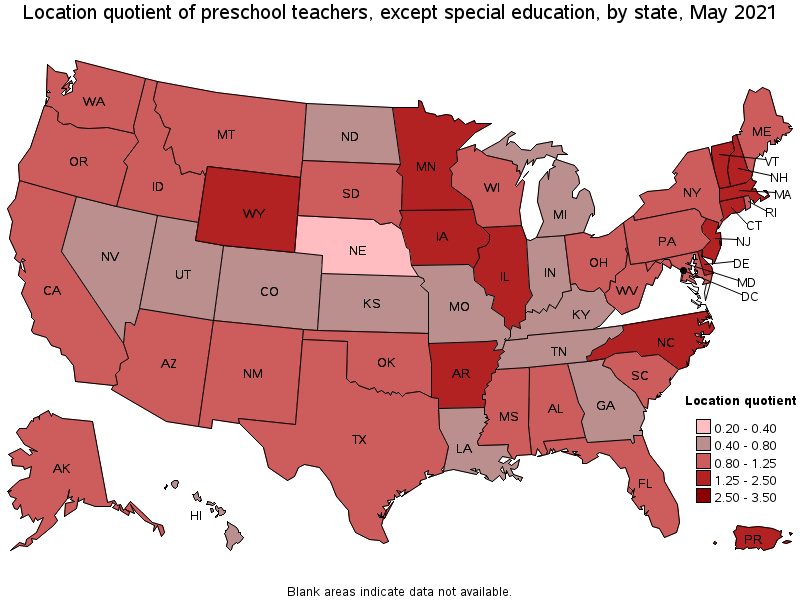
States with the highest concentration of jobs and location quotients in Preschool Teachers, Except Special Education:
| State | Employment (1) | Employment per thousand jobs | Location quotient (9) | Hourly mean wage | Annual mean wage (2) |
|---|---|---|---|---|---|
| New Hampshire | 2,810 | 4.43 | 1.59 | $ 15.97 | $ 33,210 |
| New Jersey | 16,890 | 4.39 | 1.58 | $ 21.54 | $ 44,810 |
| Vermont | 1,210 | 4.28 | 1.54 | $ 18.84 | $ 39,190 |
| Delaware | 1,720 | 3.95 | 1.42 | $ 14.02 | $ 29,150 |
| Connecticut | 6,190 | 3.93 | 1.41 | $ 17.78 | $ 36,980 |
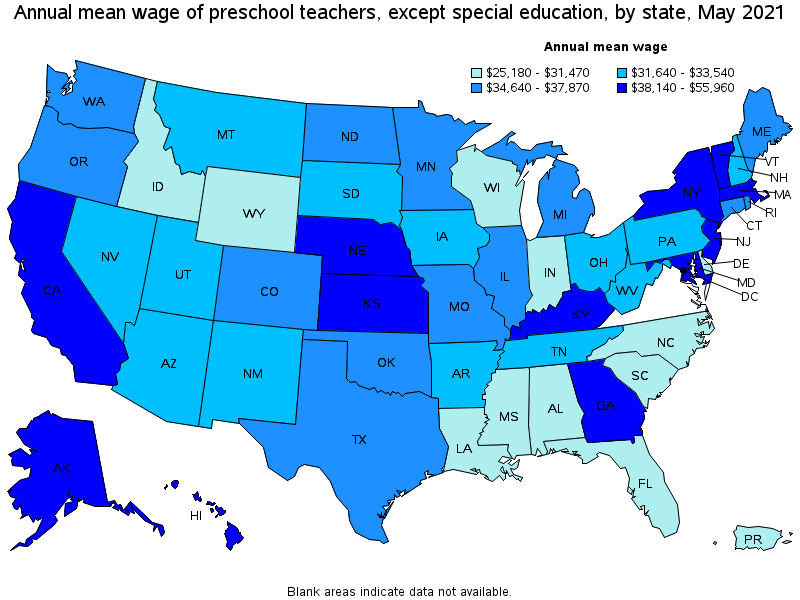
Top paying states for Preschool Teachers, Except Special Education:
| State | Employment (1) | Employment per thousand jobs | Location quotient (9) | Hourly mean wage | Annual mean wage (2) |
|---|---|---|---|---|---|
| District of Columbia | 2,240 | 3.39 | 1.22 | $ 26.90 | $ 55,960 |
| New Jersey | 16,890 | 4.39 | 1.58 | $ 21.54 | $ 44,810 |
| New York | 19,480 | 2.25 | 0.81 | $ 21.10 | $ 43,880 |
| Massachusetts | 12,580 | 3.70 | 1.33 | $ 21.01 | $ 43,710 |
| California | 50,330 | 3.05 | 1.10 | $ 20.29 | $ 42,210 |
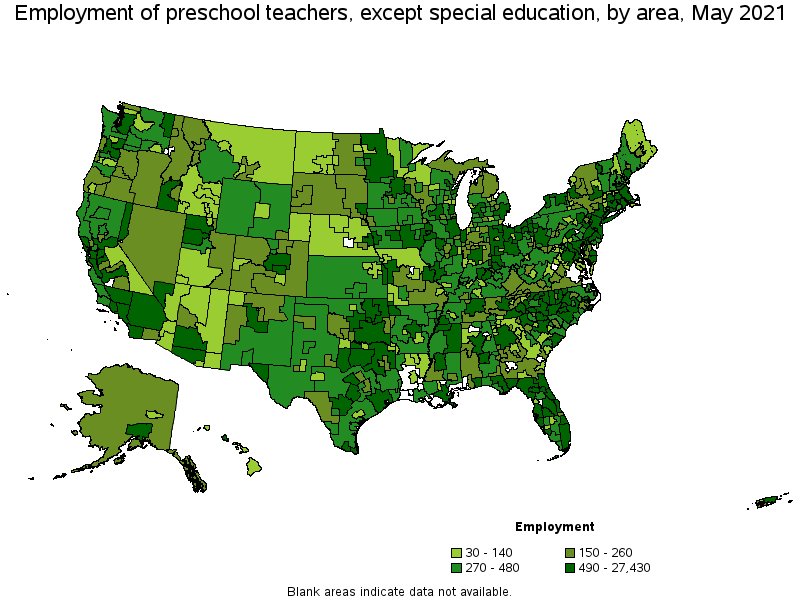
Metropolitan areas with the highest employment level in Preschool Teachers, Except Special Education:
| Metropolitan area | Employment (1) | Employment per thousand jobs | Location quotient (9) | Hourly mean wage | Annual mean wage (2) |
|---|---|---|---|---|---|
| New York-Newark-Jersey City, NY-NJ-PA | 27,430 | 3.16 | 1.14 | $ 21.78 | $ 45,300 |
| Los Angeles-Long Beach-Anaheim, CA | 16,260 | 2.84 | 1.02 | $ 20.02 | $ 41,650 |
| Chicago-Naperville-Elgin, IL-IN-WI | 15,230 | 3.60 | 1.29 | $ 17.62 | $ 36,650 |
| Boston-Cambridge-Nashua, MA-NH | 10,630 | 4.11 | 1.48 | $ 20.75 | $ 43,160 |
| Philadelphia-Camden-Wilmington, PA-NJ-DE-MD | 10,570 | 3.98 | 1.43 | $ 16.69 | $ 34,710 |
| Washington-Arlington-Alexandria, DC-VA-MD-WV | 10,490 | 3.58 | 1.29 | $ 21.04 | $ 43,750 |
| San Francisco-Oakland-Hayward, CA | 9,660 | 4.31 | 1.55 | $ 21.29 | $ 44,290 |
| Houston-The Woodlands-Sugar Land, TX | 9,270 | 3.20 | 1.15 | $ 17.91 | $ 37,240 |
| Dallas-Fort Worth-Arlington, TX | 9,160 | 2.55 | 0.92 | $ 16.87 | $ 35,100 |
| Minneapolis-St. Paul-Bloomington, MN-WI | 6,780 | 3.72 | 1.34 | $ 18.29 | $ 38,040 |
Metropolitan areas with the highest concentration of jobs and location quotients in Preschool Teachers, Except Special Education:
| Metropolitan area | Employment (1) | Employment per thousand jobs | Location quotient (9) | Hourly mean wage | Annual mean wage (2) |
|---|---|---|---|---|---|
| Goldsboro, NC | 280 | 7.20 | 2.59 | $ 12.58 | $ 26,170 |
| Auburn-Opelika, AL | 420 | 7.06 | 2.54 | $ 11.29 | $ 23,490 |
| Jonesboro, AR | 380 | 6.77 | 2.43 | $ 16.25 | $ 33,810 |
| Jacksonville, NC | 300 | 6.21 | 2.23 | $ 13.43 | $ 27,940 |
| New Bedford, MA | 370 | 5.97 | 2.15 | $ 18.87 | $ 39,250 |
| Dover-Durham, NH-ME | 290 | 5.81 | 2.09 | $ 15.98 | $ 33,230 |
| Vineland-Bridgeton, NJ | 340 | 5.75 | 2.07 | $ 23.83 | $ 49,560 |
| Sebring, FL | 140 | 5.55 | 2.00 | $ 12.09 | $ 25,150 |
| Champaign-Urbana, IL | 540 | 5.51 | 1.98 | $ 15.83 | $ 32,930 |
| Bridgeport-Stamford-Norwalk, CT | 1,920 | 5.11 | 1.84 | $ 18.57 | $ 38,630 |
Top paying metropolitan areas for Preschool Teachers, Except Special Education:
| Metropolitan area | Employment (1) | Employment per thousand jobs | Location quotient (9) | Hourly mean wage | Annual mean wage (2) |
|---|---|---|---|---|---|
| Sacramento--Roseville--Arden-Arcade, CA | 3,560 | 3.62 | 1.30 | $ 24.03 | $ 49,990 |
| Ocean City, NJ | 110 | 2.77 | 1.00 | $ 23.91 | $ 49,720 |
| Vineland-Bridgeton, NJ | 340 | 5.75 | 2.07 | $ 23.83 | $ 49,560 |
| Rome, GA | 40 | 1.07 | 0.38 | $ 23.16 | $ 48,160 |
| Laredo, TX | 270 | 2.77 | 1.00 | $ 22.98 | $ 47,790 |
| Atlantic City-Hammonton, NJ | 420 | 3.59 | 1.29 | $ 22.94 | $ 47,720 |
| Kahului-Wailuku-Lahaina, HI | 70 | 1.09 | 0.39 | $ 22.45 | $ 46,690 |
| New York-Newark-Jersey City, NY-NJ-PA | 27,430 | 3.16 | 1.14 | $ 21.78 | $ 45,300 |
| Modesto, CA | 510 | 2.80 | 1.01 | $ 21.64 | $ 45,010 |
| Pittsfield, MA | 80 | 2.19 | 0.79 | $ 21.54 | $ 44,810 |
Nonmetropolitan areas with the highest employment in Preschool Teachers, Except Special Education:
| Nonmetropolitan area | Employment (1) | Employment per thousand jobs | Location quotient (9) | Hourly mean wage | Annual mean wage (2) |
|---|---|---|---|---|---|
| Southeast Coastal North Carolina nonmetropolitan area | 1,420 | 5.91 | 2.13 | $ 14.86 | $ 30,910 |
| Piedmont North Carolina nonmetropolitan area | 1,010 | 4.15 | 1.49 | $ 13.00 | $ 27,040 |
| Southeast Iowa nonmetropolitan area | 890 | 4.26 | 1.53 | $ 19.92 | $ 41,440 |
| North Northeastern Ohio nonmetropolitan area (noncontiguous) | 750 | 2.38 | 0.86 | $ 17.33 | $ 36,050 |
| Northwest Minnesota nonmetropolitan area | 670 | 3.68 | 1.32 | $ 19.70 | $ 40,980 |
Nonmetropolitan areas with the highest concentration of jobs and location quotients in Preschool Teachers, Except Special Education:
| Nonmetropolitan area | Employment (1) | Employment per thousand jobs | Location quotient (9) | Hourly mean wage | Annual mean wage (2) |
|---|---|---|---|---|---|
| Southeast Coastal North Carolina nonmetropolitan area | 1,420 | 5.91 | 2.13 | $ 14.86 | $ 30,910 |
| East Arkansas nonmetropolitan area | 360 | 5.56 | 2.00 | $ 14.78 | $ 30,740 |
| Northwest Mississippi nonmetropolitan area | 470 | 5.41 | 1.94 | $ 12.79 | $ 26,590 |
| North Florida nonmetropolitan area | 630 | 5.34 | 1.92 | $ 14.19 | $ 29,510 |
| Northeast Oklahoma nonmetropolitan area | 570 | 5.07 | 1.82 | $ 15.33 | $ 31,880 |
Top paying nonmetropolitan areas for Preschool Teachers, Except Special Education:
| Nonmetropolitan area | Employment (1) | Employment per thousand jobs | Location quotient (9) | Hourly mean wage | Annual mean wage (2) |
|---|---|---|---|---|---|
| Alaska nonmetropolitan area | 240 | 2.43 | 0.87 | $ 22.77 | $ 47,360 |
| South Nebraska nonmetropolitan area | 100 | 0.69 | 0.25 | $ 21.75 | $ 45,230 |
| Hawaii / Kauai nonmetropolitan area | 110 | 1.21 | 0.43 | $ 21.50 | $ 44,720 |
| Massachusetts nonmetropolitan area | 130 | 2.33 | 0.84 | $ 21.50 | $ 44,720 |
| Northeast Nebraska nonmetropolitan area | 120 | 1.27 | 0.46 | $ 21.33 | $ 44,370 |
These estimates are calculated with data collected from employers in all industry sectors, all metropolitan and nonmetropolitan areas, and all states and the District of Columbia. The top employment and wage figures are provided above. The complete list is available in the downloadable XLS files.
The percentile wage estimate is the value of a wage below which a certain percent of workers fall. The median wage is the 50th percentile wage estimate—50 percent of workers earn less than the median and 50 percent of workers earn more than the median. More about percentile wages.
(1) Estimates for detailed occupations do not sum to the totals because the totals include occupations not shown separately. Estimates do not include self-employed workers.
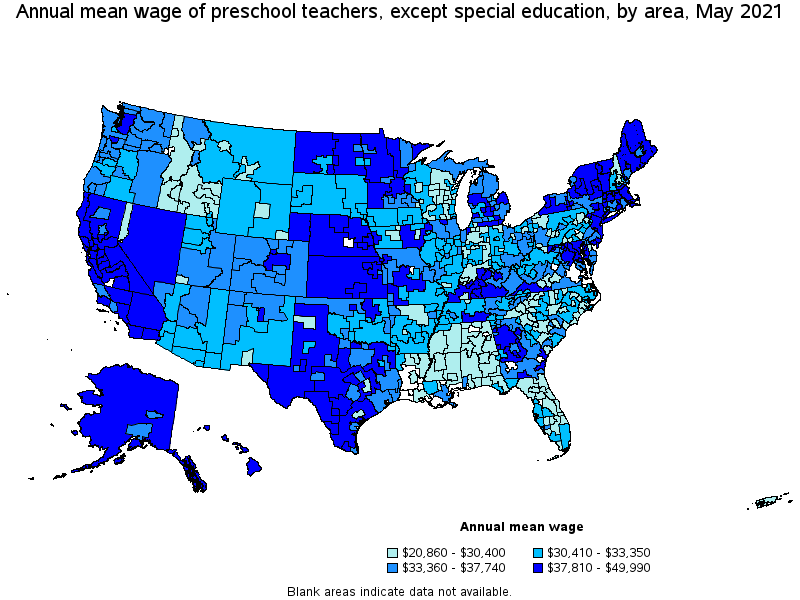
(2) Annual wages have been calculated by multiplying the hourly mean wage by a "year-round, full-time" hours figure of 2,080 hours; for those occupations where there is not an hourly wage published, the annual wage has been directly calculated from the reported survey data.
(3) The relative standard error (RSE) is a measure of the reliability of a survey statistic. The smaller the relative standard error, the more precise the estimate.
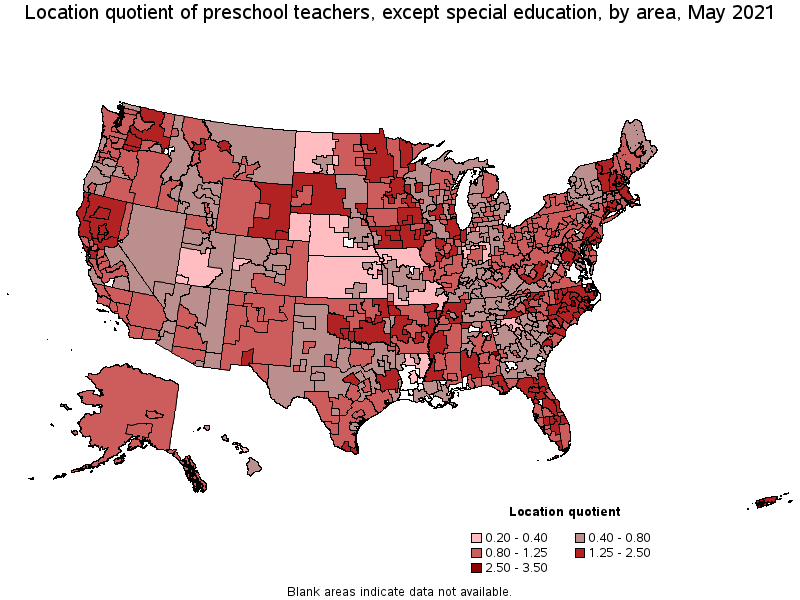
(9) The location quotient is the ratio of the area concentration of occupational employment to the national average concentration. A location quotient greater than one indicates the occupation has a higher share of employment than average, and a location quotient less than one indicates the occupation is less prevalent in the area than average.
Other OEWS estimates and related information:
May 2021 National Occupational Employment and Wage Estimates
May 2021 State Occupational Employment and Wage Estimates
May 2021 Metropolitan and Nonmetropolitan Area Occupational Employment and Wage Estimates
May 2021 National Industry-Specific Occupational Employment and Wage Estimates
Last Modified Date: March 31, 2022