
An official website of the United States government
An official website of the United States government
The .gov means it's official.
Federal government websites often end in .gov or .mil. Before sharing sensitive information,
make sure you're on a federal government site.
The site is secure.
The
https:// ensures that you are connecting to the official website and that any
information you provide is encrypted and transmitted securely.
Instruct and advise individuals and families engaged in agriculture, agricultural-related processes, or home management activities. Demonstrate procedures and apply research findings to advance agricultural and home management activities. May develop educational outreach programs. May instruct on either agricultural issues such as agricultural processes and techniques, pest management, and food safety, or on home management issues such as budgeting, nutrition, and child development. Excludes �Dietitians and Nutritionists� (29-1031).
Employment estimate and mean wage estimates for Farm and Home Management Educators:
| Employment (1) | Employment RSE (3) |
Mean hourly wage |
Mean annual wage (2) |
Wage RSE (3) |
|---|---|---|---|---|
| 10,620 | 10.8 % | $ 27.90 | $ 58,040 | 3.1 % |
Percentile wage estimates for Farm and Home Management Educators:
| Percentile | 10% | 25% | 50% (Median) |
75% | 90% |
|---|---|---|---|---|---|
| Hourly Wage | $ 14.44 | $ 17.86 | $ 24.03 | $ 32.53 | $ 44.58 |
| Annual Wage (2) | $ 30,030 | $ 37,140 | $ 49,990 | $ 67,660 | $ 92,720 |
Industries with the highest published employment and wages for Farm and Home Management Educators are provided. For a list of all industries with employment in Farm and Home Management Educators, see the Create Customized Tables function.
Industries with the highest levels of employment in Farm and Home Management Educators:
| Industry | Employment (1) | Percent of industry employment | Hourly mean wage | Annual mean wage (2) |
|---|---|---|---|---|
| Colleges, Universities, and Professional Schools | 8,010 | 0.27 | $ 29.27 | $ 60,880 |
| Local Government, excluding schools and hospitals (OEWS Designation) | 850 | 0.02 | $ 19.58 | $ 40,720 |
| State Government, excluding schools and hospitals (OEWS Designation) | 610 | 0.03 | $ 25.73 | $ 53,520 |
| Business Schools and Computer and Management Training | 240 | 0.34 | $ 28.32 | $ 58,900 |
| Social Advocacy Organizations | 80 | 0.04 | $ 21.24 | $ 44,180 |
Industries with the highest concentration of employment in Farm and Home Management Educators:
| Industry | Employment (1) | Percent of industry employment | Hourly mean wage | Annual mean wage (2) |
|---|---|---|---|---|
| Business Schools and Computer and Management Training | 240 | 0.34 | $ 28.32 | $ 58,900 |
| Colleges, Universities, and Professional Schools | 8,010 | 0.27 | $ 29.27 | $ 60,880 |
| Social Advocacy Organizations | 80 | 0.04 | $ 21.24 | $ 44,180 |
| Educational Support Services | 60 | 0.03 | $ 22.70 | $ 47,210 |
| State Government, excluding schools and hospitals (OEWS Designation) | 610 | 0.03 | $ 25.73 | $ 53,520 |
Top paying industries for Farm and Home Management Educators:
| Industry | Employment (1) | Percent of industry employment | Hourly mean wage | Annual mean wage (2) |
|---|---|---|---|---|
| Colleges, Universities, and Professional Schools | 8,010 | 0.27 | $ 29.27 | $ 60,880 |
| Business Schools and Computer and Management Training | 240 | 0.34 | $ 28.32 | $ 58,900 |
| Management, Scientific, and Technical Consulting Services | (8) | (8) | $ 27.83 | $ 57,890 |
| Elementary and Secondary Schools | 60 | (7) | $ 27.18 | $ 56,540 |
| State Government, excluding schools and hospitals (OEWS Designation) | 610 | 0.03 | $ 25.73 | $ 53,520 |
States and areas with the highest published employment, location quotients, and wages for Farm and Home Management Educators are provided. For a list of all areas with employment in Farm and Home Management Educators, see the Create Customized Tables function.
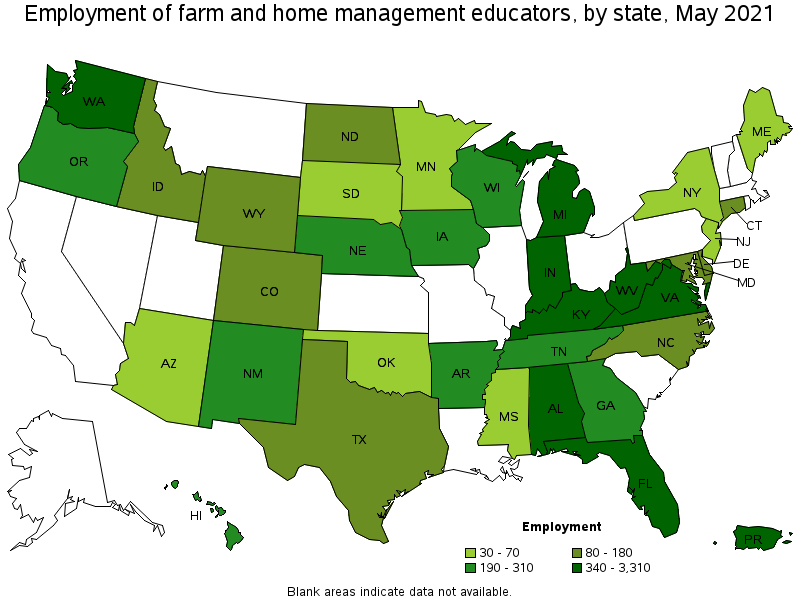
States with the highest employment level in Farm and Home Management Educators:
| State | Employment (1) | Employment per thousand jobs | Location quotient (9) | Hourly mean wage | Annual mean wage (2) |
|---|---|---|---|---|---|
| Florida | 3,310 | 0.38 | 5.10 | $ 22.06 | $ 45,890 |
| Kentucky | 660 | 0.36 | 4.78 | $ 22.31 | $ 46,400 |
| Virginia | 540 | 0.14 | 1.91 | $ 44.86 | $ 93,300 |
| Washington | 390 | 0.12 | 1.63 | $ 28.94 | $ 60,190 |
| West Virginia | 380 | 0.57 | 7.59 | $ 33.82 | $ 70,340 |
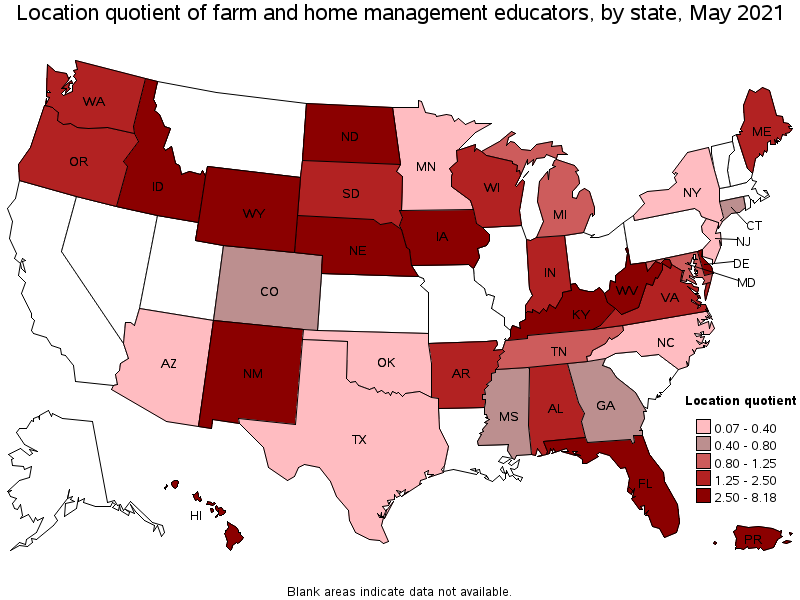
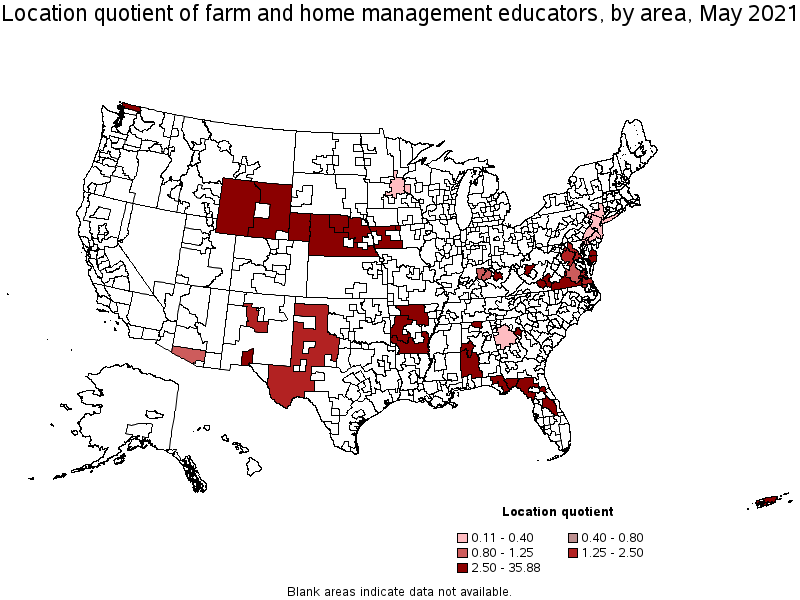
States with the highest concentration of jobs and location quotients in Farm and Home Management Educators:
| State | Employment (1) | Employment per thousand jobs | Location quotient (9) | Hourly mean wage | Annual mean wage (2) |
|---|---|---|---|---|---|
| West Virginia | 380 | 0.57 | 7.59 | $ 33.82 | $ 70,340 |
| Wyoming | 150 | 0.57 | 7.59 | $ 30.68 | $ 63,820 |
| Florida | 3,310 | 0.38 | 5.10 | $ 22.06 | $ 45,890 |
| Kentucky | 660 | 0.36 | 4.78 | $ 22.31 | $ 46,400 |
| Hawaii | 190 | 0.35 | 4.69 | $ 51.45 | $ 107,010 |
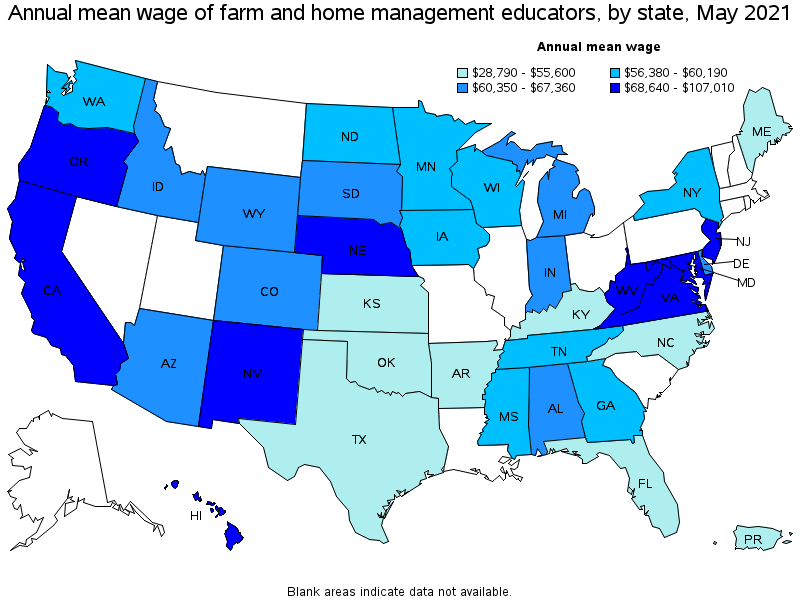
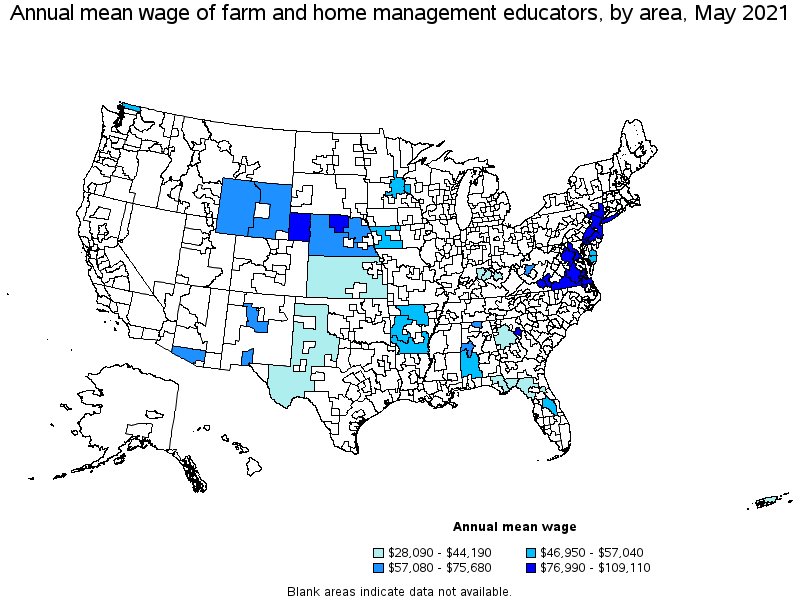
Top paying states for Farm and Home Management Educators:
| State | Employment (1) | Employment per thousand jobs | Location quotient (9) | Hourly mean wage | Annual mean wage (2) |
|---|---|---|---|---|---|
| Hawaii | 190 | 0.35 | 4.69 | $ 51.45 | $ 107,010 |
| Virginia | 540 | 0.14 | 1.91 | $ 44.86 | $ 93,300 |
| New Jersey | 70 | 0.02 | 0.22 | $ 41.76 | $ 86,860 |
| Oregon | 250 | 0.14 | 1.80 | $ 41.22 | $ 85,730 |
| Nebraska | 260 | 0.27 | 3.54 | $ 35.76 | $ 74,370 |
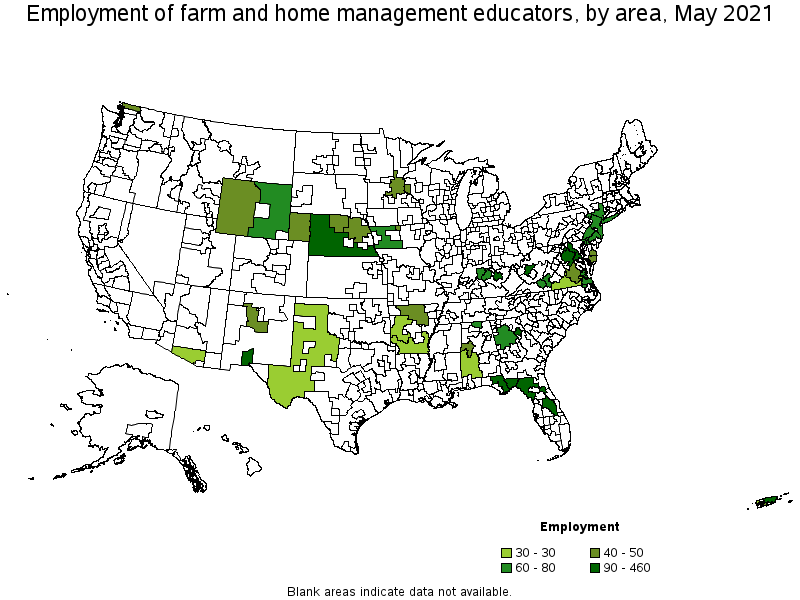
Metropolitan areas with the highest employment level in Farm and Home Management Educators:
| Metropolitan area | Employment (1) | Employment per thousand jobs | Location quotient (9) | Hourly mean wage | Annual mean wage (2) |
|---|---|---|---|---|---|
| Tallahassee, FL | 460 | 2.70 | 35.88 | $ 20.50 | $ 42,640 |
| Washington-Arlington-Alexandria, DC-VA-MD-WV | 340 | 0.12 | 1.53 | $ 43.95 | $ 91,410 |
| Orlando-Kissimmee-Sanford, FL | 300 | 0.25 | 3.35 | $ 22.57 | $ 46,950 |
| Lexington-Fayette, KY | 200 | 0.76 | 10.06 | $ 15.80 | $ 32,860 |
| Athens-Clarke County, GA | 130 | 1.48 | 19.62 | $ 43.48 | $ 90,430 |
| Las Cruces, NM | 110 | 1.64 | 21.73 | $ 36.18 | $ 75,260 |
| Charleston, WV | 90 | 0.86 | 11.39 | $ 29.12 | $ 60,560 |
| Roanoke, VA | 80 | 0.53 | 7.00 | $ 52.46 | $ 109,110 |
| New York-Newark-Jersey City, NY-NJ-PA | 70 | 0.01 | 0.11 | $ 40.60 | $ 84,450 |
| Virginia Beach-Norfolk-Newport News, VA-NC | 70 | 0.10 | 1.32 | $ 44.78 | $ 93,140 |
Metropolitan areas with the highest concentration of jobs and location quotients in Farm and Home Management Educators:
| Metropolitan area | Employment (1) | Employment per thousand jobs | Location quotient (9) | Hourly mean wage | Annual mean wage (2) |
|---|---|---|---|---|---|
| Tallahassee, FL | 460 | 2.70 | 35.88 | $ 20.50 | $ 42,640 |
| Las Cruces, NM | 110 | 1.64 | 21.73 | $ 36.18 | $ 75,260 |
| Athens-Clarke County, GA | 130 | 1.48 | 19.62 | $ 43.48 | $ 90,430 |
| Ames, IA | 50 | 1.05 | 13.91 | $ 25.68 | $ 53,410 |
| Charleston, WV | 90 | 0.86 | 11.39 | $ 29.12 | $ 60,560 |
| Blacksburg-Christiansburg-Radford, VA | 60 | 0.86 | 11.35 | $ 39.04 | $ 81,200 |
| Lexington-Fayette, KY | 200 | 0.76 | 10.06 | $ 15.80 | $ 32,860 |
| Roanoke, VA | 80 | 0.53 | 7.00 | $ 52.46 | $ 109,110 |
| Bellingham, WA | 40 | 0.44 | 5.89 | $ 25.87 | $ 53,800 |
| Tuscaloosa, AL | 40 | 0.39 | 5.23 | $ 27.44 | $ 57,080 |
Top paying metropolitan areas for Farm and Home Management Educators:
| Metropolitan area | Employment (1) | Employment per thousand jobs | Location quotient (9) | Hourly mean wage | Annual mean wage (2) |
|---|---|---|---|---|---|
| Roanoke, VA | 80 | 0.53 | 7.00 | $ 52.46 | $ 109,110 |
| Virginia Beach-Norfolk-Newport News, VA-NC | 70 | 0.10 | 1.32 | $ 44.78 | $ 93,140 |
| Richmond, VA | 50 | 0.09 | 1.14 | $ 44.28 | $ 92,090 |
| Washington-Arlington-Alexandria, DC-VA-MD-WV | 340 | 0.12 | 1.53 | $ 43.95 | $ 91,410 |
| Athens-Clarke County, GA | 130 | 1.48 | 19.62 | $ 43.48 | $ 90,430 |
| New York-Newark-Jersey City, NY-NJ-PA | 70 | 0.01 | 0.11 | $ 40.60 | $ 84,450 |
| Blacksburg-Christiansburg-Radford, VA | 60 | 0.86 | 11.35 | $ 39.04 | $ 81,200 |
| Philadelphia-Camden-Wilmington, PA-NJ-DE-MD | 70 | 0.03 | 0.35 | $ 37.01 | $ 76,990 |
| Las Cruces, NM | 110 | 1.64 | 21.73 | $ 36.18 | $ 75,260 |
| Albuquerque, NM | 40 | 0.11 | 1.47 | $ 32.47 | $ 67,550 |
Nonmetropolitan areas with the highest employment in Farm and Home Management Educators:
| Nonmetropolitan area | Employment (1) | Employment per thousand jobs | Location quotient (9) | Hourly mean wage | Annual mean wage (2) |
|---|---|---|---|---|---|
| South Nebraska nonmetropolitan area | 110 | 0.76 | 10.07 | $ 34.44 | $ 71,630 |
| North Florida nonmetropolitan area | 90 | 0.73 | 9.71 | $ 21.25 | $ 44,190 |
| Eastern Wyoming nonmetropolitan area | 80 | 1.03 | 13.72 | $ 28.36 | $ 58,990 |
| Southwest Iowa nonmetropolitan area | 60 | 0.73 | 9.63 | $ 25.50 | $ 53,030 |
| Northwest Nebraska nonmetropolitan area | 50 | 1.44 | 19.06 | $ 38.52 | $ 80,110 |
Nonmetropolitan areas with the highest concentration of jobs and location quotients in Farm and Home Management Educators:
| Nonmetropolitan area | Employment (1) | Employment per thousand jobs | Location quotient (9) | Hourly mean wage | Annual mean wage (2) |
|---|---|---|---|---|---|
| Northwest Nebraska nonmetropolitan area | 50 | 1.44 | 19.06 | $ 38.52 | $ 80,110 |
| Eastern Wyoming nonmetropolitan area | 80 | 1.03 | 13.72 | $ 28.36 | $ 58,990 |
| South Nebraska nonmetropolitan area | 110 | 0.76 | 10.07 | $ 34.44 | $ 71,630 |
| North Florida nonmetropolitan area | 90 | 0.73 | 9.71 | $ 21.25 | $ 44,190 |
| Southwest Iowa nonmetropolitan area | 60 | 0.73 | 9.63 | $ 25.50 | $ 53,030 |
Top paying nonmetropolitan areas for Farm and Home Management Educators:
| Nonmetropolitan area | Employment (1) | Employment per thousand jobs | Location quotient (9) | Hourly mean wage | Annual mean wage (2) |
|---|---|---|---|---|---|
| Northwest Nebraska nonmetropolitan area | 50 | 1.44 | 19.06 | $ 38.52 | $ 80,110 |
| Southside Virginia nonmetropolitan area | 30 | 0.33 | 4.42 | $ 37.12 | $ 77,200 |
| Northeast Nebraska nonmetropolitan area | 50 | 0.54 | 7.14 | $ 36.38 | $ 75,680 |
| South Nebraska nonmetropolitan area | 110 | 0.76 | 10.07 | $ 34.44 | $ 71,630 |
| Western Wyoming nonmetropolitan area | 50 | 0.56 | 7.40 | $ 34.28 | $ 71,300 |
These estimates are calculated with data collected from employers in all industry sectors, all metropolitan and nonmetropolitan areas, and all states and the District of Columbia. The top employment and wage figures are provided above. The complete list is available in the downloadable XLS files.
The percentile wage estimate is the value of a wage below which a certain percent of workers fall. The median wage is the 50th percentile wage estimate—50 percent of workers earn less than the median and 50 percent of workers earn more than the median. More about percentile wages.
(1) Estimates for detailed occupations do not sum to the totals because the totals include occupations not shown separately. Estimates do not include self-employed workers.
(2) Annual wages have been calculated by multiplying the hourly mean wage by a "year-round, full-time" hours figure of 2,080 hours; for those occupations where there is not an hourly wage published, the annual wage has been directly calculated from the reported survey data.
(3) The relative standard error (RSE) is a measure of the reliability of a survey statistic. The smaller the relative standard error, the more precise the estimate.
(7) The value is less than .005 percent of industry employment.
(8) Estimate not released.
(9) The location quotient is the ratio of the area concentration of occupational employment to the national average concentration. A location quotient greater than one indicates the occupation has a higher share of employment than average, and a location quotient less than one indicates the occupation is less prevalent in the area than average.
Other OEWS estimates and related information:
May 2021 National Occupational Employment and Wage Estimates
May 2021 State Occupational Employment and Wage Estimates
May 2021 Metropolitan and Nonmetropolitan Area Occupational Employment and Wage Estimates
May 2021 National Industry-Specific Occupational Employment and Wage Estimates
Last Modified Date: March 31, 2022