
An official website of the United States government
An official website of the United States government
The .gov means it's official.
Federal government websites often end in .gov or .mil. Before sharing sensitive information,
make sure you're on a federal government site.
The site is secure.
The
https:// ensures that you are connecting to the official website and that any
information you provide is encrypted and transmitted securely.
Develop instructional material, coordinate educational content, and incorporate current technology into instruction in order to provide guidelines to educators and instructors for developing curricula and conducting courses. May train and coach teachers. Includes educational consultants and specialists, and instructional material directors.
Employment estimate and mean wage estimates for Instructional Coordinators:
| Employment (1) | Employment RSE (3) |
Mean hourly wage |
Mean annual wage (2) |
Wage RSE (3) |
|---|---|---|---|---|
| 184,740 | 1.1 % | $ 33.92 | $ 70,560 | 0.5 % |
Percentile wage estimates for Instructional Coordinators:
| Percentile | 10% | 25% | 50% (Median) |
75% | 90% |
|---|---|---|---|---|---|
| Hourly Wage | $ 18.46 | $ 23.92 | $ 30.64 | $ 38.84 | $ 48.60 |
| Annual Wage (2) | $ 38,390 | $ 49,750 | $ 63,740 | $ 80,780 | $ 101,090 |
Industries with the highest published employment and wages for Instructional Coordinators are provided. For a list of all industries with employment in Instructional Coordinators, see the Create Customized Tables function.
Industries with the highest levels of employment in Instructional Coordinators:
| Industry | Employment (1) | Percent of industry employment | Hourly mean wage | Annual mean wage (2) |
|---|---|---|---|---|
| Elementary and Secondary Schools | 87,050 | 1.08 | $ 35.36 | $ 73,560 |
| Colleges, Universities, and Professional Schools | 29,440 | 0.99 | $ 32.94 | $ 68,510 |
| Educational Support Services | 14,300 | 7.34 | $ 33.03 | $ 68,710 |
| Junior Colleges | 7,590 | 1.22 | $ 29.59 | $ 61,540 |
| State Government, excluding schools and hospitals (OEWS Designation) | 7,520 | 0.34 | $ 36.02 | $ 74,930 |
Industries with the highest concentration of employment in Instructional Coordinators:
| Industry | Employment (1) | Percent of industry employment | Hourly mean wage | Annual mean wage (2) |
|---|---|---|---|---|
| Educational Support Services | 14,300 | 7.34 | $ 33.03 | $ 68,710 |
| Business Schools and Computer and Management Training | 3,350 | 4.68 | $ 34.56 | $ 71,890 |
| Technical and Trade Schools | 2,560 | 1.96 | $ 32.84 | $ 68,310 |
| Other Schools and Instruction | 5,480 | 1.38 | $ 26.24 | $ 54,580 |
| Junior Colleges | 7,590 | 1.22 | $ 29.59 | $ 61,540 |
Top paying industries for Instructional Coordinators:
| Industry | Employment (1) | Percent of industry employment | Hourly mean wage | Annual mean wage (2) |
|---|---|---|---|---|
| Electric Power Generation, Transmission and Distribution | 50 | 0.01 | $ 62.71 | $ 130,440 |
| Other Professional, Scientific, and Technical Services | 200 | 0.03 | $ 50.34 | $ 104,700 |
| Federal Executive Branch (OEWS Designation) | 2,500 | 0.12 | $ 48.20 | $ 100,250 |
| Navigational, Measuring, Electromedical, and Control Instruments Manufacturing | (8) | (8) | $ 46.92 | $ 97,600 |
| Nursing Care Facilities (Skilled Nursing Facilities) | 30 | (7) | $ 45.13 | $ 93,870 |
States and areas with the highest published employment, location quotients, and wages for Instructional Coordinators are provided. For a list of all areas with employment in Instructional Coordinators, see the Create Customized Tables function.
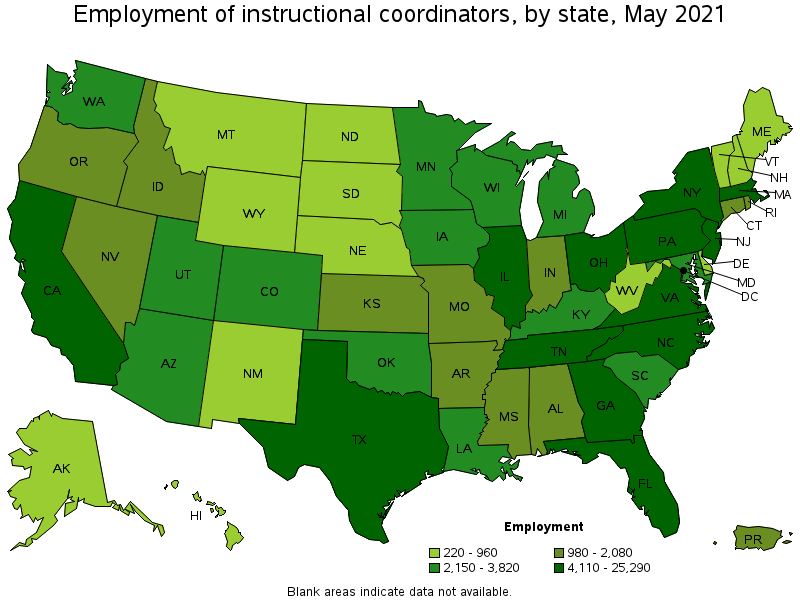
States with the highest employment level in Instructional Coordinators:
| State | Employment (1) | Employment per thousand jobs | Location quotient (9) | Hourly mean wage | Annual mean wage (2) |
|---|---|---|---|---|---|
| Texas | 25,290 | 2.07 | 1.58 | $ 33.50 | $ 69,680 |
| New York | 21,680 | 2.50 | 1.91 | $ 37.79 | $ 78,610 |
| California | 13,980 | 0.85 | 0.64 | $ 36.63 | $ 76,200 |
| Florida | 10,490 | 1.22 | 0.93 | $ 30.41 | $ 63,250 |
| Illinois | 7,620 | 1.36 | 1.03 | $ 32.78 | $ 68,180 |
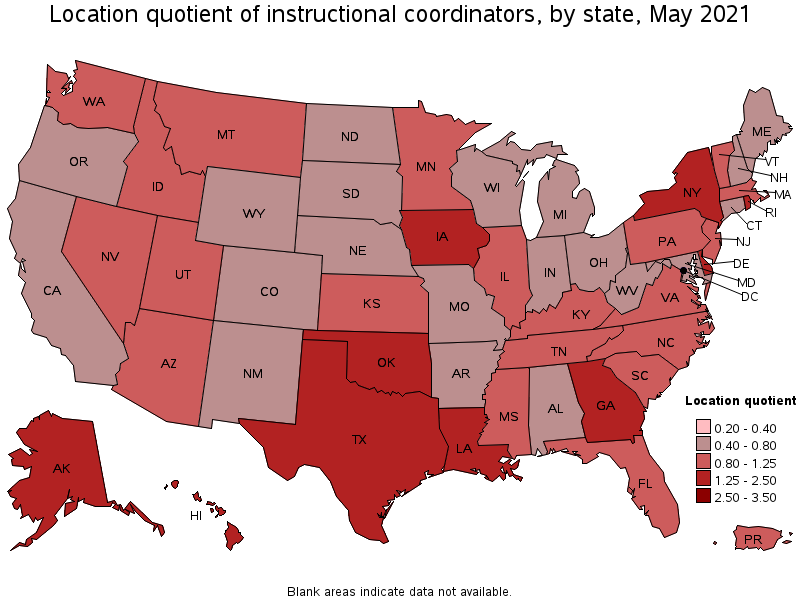
States with the highest concentration of jobs and location quotients in Instructional Coordinators:
| State | Employment (1) | Employment per thousand jobs | Location quotient (9) | Hourly mean wage | Annual mean wage (2) |
|---|---|---|---|---|---|
| New York | 21,680 | 2.50 | 1.91 | $ 37.79 | $ 78,610 |
| Rhode Island | 1,120 | 2.44 | 1.86 | $ 32.46 | $ 67,510 |
| Louisiana | 3,820 | 2.13 | 1.62 | $ 28.44 | $ 59,160 |
| Alaska | 630 | 2.12 | 1.62 | $ 34.36 | $ 71,480 |
| Delaware | 920 | 2.11 | 1.61 | $ 31.77 | $ 66,090 |
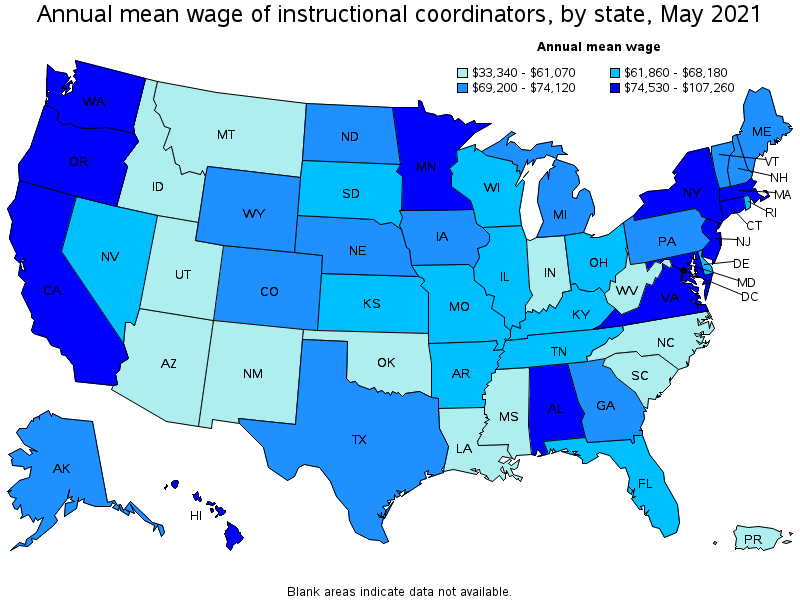
Top paying states for Instructional Coordinators:
| State | Employment (1) | Employment per thousand jobs | Location quotient (9) | Hourly mean wage | Annual mean wage (2) |
|---|---|---|---|---|---|
| District of Columbia | 1,350 | 2.04 | 1.55 | $ 51.57 | $ 107,260 |
| Washington | 3,360 | 1.05 | 0.80 | $ 39.86 | $ 82,900 |
| Oregon | 1,490 | 0.81 | 0.62 | $ 39.14 | $ 81,420 |
| Connecticut | 1,370 | 0.87 | 0.66 | $ 38.52 | $ 80,110 |
| Maryland | 2,640 | 1.04 | 0.79 | $ 38.21 | $ 79,470 |
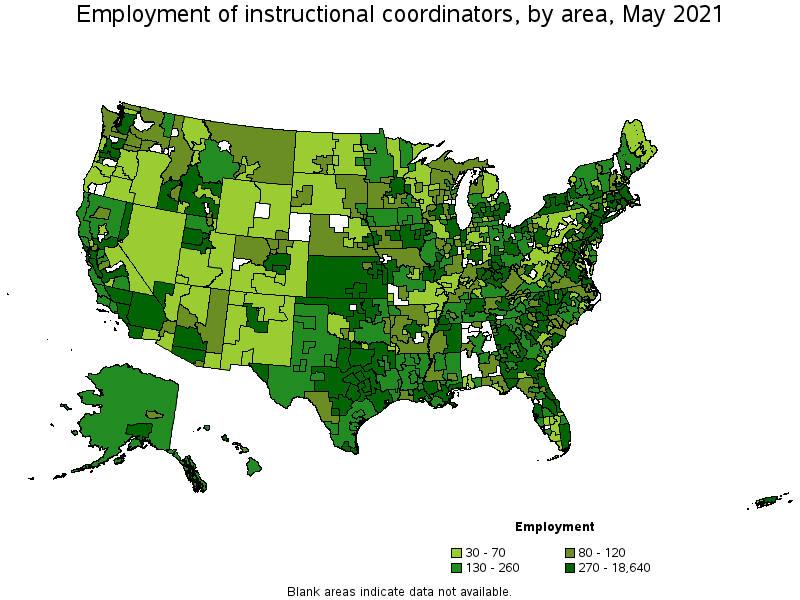
Metropolitan areas with the highest employment level in Instructional Coordinators:
| Metropolitan area | Employment (1) | Employment per thousand jobs | Location quotient (9) | Hourly mean wage | Annual mean wage (2) |
|---|---|---|---|---|---|
| New York-Newark-Jersey City, NY-NJ-PA | 18,640 | 2.15 | 1.64 | $ 37.88 | $ 78,780 |
| Dallas-Fort Worth-Arlington, TX | 6,860 | 1.91 | 1.46 | $ 34.63 | $ 72,040 |
| Houston-The Woodlands-Sugar Land, TX | 6,740 | 2.33 | 1.77 | $ 33.94 | $ 70,600 |
| Chicago-Naperville-Elgin, IL-IN-WI | 5,630 | 1.33 | 1.01 | $ 33.99 | $ 70,700 |
| Atlanta-Sandy Springs-Roswell, GA | 4,850 | 1.87 | 1.43 | $ 34.76 | $ 72,290 |
| Los Angeles-Long Beach-Anaheim, CA | 4,320 | 0.76 | 0.58 | $ 35.50 | $ 73,850 |
| Washington-Arlington-Alexandria, DC-VA-MD-WV | 4,130 | 1.41 | 1.07 | $ 45.08 | $ 93,760 |
| Boston-Cambridge-Nashua, MA-NH | 3,720 | 1.44 | 1.10 | $ 38.56 | $ 80,210 |
| Philadelphia-Camden-Wilmington, PA-NJ-DE-MD | 3,400 | 1.28 | 0.98 | $ 36.04 | $ 74,960 |
| Miami-Fort Lauderdale-West Palm Beach, FL | 3,180 | 1.30 | 0.99 | $ 30.83 | $ 64,130 |
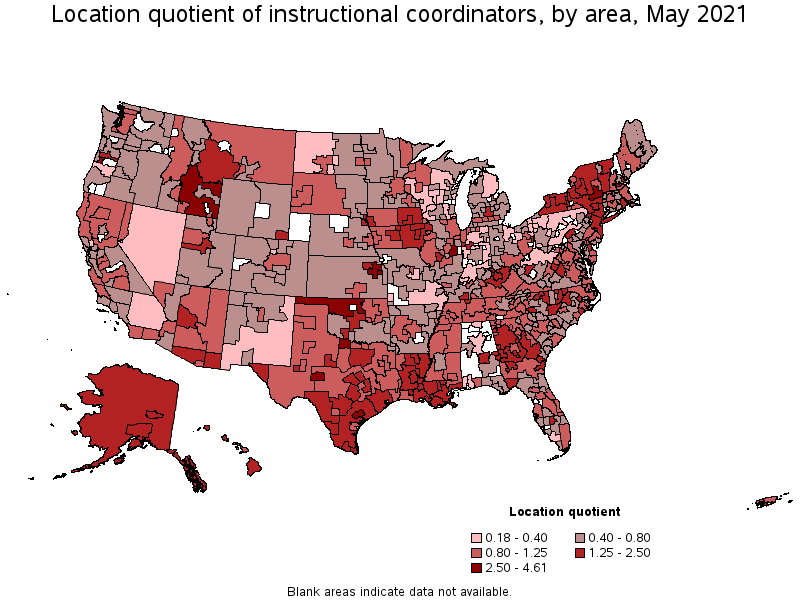
Metropolitan areas with the highest concentration of jobs and location quotients in Instructional Coordinators:
| Metropolitan area | Employment (1) | Employment per thousand jobs | Location quotient (9) | Hourly mean wage | Annual mean wage (2) |
|---|---|---|---|---|---|
| Lawrence, KS | 280 | 6.05 | 4.61 | $ 29.15 | $ 60,640 |
| Wichita Falls, TX | 280 | 5.25 | 4.00 | $ 35.01 | $ 72,830 |
| Victoria, TX | 190 | 5.09 | 3.88 | $ 32.46 | $ 67,510 |
| Corvallis, OR | 170 | 4.75 | 3.62 | $ 28.10 | $ 58,440 |
| Champaign-Urbana, IL | 390 | 3.99 | 3.05 | $ 27.41 | $ 57,010 |
| Topeka, KS | 380 | 3.52 | 2.68 | $ 33.85 | $ 70,410 |
| San Angelo, TX | 160 | 3.51 | 2.68 | $ 35.52 | $ 73,880 |
| Albany-Schenectady-Troy, NY | 1,440 | 3.43 | 2.61 | $ 36.34 | $ 75,580 |
| Auburn-Opelika, AL | 180 | 3.10 | 2.37 | $ 30.19 | $ 62,790 |
| McAllen-Edinburg-Mission, TX | 810 | 3.10 | 2.37 | $ 31.68 | $ 65,890 |
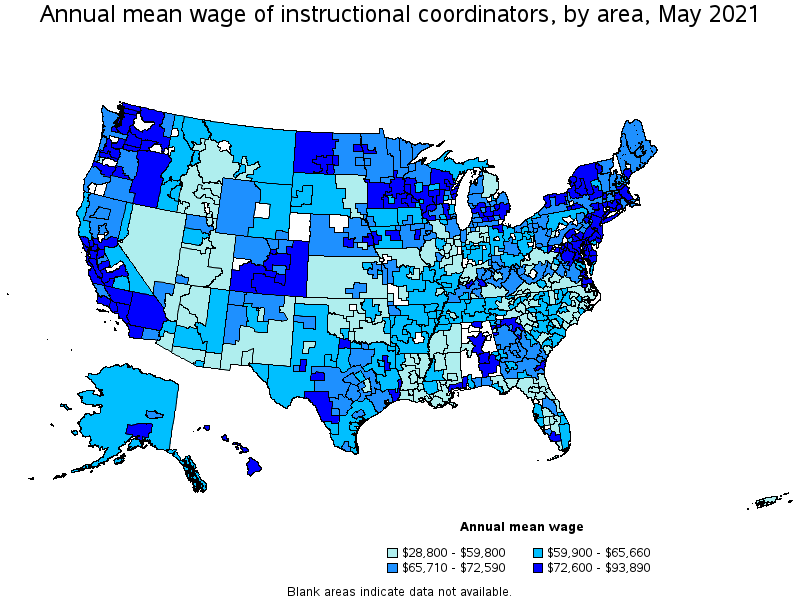
Top paying metropolitan areas for Instructional Coordinators:
| Metropolitan area | Employment (1) | Employment per thousand jobs | Location quotient (9) | Hourly mean wage | Annual mean wage (2) |
|---|---|---|---|---|---|
| Salem, OR | 300 | 1.79 | 1.36 | $ 45.14 | $ 93,890 |
| Washington-Arlington-Alexandria, DC-VA-MD-WV | 4,130 | 1.41 | 1.07 | $ 45.08 | $ 93,760 |
| Kennewick-Richland, WA | 100 | 0.82 | 0.63 | $ 43.96 | $ 91,430 |
| Grand Island, NE | 60 | 1.53 | 1.16 | $ 42.61 | $ 88,630 |
| Hanford-Corcoran, CA | 40 | 0.86 | 0.66 | $ 42.49 | $ 88,370 |
| San Jose-Sunnyvale-Santa Clara, CA | 820 | 0.77 | 0.58 | $ 42.18 | $ 87,730 |
| Yakima, WA | 90 | 0.94 | 0.72 | $ 41.86 | $ 87,060 |
| Bridgeport-Stamford-Norwalk, CT | 270 | 0.71 | 0.54 | $ 41.80 | $ 86,930 |
| Bremerton-Silverdale, WA | 60 | 0.69 | 0.53 | $ 41.75 | $ 86,840 |
| Riverside-San Bernardino-Ontario, CA | 730 | 0.48 | 0.36 | $ 41.38 | $ 86,070 |
Nonmetropolitan areas with the highest employment in Instructional Coordinators:
| Nonmetropolitan area | Employment (1) | Employment per thousand jobs | Location quotient (9) | Hourly mean wage | Annual mean wage (2) |
|---|---|---|---|---|---|
| Central Kentucky nonmetropolitan area | 450 | 2.58 | 1.97 | $ 32.40 | $ 67,400 |
| Piedmont North Carolina nonmetropolitan area | 430 | 1.77 | 1.35 | $ 30.83 | $ 64,120 |
| Kansas nonmetropolitan area | 370 | 0.98 | 0.75 | $ 24.56 | $ 51,090 |
| North Texas Region of Texas nonmetropolitan area | 360 | 1.36 | 1.04 | $ 29.88 | $ 62,150 |
| Southeast Iowa nonmetropolitan area | 350 | 1.66 | 1.27 | $ 32.84 | $ 68,310 |
Nonmetropolitan areas with the highest concentration of jobs and location quotients in Instructional Coordinators:
| Nonmetropolitan area | Employment (1) | Employment per thousand jobs | Location quotient (9) | Hourly mean wage | Annual mean wage (2) |
|---|---|---|---|---|---|
| Southeast-Central Idaho nonmetropolitan area | 310 | 3.53 | 2.69 | $ 25.63 | $ 53,300 |
| Northwest Oklahoma nonmetropolitan area | 300 | 3.28 | 2.50 | $ 23.00 | $ 47,840 |
| Central Louisiana nonmetropolitan area | 220 | 2.93 | 2.24 | $ 25.69 | $ 53,430 |
| Northern Vermont nonmetropolitan area | 190 | 2.88 | 2.19 | $ 32.80 | $ 68,220 |
| Northeast Louisiana nonmetropolitan area | 170 | 2.70 | 2.06 | $ 28.22 | $ 58,700 |
Top paying nonmetropolitan areas for Instructional Coordinators:
| Nonmetropolitan area | Employment (1) | Employment per thousand jobs | Location quotient (9) | Hourly mean wage | Annual mean wage (2) |
|---|---|---|---|---|---|
| South Central Wisconsin nonmetropolitan area | 100 | 0.52 | 0.39 | $ 40.37 | $ 83,970 |
| Western Wisconsin nonmetropolitan area | 70 | 0.50 | 0.38 | $ 39.15 | $ 81,440 |
| Maryland nonmetropolitan area | 40 | 0.64 | 0.48 | $ 37.76 | $ 78,550 |
| Southeast Alabama nonmetropolitan area | 80 | 0.98 | 0.75 | $ 37.63 | $ 78,270 |
| Eastern Washington nonmetropolitan area | 90 | 1.01 | 0.77 | $ 37.37 | $ 77,720 |
These estimates are calculated with data collected from employers in all industry sectors, all metropolitan and nonmetropolitan areas, and all states and the District of Columbia. The top employment and wage figures are provided above. The complete list is available in the downloadable XLS files.
The percentile wage estimate is the value of a wage below which a certain percent of workers fall. The median wage is the 50th percentile wage estimate—50 percent of workers earn less than the median and 50 percent of workers earn more than the median. More about percentile wages.
(1) Estimates for detailed occupations do not sum to the totals because the totals include occupations not shown separately. Estimates do not include self-employed workers.
(2) Annual wages have been calculated by multiplying the hourly mean wage by a "year-round, full-time" hours figure of 2,080 hours; for those occupations where there is not an hourly wage published, the annual wage has been directly calculated from the reported survey data.
(3) The relative standard error (RSE) is a measure of the reliability of a survey statistic. The smaller the relative standard error, the more precise the estimate.
(7) The value is less than .005 percent of industry employment.
(8) Estimate not released.
(9) The location quotient is the ratio of the area concentration of occupational employment to the national average concentration. A location quotient greater than one indicates the occupation has a higher share of employment than average, and a location quotient less than one indicates the occupation is less prevalent in the area than average.
Other OEWS estimates and related information:
May 2021 National Occupational Employment and Wage Estimates
May 2021 State Occupational Employment and Wage Estimates
May 2021 Metropolitan and Nonmetropolitan Area Occupational Employment and Wage Estimates
May 2021 National Industry-Specific Occupational Employment and Wage Estimates
Last Modified Date: March 31, 2022