
An official website of the United States government
An official website of the United States government
The .gov means it's official.
Federal government websites often end in .gov or .mil. Before sharing sensitive information,
make sure you're on a federal government site.
The site is secure.
The
https:// ensures that you are connecting to the official website and that any
information you provide is encrypted and transmitted securely.
Assist faculty or other instructional staff in postsecondary institutions by performing instructional support activities, such as developing teaching materials, leading discussion groups, preparing and giving examinations, and grading examinations or papers. Graduate students who teach one or more full courses should be classified in the 25-1000 minor group.
Employment estimate and mean wage estimates for Teaching Assistants, Postsecondary:
| Employment (1) | Employment RSE (3) |
Mean hourly wage |
Mean annual wage (2) |
Mean wage RSE (3) |
|---|---|---|---|---|
| 121,290 | 0.5 % | (4) | $ 41,170 | 0.3 % |
Percentile wage estimates for Teaching Assistants, Postsecondary:
| Percentile | 10% | 25% | 50% (Median) |
75% | 90% |
|---|---|---|---|---|---|
| Annual Wage (2) | $ 22,730 | $ 29,670 | $ 38,040 | $ 49,010 | $ 62,260 |
Industries with the highest published employment and wages for Teaching Assistants, Postsecondary are provided. For a list of all industries with employment in Teaching Assistants, Postsecondary, see the Create Customized Tables function.
Industries with the highest levels of employment in Teaching Assistants, Postsecondary:
| Industry | Employment (1) | Percent of industry employment | Hourly mean wage | Annual mean wage (2) |
|---|---|---|---|---|
| Colleges, Universities, and Professional Schools | 104,070 | 3.49 | (4) | $ 41,150 |
| Junior Colleges | 14,640 | 2.36 | (4) | $ 41,750 |
| Grantmaking and Giving Services | 1,020 | 0.73 | (4) | $ 38,360 |
| Technical and Trade Schools | 620 | 0.47 | (4) | $ 32,260 |
| General Medical and Surgical Hospitals | 350 | 0.01 | (4) | $ 45,550 |
Industries with the highest concentration of employment in Teaching Assistants, Postsecondary:
| Industry | Employment (1) | Percent of industry employment | Hourly mean wage | Annual mean wage (2) |
|---|---|---|---|---|
| Colleges, Universities, and Professional Schools | 104,070 | 3.49 | (4) | $ 41,150 |
| Junior Colleges | 14,640 | 2.36 | (4) | $ 41,750 |
| Grantmaking and Giving Services | 1,020 | 0.73 | (4) | $ 38,360 |
| Technical and Trade Schools | 620 | 0.47 | (4) | $ 32,260 |
| Educational Support Services | 150 | 0.08 | (4) | $ 32,760 |
Top paying industries for Teaching Assistants, Postsecondary:
| Industry | Employment (1) | Percent of industry employment | Hourly mean wage | Annual mean wage (2) |
|---|---|---|---|---|
| State Government, excluding schools and hospitals (OEWS Designation) | 60 | (7) | (4) | $ 46,040 |
| General Medical and Surgical Hospitals | 350 | 0.01 | (4) | $ 45,550 |
| Business Schools and Computer and Management Training | (8) | (8) | (4) | $ 42,620 |
| Junior Colleges | 14,640 | 2.36 | (4) | $ 41,750 |
| Other Schools and Instruction | 280 | 0.07 | (4) | $ 41,580 |
States and areas with the highest published employment, location quotients, and wages for Teaching Assistants, Postsecondary are provided. For a list of all areas with employment in Teaching Assistants, Postsecondary, see the Create Customized Tables function.
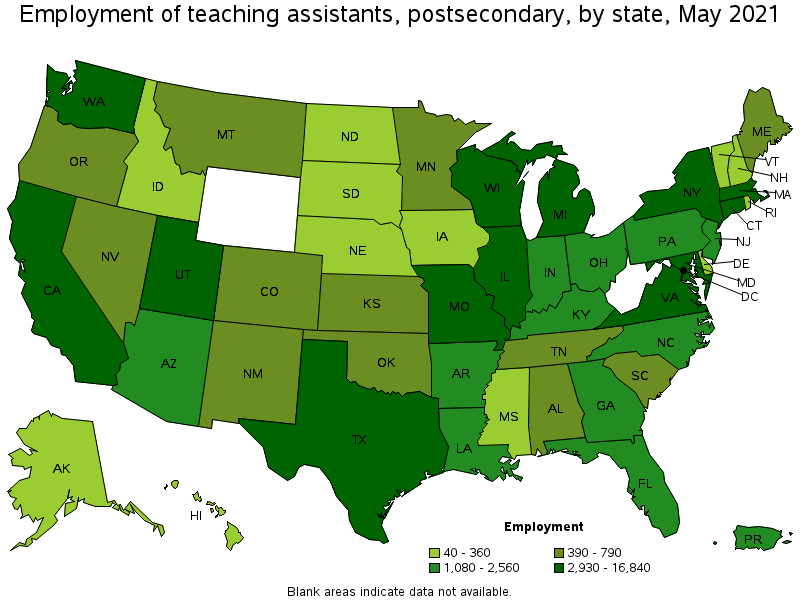
States with the highest employment level in Teaching Assistants, Postsecondary:
| State | Employment (1) | Employment per thousand jobs | Location quotient (9) | Hourly mean wage | Annual mean wage (2) |
|---|---|---|---|---|---|
| California | 16,840 | 1.02 | 1.18 | (4) | $ 43,330 |
| New York | 15,080 | 1.74 | 2.02 | (4) | $ 49,480 |
| Michigan | 13,170 | 3.24 | 3.77 | (4) | $ 42,880 |
| Texas | 9,310 | 0.76 | 0.88 | (4) | $ 27,250 |
| Illinois | 6,170 | 1.10 | 1.28 | (4) | $ 38,050 |
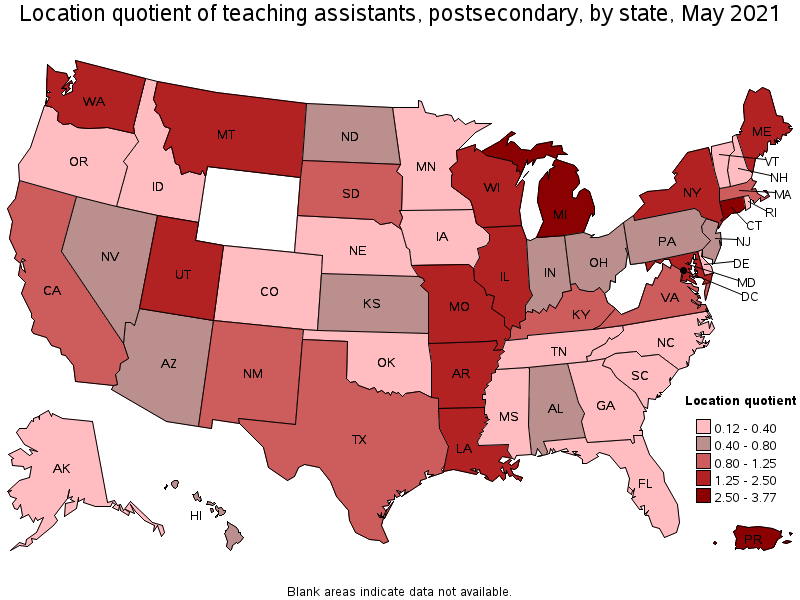
States with the highest concentration of jobs and location quotients in Teaching Assistants, Postsecondary:
| State | Employment (1) | Employment per thousand jobs | Location quotient (9) | Hourly mean wage | Annual mean wage (2) |
|---|---|---|---|---|---|
| Michigan | 13,170 | 3.24 | 3.77 | (4) | $ 42,880 |
| Connecticut | 3,780 | 2.40 | 2.79 | (4) | $ 58,110 |
| Maryland | 5,070 | 1.99 | 2.31 | (4) | $ 52,210 |
| Utah | 2,930 | 1.88 | 2.19 | (4) | $ 46,490 |
| New York | 15,080 | 1.74 | 2.02 | (4) | $ 49,480 |
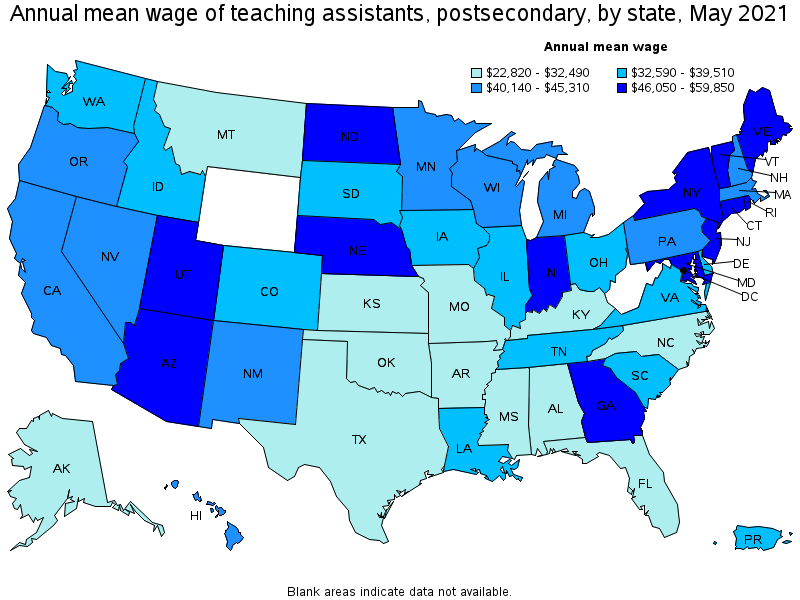
Top paying states for Teaching Assistants, Postsecondary:
| State | Employment (1) | Employment per thousand jobs | Location quotient (9) | Hourly mean wage | Annual mean wage (2) |
|---|---|---|---|---|---|
| Vermont | 40 | 0.13 | 0.15 | (4) | $ 59,850 |
| Connecticut | 3,780 | 2.40 | 2.79 | (4) | $ 58,110 |
| Maryland | 5,070 | 1.99 | 2.31 | (4) | $ 52,210 |
| Georgia | 1,440 | 0.33 | 0.38 | (4) | $ 51,670 |
| New York | 15,080 | 1.74 | 2.02 | (4) | $ 49,480 |
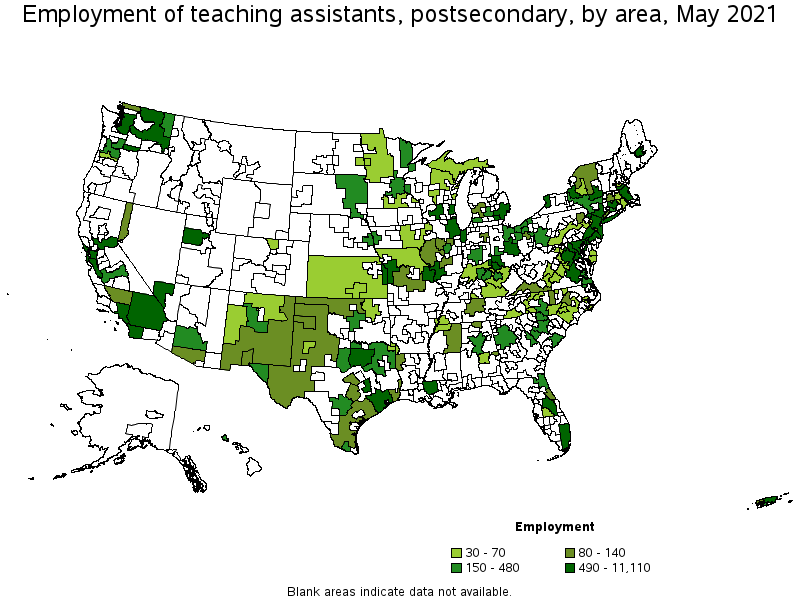
Metropolitan areas with the highest employment level in Teaching Assistants, Postsecondary:
| Metropolitan area | Employment (1) | Employment per thousand jobs | Location quotient (9) | Hourly mean wage | Annual mean wage (2) |
|---|---|---|---|---|---|
| Ann Arbor, MI | 11,110 | 55.14 | 64.05 | (4) | $ 43,860 |
| New York-Newark-Jersey City, NY-NJ-PA | 10,430 | 1.20 | 1.40 | (4) | $ 52,630 |
| Los Angeles-Long Beach-Anaheim, CA | 6,800 | 1.19 | 1.38 | (4) | $ 40,670 |
| Washington-Arlington-Alexandria, DC-VA-MD-WV | 5,050 | 1.72 | 2.00 | (4) | $ 51,220 |
| Chicago-Naperville-Elgin, IL-IN-WI | 3,600 | 0.85 | 0.99 | (4) | $ 36,690 |
| Boston-Cambridge-Nashua, MA-NH | 3,230 | 1.25 | 1.45 | (4) | $ 45,400 |
| Dallas-Fort Worth-Arlington, TX | 3,040 | 0.85 | 0.98 | (4) | $ 24,500 |
| Seattle-Tacoma-Bellevue, WA | 3,010 | 1.57 | 1.83 | (4) | $ 40,780 |
| Hartford-West Hartford-East Hartford, CT | 2,790 | 5.12 | 5.95 | (4) | $ 59,560 |
| San Diego-Carlsbad, CA | 2,490 | 1.79 | 2.08 | (4) | $ 46,810 |
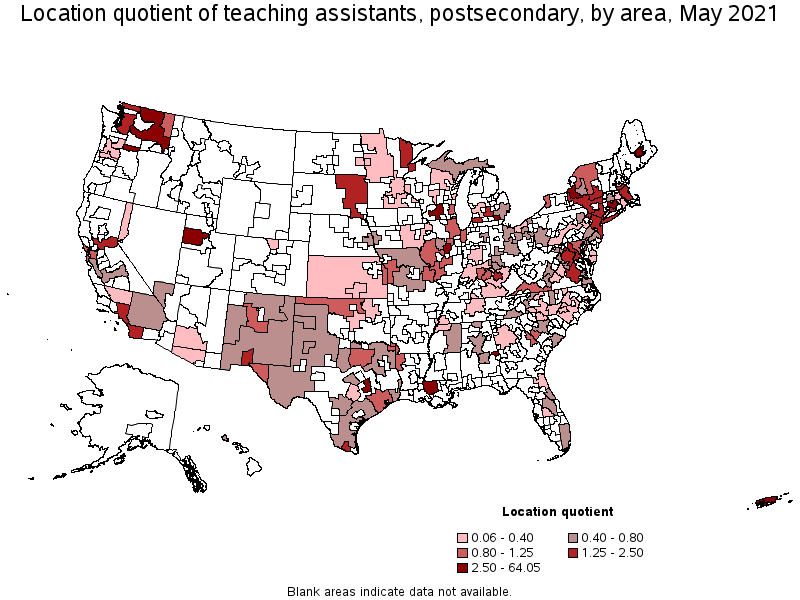
Metropolitan areas with the highest concentration of jobs and location quotients in Teaching Assistants, Postsecondary:
| Metropolitan area | Employment (1) | Employment per thousand jobs | Location quotient (9) | Hourly mean wage | Annual mean wage (2) |
|---|---|---|---|---|---|
| Ann Arbor, MI | 11,110 | 55.14 | 64.05 | (4) | $ 43,860 |
| College Station-Bryan, TX | 1,490 | 13.14 | 15.26 | (4) | $ 23,830 |
| Bangor, ME | 560 | 8.99 | 10.45 | (4) | $ 48,710 |
| Madison, WI | 2,180 | 5.78 | 6.71 | (4) | $ 42,770 |
| Hartford-West Hartford-East Hartford, CT | 2,790 | 5.12 | 5.95 | (4) | $ 59,560 |
| Baton Rouge, LA | 1,730 | 4.71 | 5.47 | (4) | $ 36,370 |
| Bloomington, IL | 260 | 3.07 | 3.56 | (4) | $ 35,620 |
| Salt Lake City, UT | 2,170 | 2.92 | 3.39 | (4) | $ 50,320 |
| Auburn-Opelika, AL | 140 | 2.41 | 2.80 | (4) | $ 44,840 |
| Syracuse, NY | 670 | 2.40 | 2.79 | (4) | $ 49,880 |

Top paying metropolitan areas for Teaching Assistants, Postsecondary:
| Metropolitan area | Employment (1) | Employment per thousand jobs | Location quotient (9) | Hourly mean wage | Annual mean wage (2) |
|---|---|---|---|---|---|
| Hartford-West Hartford-East Hartford, CT | 2,790 | 5.12 | 5.95 | (4) | $ 59,560 |
| Bridgeport-Stamford-Norwalk, CT | 130 | 0.34 | 0.39 | (4) | $ 59,380 |
| Reno, NV | 80 | 0.33 | 0.38 | (4) | $ 57,420 |
| Springfield, MA-CT | 140 | 0.46 | 0.53 | (4) | $ 55,990 |
| Norwich-New London-Westerly, CT-RI | (8) | (8) | (8) | (4) | $ 54,490 |
| Phoenix-Mesa-Scottsdale, AZ | 460 | 0.22 | 0.25 | (4) | $ 53,400 |
| Buffalo-Cheektowaga-Niagara Falls, NY | 490 | 0.99 | 1.15 | (4) | $ 52,790 |
| New York-Newark-Jersey City, NY-NJ-PA | 10,430 | 1.20 | 1.40 | (4) | $ 52,630 |
| San Jose-Sunnyvale-Santa Clara, CA | 650 | 0.61 | 0.71 | (4) | $ 52,180 |
| Washington-Arlington-Alexandria, DC-VA-MD-WV | 5,050 | 1.72 | 2.00 | (4) | $ 51,220 |
Nonmetropolitan areas with the highest employment in Teaching Assistants, Postsecondary:
| Nonmetropolitan area | Employment (1) | Employment per thousand jobs | Location quotient (9) | Hourly mean wage | Annual mean wage (2) |
|---|---|---|---|---|---|
| Eastern Washington nonmetropolitan area | 630 | 6.73 | 7.81 | (4) | $ 35,120 |
| East South Dakota nonmetropolitan area | 230 | 1.82 | 2.11 | (4) | $ 34,350 |
| Central East New York nonmetropolitan area | 190 | 1.23 | 1.43 | (4) | $ 42,600 |
| North Texas Region of Texas nonmetropolitan area | 170 | 0.63 | 0.73 | (4) | $ 35,160 |
| North Northeastern Ohio nonmetropolitan area (noncontiguous) | 150 | 0.49 | 0.57 | (4) | $ 23,750 |
Nonmetropolitan areas with the highest concentration of jobs and location quotients in Teaching Assistants, Postsecondary:
| Nonmetropolitan area | Employment (1) | Employment per thousand jobs | Location quotient (9) | Hourly mean wage | Annual mean wage (2) |
|---|---|---|---|---|---|
| Eastern Washington nonmetropolitan area | 630 | 6.73 | 7.81 | (4) | $ 35,120 |
| East South Dakota nonmetropolitan area | 230 | 1.82 | 2.11 | (4) | $ 34,350 |
| Central East New York nonmetropolitan area | 190 | 1.23 | 1.43 | (4) | $ 42,600 |
| Capital/Northern New York nonmetropolitan area | 130 | 0.98 | 1.14 | (4) | $ 41,340 |
| Northwest Oklahoma nonmetropolitan area | 90 | 0.98 | 1.13 | (4) | $ 29,300 |
Top paying nonmetropolitan areas for Teaching Assistants, Postsecondary:
| Nonmetropolitan area | Employment (1) | Employment per thousand jobs | Location quotient (9) | Hourly mean wage | Annual mean wage (2) |
|---|---|---|---|---|---|
| Southeast Minnesota nonmetropolitan area | 40 | 0.28 | 0.32 | (4) | $ 45,430 |
| Northwest Minnesota nonmetropolitan area | 30 | 0.17 | 0.20 | (4) | $ 44,620 |
| Central East New York nonmetropolitan area | 190 | 1.23 | 1.43 | (4) | $ 42,600 |
| Northeastern Wisconsin nonmetropolitan area | 30 | 0.17 | 0.20 | (4) | $ 42,220 |
| Central Kentucky nonmetropolitan area | 50 | 0.28 | 0.33 | (4) | $ 41,990 |
These estimates are calculated with data collected from employers in all industry sectors, all metropolitan and nonmetropolitan areas, and all states and the District of Columbia. The top employment and wage figures are provided above. The complete list is available in the downloadable XLS files.
The percentile wage estimate is the value of a wage below which a certain percent of workers fall. The median wage is the 50th percentile wage estimate—50 percent of workers earn less than the median and 50 percent of workers earn more than the median. More about percentile wages.
(1) Estimates for detailed occupations do not sum to the totals because the totals include occupations not shown separately. Estimates do not include self-employed workers.
(2) Annual wages have been calculated by multiplying the hourly mean wage by a "year-round, full-time" hours figure of 2,080 hours; for those occupations where there is not an hourly wage published, the annual wage has been directly calculated from the reported survey data.
(3) The relative standard error (RSE) is a measure of the reliability of a survey statistic. The smaller the relative standard error, the more precise the estimate.
(4) Wages for some occupations that do not generally work year-round, full time, are reported either as hourly wages or annual salaries depending on how they are typically paid.
(7) The value is less than .005 percent of industry employment.
(8) Estimate not released.
(9) The location quotient is the ratio of the area concentration of occupational employment to the national average concentration. A location quotient greater than one indicates the occupation has a higher share of employment than average, and a location quotient less than one indicates the occupation is less prevalent in the area than average.
Other OEWS estimates and related information:
May 2021 National Occupational Employment and Wage Estimates
May 2021 State Occupational Employment and Wage Estimates
May 2021 Metropolitan and Nonmetropolitan Area Occupational Employment and Wage Estimates
May 2021 National Industry-Specific Occupational Employment and Wage Estimates
Last Modified Date: March 31, 2022