
An official website of the United States government
An official website of the United States government
The .gov means it's official.
Federal government websites often end in .gov or .mil. Before sharing sensitive information,
make sure you're on a federal government site.
The site is secure.
The
https:// ensures that you are connecting to the official website and that any
information you provide is encrypted and transmitted securely.
Create or reproduce handmade objects for sale and exhibition using a variety of techniques, such as welding, weaving, pottery, and needlecraft.
Employment estimate and mean wage estimates for Craft Artists:
| Employment (1) | Employment RSE (3) |
Mean hourly wage |
Mean annual wage (2) |
Wage RSE (3) |
|---|---|---|---|---|
| 3,740 | 7.6 % | $ 19.58 | $ 40,730 | 3.6 % |
Percentile wage estimates for Craft Artists:
| Percentile | 10% | 25% | 50% (Median) |
75% | 90% |
|---|---|---|---|---|---|
| Hourly Wage | $ 10.94 | $ 13.86 | $ 17.27 | $ 22.68 | $ 29.47 |
| Annual Wage (2) | $ 22,760 | $ 28,830 | $ 35,930 | $ 47,170 | $ 61,290 |
Industries with the highest published employment and wages for Craft Artists are provided. For a list of all industries with employment in Craft Artists, see the Create Customized Tables function.
Industries with the highest levels of employment in Craft Artists:
| Industry | Employment (1) | Percent of industry employment | Hourly mean wage | Annual mean wage (2) |
|---|---|---|---|---|
| Independent Artists, Writers, and Performers | 1,170 | 2.59 | $ 16.06 | $ 33,410 |
| Nonmetallic Mineral Product Manufacturing | 400 | 0.10 | $ 17.38 | $ 36,150 |
| Sporting Goods, Hobby, and Musical Instrument Stores | 310 | 0.07 | $ 17.08 | $ 35,520 |
| Management of Companies and Enterprises | 170 | 0.01 | $ 35.24 | $ 73,290 |
| Miscellaneous Store Retailers (4532 and 4533 only) | 130 | 0.04 | $ 18.69 | $ 38,870 |
Industries with the highest concentration of employment in Craft Artists:
| Industry | Employment (1) | Percent of industry employment | Hourly mean wage | Annual mean wage (2) |
|---|---|---|---|---|
| Independent Artists, Writers, and Performers | 1,170 | 2.59 | $ 16.06 | $ 33,410 |
| Nonmetallic Mineral Product Manufacturing | 400 | 0.10 | $ 17.38 | $ 36,150 |
| Sporting Goods, Hobby, and Musical Instrument Stores | 310 | 0.07 | $ 17.08 | $ 35,520 |
| Museums, Historical Sites, and Similar Institutions | 80 | 0.06 | $ 18.50 | $ 38,480 |
| Apparel, Piece Goods, and Notions Merchant Wholesalers | 60 | 0.05 | $ 15.34 | $ 31,910 |
Top paying industries for Craft Artists:
| Industry | Employment (1) | Percent of industry employment | Hourly mean wage | Annual mean wage (2) |
|---|---|---|---|---|
| Advertising, Public Relations, and Related Services | (8) | (8) | $ 50.28 | $ 104,580 |
| Motion Picture and Video Industries | 90 | 0.03 | $ 42.38 | $ 88,150 |
| Management of Companies and Enterprises | 170 | 0.01 | $ 35.24 | $ 73,290 |
| Local Government, excluding schools and hospitals (OEWS Designation) | 40 | (7) | $ 31.47 | $ 65,460 |
| Other Wood Product Manufacturing | (8) | (8) | $ 25.98 | $ 54,030 |
States and areas with the highest published employment, location quotients, and wages for Craft Artists are provided. For a list of all areas with employment in Craft Artists, see the Create Customized Tables function.
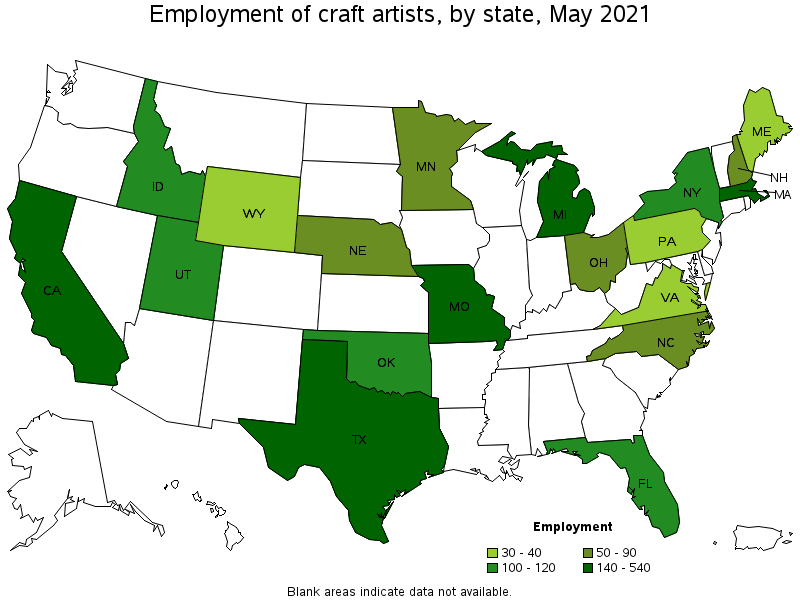
States with the highest employment level in Craft Artists:
| State | Employment (1) | Employment per thousand jobs | Location quotient (9) | Hourly mean wage | Annual mean wage (2) |
|---|---|---|---|---|---|
| Texas | 540 | 0.04 | 1.67 | $ 15.22 | $ 31,670 |
| Michigan | 410 | 0.10 | 3.82 | $ 16.93 | $ 35,210 |
| California | 320 | 0.02 | 0.73 | $ 31.50 | $ 65,510 |
| Missouri | 250 | 0.09 | 3.49 | $ 23.12 | $ 48,090 |
| Massachusetts | 140 | 0.04 | 1.54 | $ 19.63 | $ 40,820 |
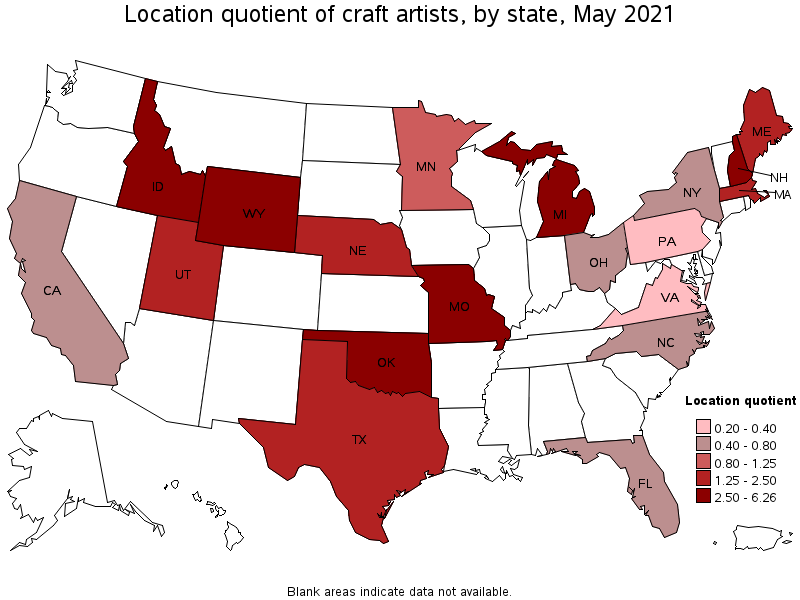
States with the highest concentration of jobs and location quotients in Craft Artists:
| State | Employment (1) | Employment per thousand jobs | Location quotient (9) | Hourly mean wage | Annual mean wage (2) |
|---|---|---|---|---|---|
| Wyoming | 40 | 0.17 | 6.26 | $ 16.24 | $ 33,770 |
| Idaho | 110 | 0.14 | 5.26 | $ 19.15 | $ 39,830 |
| Michigan | 410 | 0.10 | 3.82 | $ 16.93 | $ 35,210 |
| Missouri | 250 | 0.09 | 3.49 | $ 23.12 | $ 48,090 |
| New Hampshire | 50 | 0.08 | 3.09 | $ 19.02 | $ 39,550 |
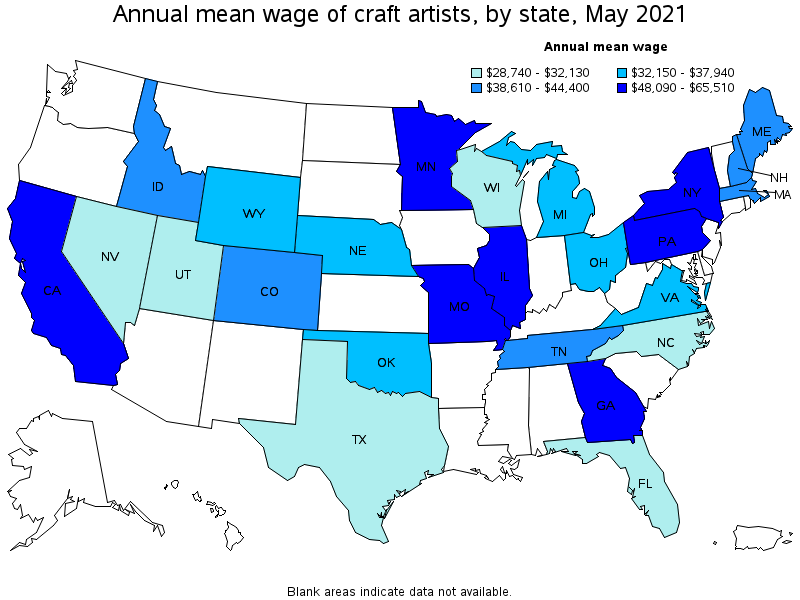
Top paying states for Craft Artists:
| State | Employment (1) | Employment per thousand jobs | Location quotient (9) | Hourly mean wage | Annual mean wage (2) |
|---|---|---|---|---|---|
| California | 320 | 0.02 | 0.73 | $ 31.50 | $ 65,510 |
| Georgia | (8) | (8) | (8) | $ 24.78 | $ 51,550 |
| Pennsylvania | 30 | 0.01 | 0.20 | $ 24.22 | $ 50,390 |
| Minnesota | 90 | 0.03 | 1.20 | $ 24.13 | $ 50,180 |
| New York | 120 | 0.01 | 0.52 | $ 23.93 | $ 49,770 |
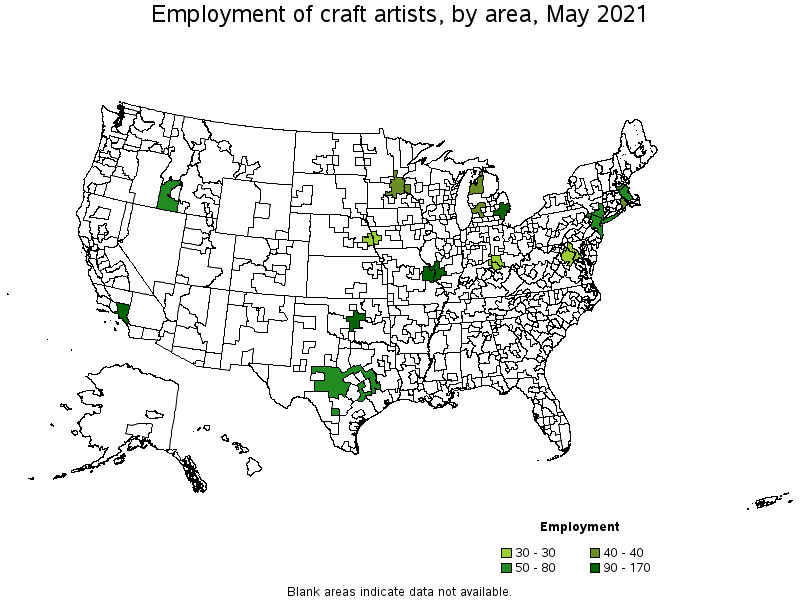
Metropolitan areas with the highest employment level in Craft Artists:
| Metropolitan area | Employment (1) | Employment per thousand jobs | Location quotient (9) | Hourly mean wage | Annual mean wage (2) |
|---|---|---|---|---|---|
| St. Louis, MO-IL | 170 | 0.13 | 5.04 | $ 26.99 | $ 56,140 |
| Detroit-Warren-Dearborn, MI | 130 | 0.07 | 2.69 | $ 15.91 | $ 33,100 |
| Los Angeles-Long Beach-Anaheim, CA | 120 | 0.02 | 0.80 | $ 34.66 | $ 72,090 |
| Oklahoma City, OK | 90 | 0.14 | 5.36 | $ 16.36 | $ 34,040 |
| Boston-Cambridge-Nashua, MA-NH | 80 | 0.03 | 1.16 | $ 20.42 | $ 42,480 |
| New York-Newark-Jersey City, NY-NJ-PA | 70 | 0.01 | 0.32 | $ 29.87 | $ 62,140 |
| Boise City, ID | 50 | 0.14 | 5.35 | $ 18.52 | $ 38,520 |
| Minneapolis-St. Paul-Bloomington, MN-WI | 40 | 0.02 | 0.91 | $ 27.70 | $ 57,610 |
| Grand Rapids-Wyoming, MI | 40 | 0.08 | 3.15 | $ 15.79 | $ 32,840 |
| Providence-Warwick, RI-MA | 40 | 0.08 | 2.83 | $ 24.20 | $ 50,330 |
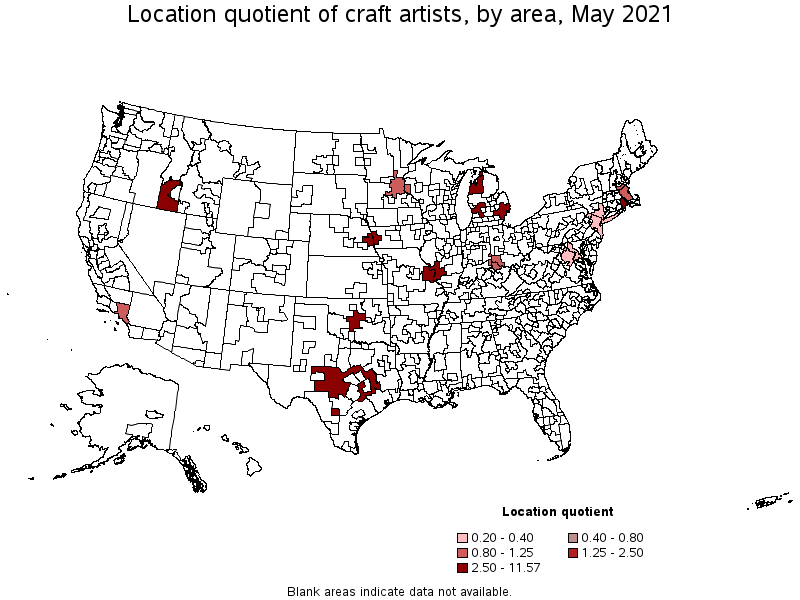
Metropolitan areas with the highest concentration of jobs and location quotients in Craft Artists:
| Metropolitan area | Employment (1) | Employment per thousand jobs | Location quotient (9) | Hourly mean wage | Annual mean wage (2) |
|---|---|---|---|---|---|
| Oklahoma City, OK | 90 | 0.14 | 5.36 | $ 16.36 | $ 34,040 |
| Boise City, ID | 50 | 0.14 | 5.35 | $ 18.52 | $ 38,520 |
| St. Louis, MO-IL | 170 | 0.13 | 5.04 | $ 26.99 | $ 56,140 |
| Grand Rapids-Wyoming, MI | 40 | 0.08 | 3.15 | $ 15.79 | $ 32,840 |
| Providence-Warwick, RI-MA | 40 | 0.08 | 2.83 | $ 24.20 | $ 50,330 |
| Detroit-Warren-Dearborn, MI | 130 | 0.07 | 2.69 | $ 15.91 | $ 33,100 |
| Omaha-Council Bluffs, NE-IA | 30 | 0.07 | 2.65 | $ 12.08 | $ 25,130 |
| Boston-Cambridge-Nashua, MA-NH | 80 | 0.03 | 1.16 | $ 20.42 | $ 42,480 |
| Cincinnati, OH-KY-IN | 30 | 0.03 | 1.13 | $ 19.32 | $ 40,180 |
| Minneapolis-St. Paul-Bloomington, MN-WI | 40 | 0.02 | 0.91 | $ 27.70 | $ 57,610 |
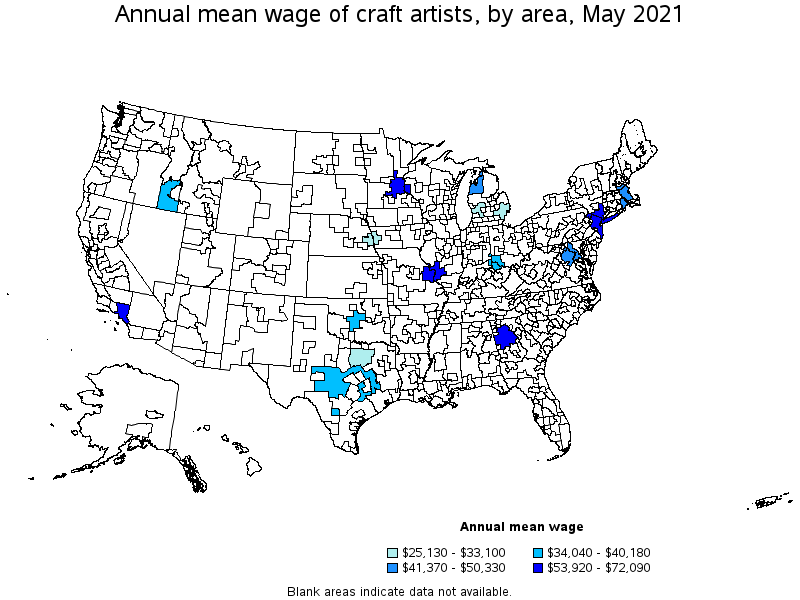
Top paying metropolitan areas for Craft Artists:
| Metropolitan area | Employment (1) | Employment per thousand jobs | Location quotient (9) | Hourly mean wage | Annual mean wage (2) |
|---|---|---|---|---|---|
| Los Angeles-Long Beach-Anaheim, CA | 120 | 0.02 | 0.80 | $ 34.66 | $ 72,090 |
| New York-Newark-Jersey City, NY-NJ-PA | 70 | 0.01 | 0.32 | $ 29.87 | $ 62,140 |
| Minneapolis-St. Paul-Bloomington, MN-WI | 40 | 0.02 | 0.91 | $ 27.70 | $ 57,610 |
| St. Louis, MO-IL | 170 | 0.13 | 5.04 | $ 26.99 | $ 56,140 |
| Atlanta-Sandy Springs-Roswell, GA | (8) | (8) | (8) | $ 25.92 | $ 53,920 |
| Providence-Warwick, RI-MA | 40 | 0.08 | 2.83 | $ 24.20 | $ 50,330 |
| Washington-Arlington-Alexandria, DC-VA-MD-WV | 30 | 0.01 | 0.39 | $ 21.77 | $ 45,280 |
| Boston-Cambridge-Nashua, MA-NH | 80 | 0.03 | 1.16 | $ 20.42 | $ 42,480 |
| Cincinnati, OH-KY-IN | 30 | 0.03 | 1.13 | $ 19.32 | $ 40,180 |
| Boise City, ID | 50 | 0.14 | 5.35 | $ 18.52 | $ 38,520 |
Nonmetropolitan areas with the highest employment in Craft Artists:
| Nonmetropolitan area | Employment (1) | Employment per thousand jobs | Location quotient (9) | Hourly mean wage | Annual mean wage (2) |
|---|---|---|---|---|---|
| Hill Country Region of Texas nonmetropolitan area | 50 | 0.28 | 10.74 | $ 16.45 | $ 34,210 |
| Northwest Lower Peninsula of Michigan nonmetropolitan area | 40 | 0.31 | 11.57 | $ 19.89 | $ 41,370 |
Nonmetropolitan areas with the highest concentration of jobs and location quotients in Craft Artists:
| Nonmetropolitan area | Employment (1) | Employment per thousand jobs | Location quotient (9) | Hourly mean wage | Annual mean wage (2) |
|---|---|---|---|---|---|
| Northwest Lower Peninsula of Michigan nonmetropolitan area | 40 | 0.31 | 11.57 | $ 19.89 | $ 41,370 |
| Hill Country Region of Texas nonmetropolitan area | 50 | 0.28 | 10.74 | $ 16.45 | $ 34,210 |
Top paying nonmetropolitan areas for Craft Artists:
| Nonmetropolitan area | Employment (1) | Employment per thousand jobs | Location quotient (9) | Hourly mean wage | Annual mean wage (2) |
|---|---|---|---|---|---|
| Northwest Lower Peninsula of Michigan nonmetropolitan area | 40 | 0.31 | 11.57 | $ 19.89 | $ 41,370 |
| Hill Country Region of Texas nonmetropolitan area | 50 | 0.28 | 10.74 | $ 16.45 | $ 34,210 |
These estimates are calculated with data collected from employers in all industry sectors, all metropolitan and nonmetropolitan areas, and all states and the District of Columbia. The top employment and wage figures are provided above. The complete list is available in the downloadable XLS files.
The percentile wage estimate is the value of a wage below which a certain percent of workers fall. The median wage is the 50th percentile wage estimate—50 percent of workers earn less than the median and 50 percent of workers earn more than the median. More about percentile wages.
(1) Estimates for detailed occupations do not sum to the totals because the totals include occupations not shown separately. Estimates do not include self-employed workers.
(2) Annual wages have been calculated by multiplying the hourly mean wage by a "year-round, full-time" hours figure of 2,080 hours; for those occupations where there is not an hourly wage published, the annual wage has been directly calculated from the reported survey data.
(3) The relative standard error (RSE) is a measure of the reliability of a survey statistic. The smaller the relative standard error, the more precise the estimate.
(7) The value is less than .005 percent of industry employment.
(8) Estimate not released.
(9) The location quotient is the ratio of the area concentration of occupational employment to the national average concentration. A location quotient greater than one indicates the occupation has a higher share of employment than average, and a location quotient less than one indicates the occupation is less prevalent in the area than average.
Other OEWS estimates and related information:
May 2021 National Occupational Employment and Wage Estimates
May 2021 State Occupational Employment and Wage Estimates
May 2021 Metropolitan and Nonmetropolitan Area Occupational Employment and Wage Estimates
May 2021 National Industry-Specific Occupational Employment and Wage Estimates
Last Modified Date: March 31, 2022