
An official website of the United States government
An official website of the United States government
The .gov means it's official.
Federal government websites often end in .gov or .mil. Before sharing sensitive information,
make sure you're on a federal government site.
The site is secure.
The
https:// ensures that you are connecting to the official website and that any
information you provide is encrypted and transmitted securely.
Design special exhibits and sets for film, video, television, and theater productions. May study scripts, confer with directors, and conduct research to determine appropriate architectural styles.
Employment estimate and mean wage estimates for Set and Exhibit Designers:
| Employment (1) | Employment RSE (3) |
Mean hourly wage |
Mean annual wage (2) |
Wage RSE (3) |
|---|---|---|---|---|
| 6,850 | 8.1 % | $ 30.27 | $ 62,960 | 2.7 % |
Percentile wage estimates for Set and Exhibit Designers:
| Percentile | 10% | 25% | 50% (Median) |
75% | 90% |
|---|---|---|---|---|---|
| Hourly Wage | $ 14.81 | $ 18.84 | $ 26.37 | $ 37.94 | $ 48.34 |
| Annual Wage (2) | $ 30,810 | $ 39,180 | $ 54,860 | $ 78,910 | $ 100,550 |
Industries with the highest published employment and wages for Set and Exhibit Designers are provided. For a list of all industries with employment in Set and Exhibit Designers, see the Create Customized Tables function.
Industries with the highest levels of employment in Set and Exhibit Designers:
| Industry | Employment (1) | Percent of industry employment | Hourly mean wage | Annual mean wage (2) |
|---|---|---|---|---|
| Motion Picture and Video Industries | 2,410 | 0.76 | $ 35.82 | $ 74,500 |
| Performing Arts Companies | 720 | 1.04 | $ 21.98 | $ 45,710 |
| Museums, Historical Sites, and Similar Institutions | 640 | 0.49 | $ 28.45 | $ 59,180 |
| Colleges, Universities, and Professional Schools | 340 | 0.01 | $ 24.11 | $ 50,150 |
| Specialized Design Services | 280 | 0.21 | $ 32.46 | $ 67,510 |
Industries with the highest concentration of employment in Set and Exhibit Designers:
| Industry | Employment (1) | Percent of industry employment | Hourly mean wage | Annual mean wage (2) |
|---|---|---|---|---|
| Performing Arts Companies | 720 | 1.04 | $ 21.98 | $ 45,710 |
| Motion Picture and Video Industries | 2,410 | 0.76 | $ 35.82 | $ 74,500 |
| Museums, Historical Sites, and Similar Institutions | 640 | 0.49 | $ 28.45 | $ 59,180 |
| Specialized Design Services | 280 | 0.21 | $ 32.46 | $ 67,510 |
| Promoters of Performing Arts, Sports, and Similar Events | 130 | 0.17 | $ 24.92 | $ 51,830 |
Top paying industries for Set and Exhibit Designers:
| Industry | Employment (1) | Percent of industry employment | Hourly mean wage | Annual mean wage (2) |
|---|---|---|---|---|
| Advertising, Public Relations, and Related Services | 50 | 0.01 | $ 41.39 | $ 86,100 |
| Federal Executive Branch (OEWS Designation) | 280 | 0.01 | $ 38.96 | $ 81,030 |
| Motion Picture and Video Industries | 2,410 | 0.76 | $ 35.82 | $ 74,500 |
| Management of Companies and Enterprises | 30 | (7) | $ 34.62 | $ 72,010 |
| Accounting, Tax Preparation, Bookkeeping, and Payroll Services | 110 | 0.01 | $ 33.41 | $ 69,490 |
States and areas with the highest published employment, location quotients, and wages for Set and Exhibit Designers are provided. For a list of all areas with employment in Set and Exhibit Designers, see the Create Customized Tables function.
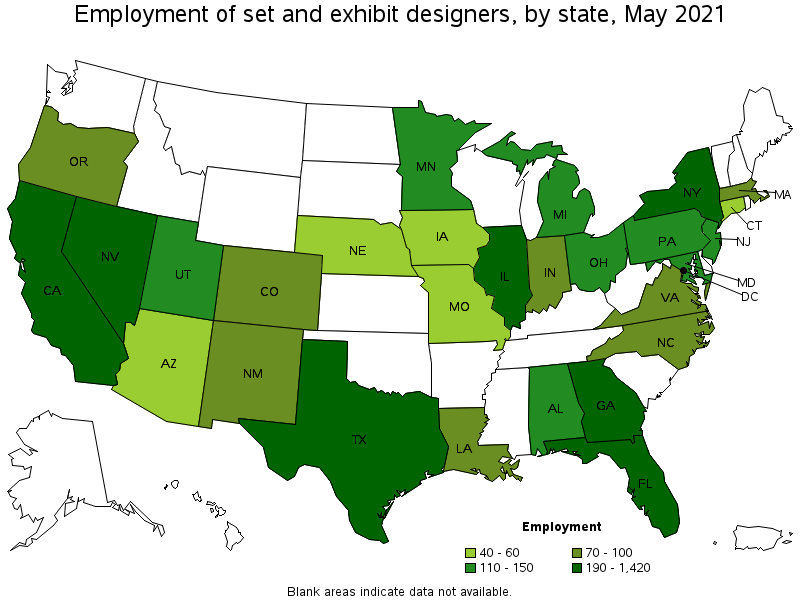
States with the highest employment level in Set and Exhibit Designers:
| State | Employment (1) | Employment per thousand jobs | Location quotient (9) | Hourly mean wage | Annual mean wage (2) |
|---|---|---|---|---|---|
| New York | 1,420 | 0.16 | 3.37 | $ 38.43 | $ 79,940 |
| California | 1,020 | 0.06 | 1.26 | $ 29.41 | $ 61,170 |
| Georgia | 670 | 0.15 | 3.14 | $ 33.21 | $ 69,080 |
| Texas | 510 | 0.04 | 0.85 | $ 19.83 | $ 41,250 |
| Nevada | 350 | 0.27 | 5.51 | $ 31.46 | $ 65,430 |
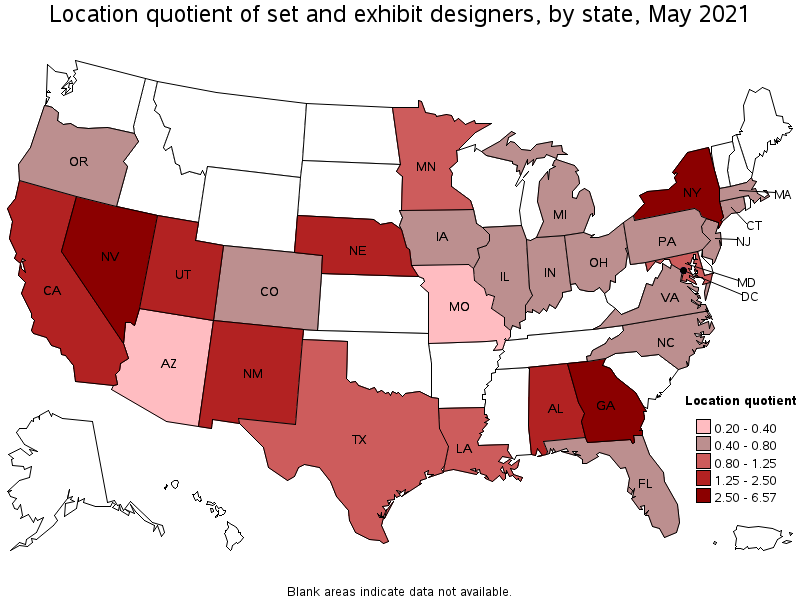
States with the highest concentration of jobs and location quotients in Set and Exhibit Designers:
| State | Employment (1) | Employment per thousand jobs | Location quotient (9) | Hourly mean wage | Annual mean wage (2) |
|---|---|---|---|---|---|
| District of Columbia | 210 | 0.32 | 6.57 | $ 33.19 | $ 69,030 |
| Nevada | 350 | 0.27 | 5.51 | $ 31.46 | $ 65,430 |
| New York | 1,420 | 0.16 | 3.37 | $ 38.43 | $ 79,940 |
| Georgia | 670 | 0.15 | 3.14 | $ 33.21 | $ 69,080 |
| Utah | 140 | 0.09 | 1.91 | (8) | (8) |
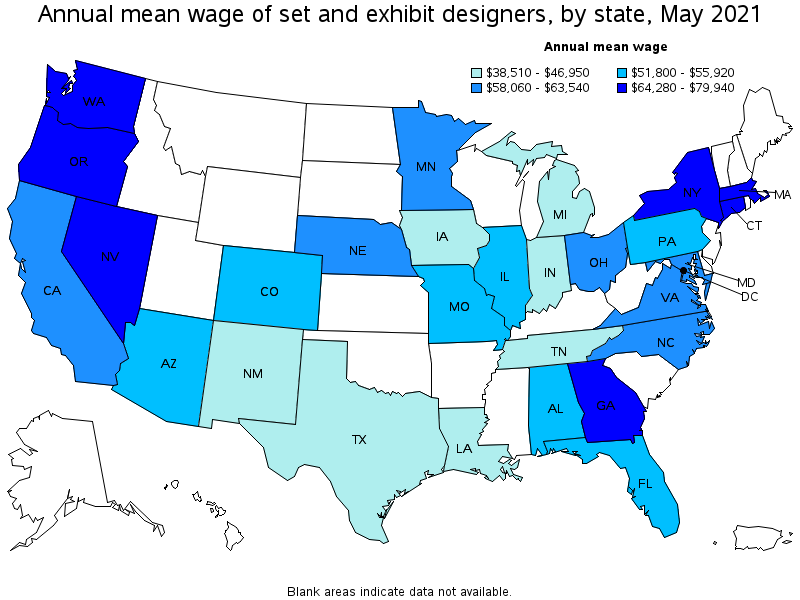
Top paying states for Set and Exhibit Designers:
| State | Employment (1) | Employment per thousand jobs | Location quotient (9) | Hourly mean wage | Annual mean wage (2) |
|---|---|---|---|---|---|
| New York | 1,420 | 0.16 | 3.37 | $ 38.43 | $ 79,940 |
| Oregon | 70 | 0.04 | 0.74 | $ 37.80 | $ 78,620 |
| Washington | (8) | (8) | (8) | $ 33.27 | $ 69,200 |
| Georgia | 670 | 0.15 | 3.14 | $ 33.21 | $ 69,080 |
| District of Columbia | 210 | 0.32 | 6.57 | $ 33.19 | $ 69,030 |
Metropolitan areas with the highest employment level in Set and Exhibit Designers:
| Metropolitan area | Employment (1) | Employment per thousand jobs | Location quotient (9) | Hourly mean wage | Annual mean wage (2) |
|---|---|---|---|---|---|
| New York-Newark-Jersey City, NY-NJ-PA | 1,400 | 0.16 | 3.33 | $ 39.11 | $ 81,350 |
| Los Angeles-Long Beach-Anaheim, CA | 570 | 0.10 | 2.07 | $ 28.09 | $ 58,440 |
| Atlanta-Sandy Springs-Roswell, GA | 500 | 0.19 | 3.97 | $ 34.92 | $ 72,630 |
| Las Vegas-Henderson-Paradise, NV | 330 | 0.36 | 7.38 | $ 31.21 | $ 64,910 |
| Washington-Arlington-Alexandria, DC-VA-MD-WV | 310 | 0.11 | 2.19 | $ 34.52 | $ 71,800 |
| Dallas-Fort Worth-Arlington, TX | 210 | 0.06 | 1.22 | $ 21.04 | $ 43,760 |
| Chicago-Naperville-Elgin, IL-IN-WI | 160 | 0.04 | 0.77 | $ 27.82 | $ 57,860 |
| San Francisco-Oakland-Hayward, CA | 160 | 0.07 | 1.43 | $ 31.05 | $ 64,590 |
| Minneapolis-St. Paul-Bloomington, MN-WI | 130 | 0.07 | 1.42 | $ 29.32 | $ 60,990 |
| Austin-Round Rock, TX | 80 | 0.08 | 1.58 | $ 18.56 | $ 38,610 |
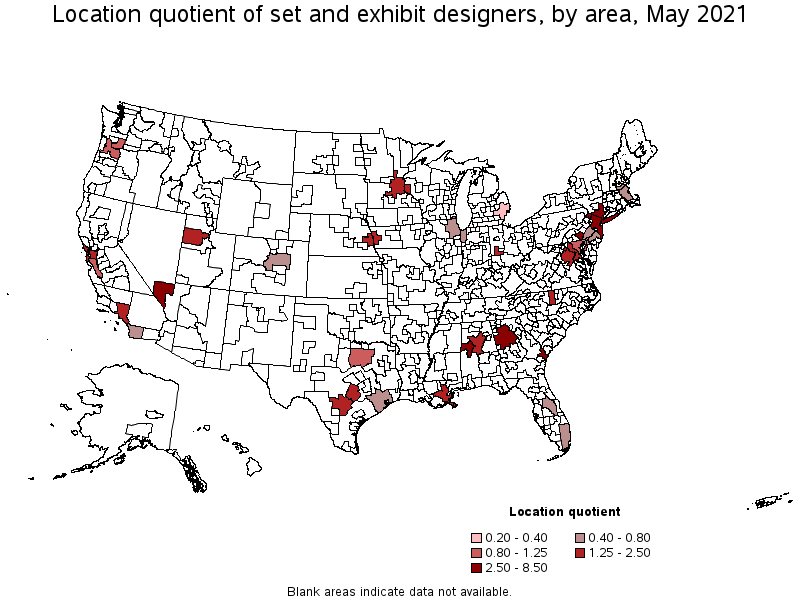
Metropolitan areas with the highest concentration of jobs and location quotients in Set and Exhibit Designers:
| Metropolitan area | Employment (1) | Employment per thousand jobs | Location quotient (9) | Hourly mean wage | Annual mean wage (2) |
|---|---|---|---|---|---|
| Tuscaloosa, AL | 40 | 0.41 | 8.50 | $ 26.07 | $ 54,220 |
| Las Vegas-Henderson-Paradise, NV | 330 | 0.36 | 7.38 | $ 31.21 | $ 64,910 |
| Savannah, GA | 30 | 0.19 | 3.99 | $ 27.57 | $ 57,340 |
| Atlanta-Sandy Springs-Roswell, GA | 500 | 0.19 | 3.97 | $ 34.92 | $ 72,630 |
| New York-Newark-Jersey City, NY-NJ-PA | 1,400 | 0.16 | 3.33 | $ 39.11 | $ 81,350 |
| Lancaster, PA | 40 | 0.16 | 3.30 | $ 22.81 | $ 47,450 |
| New Orleans-Metairie, LA | 50 | 0.11 | 2.20 | $ 22.14 | $ 46,050 |
| Washington-Arlington-Alexandria, DC-VA-MD-WV | 310 | 0.11 | 2.19 | $ 34.52 | $ 71,800 |
| Greensboro-High Point, NC | 40 | 0.11 | 2.16 | $ 27.27 | $ 56,710 |
| Los Angeles-Long Beach-Anaheim, CA | 570 | 0.10 | 2.07 | $ 28.09 | $ 58,440 |
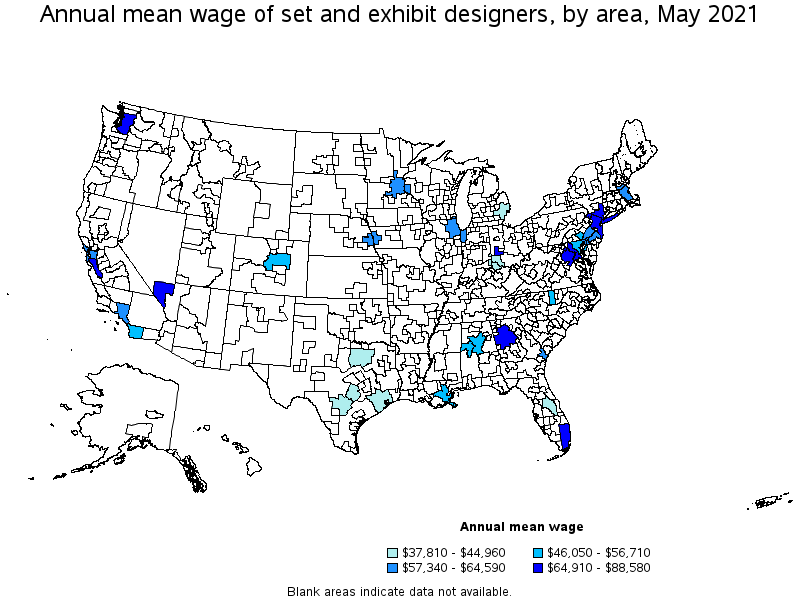
Top paying metropolitan areas for Set and Exhibit Designers:
| Metropolitan area | Employment (1) | Employment per thousand jobs | Location quotient (9) | Hourly mean wage | Annual mean wage (2) |
|---|---|---|---|---|---|
| San Jose-Sunnyvale-Santa Clara, CA | 50 | 0.05 | 0.98 | $ 42.59 | $ 88,580 |
| New York-Newark-Jersey City, NY-NJ-PA | 1,400 | 0.16 | 3.33 | $ 39.11 | $ 81,350 |
| Dayton, OH | 30 | 0.09 | 1.79 | $ 37.32 | $ 77,630 |
| Atlanta-Sandy Springs-Roswell, GA | 500 | 0.19 | 3.97 | $ 34.92 | $ 72,630 |
| Washington-Arlington-Alexandria, DC-VA-MD-WV | 310 | 0.11 | 2.19 | $ 34.52 | $ 71,800 |
| Seattle-Tacoma-Bellevue, WA | (8) | (8) | (8) | $ 33.26 | $ 69,170 |
| Miami-Fort Lauderdale-West Palm Beach, FL | 70 | 0.03 | 0.59 | $ 31.55 | $ 65,620 |
| Las Vegas-Henderson-Paradise, NV | 330 | 0.36 | 7.38 | $ 31.21 | $ 64,910 |
| San Francisco-Oakland-Hayward, CA | 160 | 0.07 | 1.43 | $ 31.05 | $ 64,590 |
| Minneapolis-St. Paul-Bloomington, MN-WI | 130 | 0.07 | 1.42 | $ 29.32 | $ 60,990 |
These estimates are calculated with data collected from employers in all industry sectors, all metropolitan and nonmetropolitan areas, and all states and the District of Columbia. The top employment and wage figures are provided above. The complete list is available in the downloadable XLS files.
The percentile wage estimate is the value of a wage below which a certain percent of workers fall. The median wage is the 50th percentile wage estimate—50 percent of workers earn less than the median and 50 percent of workers earn more than the median. More about percentile wages.
(1) Estimates for detailed occupations do not sum to the totals because the totals include occupations not shown separately. Estimates do not include self-employed workers.
(2) Annual wages have been calculated by multiplying the hourly mean wage by a "year-round, full-time" hours figure of 2,080 hours; for those occupations where there is not an hourly wage published, the annual wage has been directly calculated from the reported survey data.
(3) The relative standard error (RSE) is a measure of the reliability of a survey statistic. The smaller the relative standard error, the more precise the estimate.
(7) The value is less than .005 percent of industry employment.
(8) Estimate not released.
(9) The location quotient is the ratio of the area concentration of occupational employment to the national average concentration. A location quotient greater than one indicates the occupation has a higher share of employment than average, and a location quotient less than one indicates the occupation is less prevalent in the area than average.
Other OEWS estimates and related information:
May 2021 National Occupational Employment and Wage Estimates
May 2021 State Occupational Employment and Wage Estimates
May 2021 Metropolitan and Nonmetropolitan Area Occupational Employment and Wage Estimates
May 2021 National Industry-Specific Occupational Employment and Wage Estimates
Last Modified Date: March 31, 2022