
An official website of the United States government
An official website of the United States government
The .gov means it's official.
Federal government websites often end in .gov or .mil. Before sharing sensitive information,
make sure you're on a federal government site.
The site is secure.
The
https:// ensures that you are connecting to the official website and that any
information you provide is encrypted and transmitted securely.
Speak or read from scripted materials, such as news reports or commercial messages, on radio, television, or other communications media. May play and queue music, announce artist or title of performance, identify station, or interview guests. Excludes �News Analysts, Reporters, and Journalists� (27-3023).
Employment estimate and mean wage estimates for Broadcast Announcers and Radio Disc Jockeys:
| Employment (1) | Employment RSE (3) |
Mean hourly wage |
Mean annual wage (2) |
Wage RSE (3) |
|---|---|---|---|---|
| 24,580 | 3.8 % | $ 26.97 | $ 56,110 | 2.4 % |
Percentile wage estimates for Broadcast Announcers and Radio Disc Jockeys:
| Percentile | 10% | 25% | 50% (Median) |
75% | 90% |
|---|---|---|---|---|---|
| Hourly Wage | $ 10.99 | $ 13.97 | $ 18.09 | $ 28.89 | $ 49.56 |
| Annual Wage (2) | $ 22,860 | $ 29,050 | $ 37,630 | $ 60,090 | $ 103,090 |
Industries with the highest published employment and wages for Broadcast Announcers and Radio Disc Jockeys are provided. For a list of all industries with employment in Broadcast Announcers and Radio Disc Jockeys, see the Create Customized Tables function.
Industries with the highest levels of employment in Broadcast Announcers and Radio Disc Jockeys:
| Industry | Employment (1) | Percent of industry employment | Hourly mean wage | Annual mean wage (2) |
|---|---|---|---|---|
| Radio and Television Broadcasting | 20,540 | 10.78 | $ 25.55 | $ 53,140 |
| Spectator Sports | 570 | 0.50 | $ 46.95 | $ 97,660 |
| Colleges, Universities, and Professional Schools | 440 | 0.01 | $ 29.19 | $ 60,720 |
| Other Information Services | 330 | 0.09 | $ 43.70 | $ 90,890 |
| Advertising, Public Relations, and Related Services | 150 | 0.03 | $ 21.35 | $ 44,400 |
Industries with the highest concentration of employment in Broadcast Announcers and Radio Disc Jockeys:
| Industry | Employment (1) | Percent of industry employment | Hourly mean wage | Annual mean wage (2) |
|---|---|---|---|---|
| Radio and Television Broadcasting | 20,540 | 10.78 | $ 25.55 | $ 53,140 |
| Spectator Sports | 570 | 0.50 | $ 46.95 | $ 97,660 |
| Sound Recording Industries | 40 | 0.24 | $ 14.38 | $ 29,910 |
| Promoters of Performing Arts, Sports, and Similar Events | 90 | 0.12 | $ 81.96 | $ 170,490 |
| Other Information Services | 330 | 0.09 | $ 43.70 | $ 90,890 |
Top paying industries for Broadcast Announcers and Radio Disc Jockeys:
| Industry | Employment (1) | Percent of industry employment | Hourly mean wage | Annual mean wage (2) |
|---|---|---|---|---|
| Promoters of Performing Arts, Sports, and Similar Events | 90 | 0.12 | $ 81.96 | $ 170,490 |
| Motion Picture and Video Industries | 130 | 0.04 | $ 52.68 | $ 109,570 |
| Spectator Sports | 570 | 0.50 | $ 46.95 | $ 97,660 |
| Other Information Services | 330 | 0.09 | $ 43.70 | $ 90,890 |
| Independent Artists, Writers, and Performers | (8) | (8) | $ 34.35 | $ 71,440 |
States and areas with the highest published employment, location quotients, and wages for Broadcast Announcers and Radio Disc Jockeys are provided. For a list of all areas with employment in Broadcast Announcers and Radio Disc Jockeys, see the Create Customized Tables function.
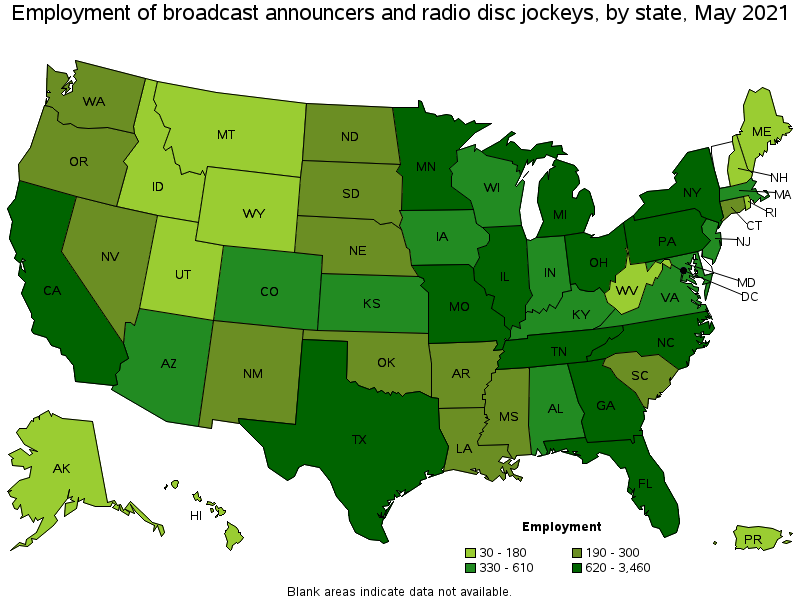
States with the highest employment level in Broadcast Announcers and Radio Disc Jockeys:
| State | Employment (1) | Employment per thousand jobs | Location quotient (9) | Hourly mean wage | Annual mean wage (2) |
|---|---|---|---|---|---|
| California | 3,460 | 0.21 | 1.20 | $ 30.01 | $ 62,410 |
| New York | 1,580 | 0.18 | 1.04 | $ 52.13 | $ 108,420 |
| Texas | 1,450 | 0.12 | 0.68 | $ 23.66 | $ 49,210 |
| Florida | 1,030 | 0.12 | 0.68 | $ 30.51 | $ 63,450 |
| Illinois | 950 | 0.17 | 0.97 | $ 25.25 | $ 52,520 |
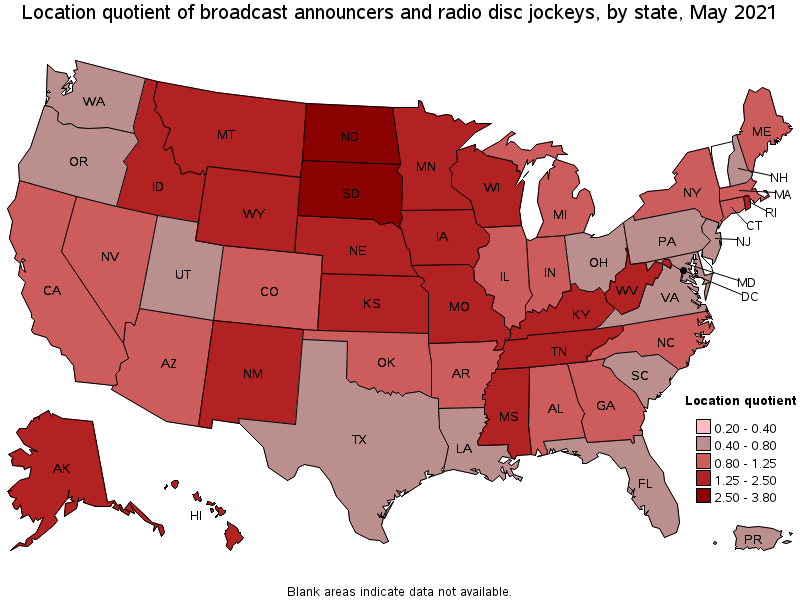
States with the highest concentration of jobs and location quotients in Broadcast Announcers and Radio Disc Jockeys:
| State | Employment (1) | Employment per thousand jobs | Location quotient (9) | Hourly mean wage | Annual mean wage (2) |
|---|---|---|---|---|---|
| South Dakota | 280 | 0.66 | 3.80 | $ 16.51 | $ 34,340 |
| North Dakota | 230 | 0.58 | 3.32 | $ 22.44 | $ 46,670 |
| District of Columbia | 360 | 0.55 | 3.16 | $ 49.26 | $ 102,460 |
| Kansas | 530 | 0.40 | 2.29 | $ 15.26 | $ 31,740 |
| Nebraska | 260 | 0.27 | 1.56 | $ 18.97 | $ 39,460 |
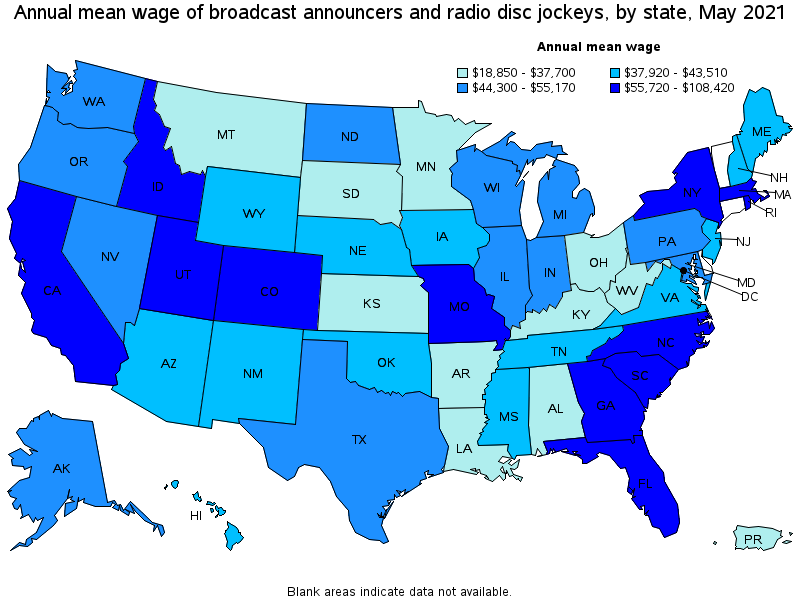
Top paying states for Broadcast Announcers and Radio Disc Jockeys:
| State | Employment (1) | Employment per thousand jobs | Location quotient (9) | Hourly mean wage | Annual mean wage (2) |
|---|---|---|---|---|---|
| New York | 1,580 | 0.18 | 1.04 | $ 52.13 | $ 108,420 |
| District of Columbia | 360 | 0.55 | 3.16 | $ 49.26 | $ 102,460 |
| Rhode Island | 100 | 0.22 | 1.25 | $ 46.38 | $ 96,470 |
| Utah | 180 | 0.12 | 0.67 | $ 38.20 | $ 79,450 |
| Colorado | 390 | 0.15 | 0.85 | $ 37.84 | $ 78,710 |
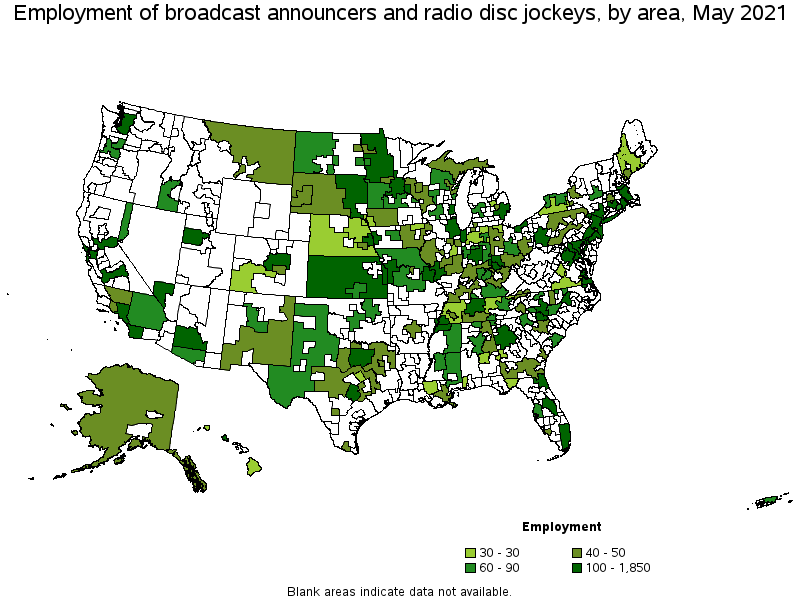
Metropolitan areas with the highest employment level in Broadcast Announcers and Radio Disc Jockeys:
| Metropolitan area | Employment (1) | Employment per thousand jobs | Location quotient (9) | Hourly mean wage | Annual mean wage (2) |
|---|---|---|---|---|---|
| Los Angeles-Long Beach-Anaheim, CA | 1,850 | 0.32 | 1.85 | $ 29.52 | $ 61,410 |
| New York-Newark-Jersey City, NY-NJ-PA | 1,380 | 0.16 | 0.91 | $ 55.98 | $ 116,440 |
| Chicago-Naperville-Elgin, IL-IN-WI | 630 | 0.15 | 0.85 | $ 29.51 | $ 61,380 |
| Washington-Arlington-Alexandria, DC-VA-MD-WV | 580 | 0.20 | 1.13 | $ 40.84 | $ 84,950 |
| Miami-Fort Lauderdale-West Palm Beach, FL | 410 | 0.17 | 0.95 | $ 38.11 | $ 79,270 |
| San Francisco-Oakland-Hayward, CA | 370 | 0.17 | 0.95 | $ 35.65 | $ 74,150 |
| Boston-Cambridge-Nashua, MA-NH | 360 | 0.14 | 0.79 | $ 40.20 | $ 83,610 |
| Dallas-Fort Worth-Arlington, TX | 350 | 0.10 | 0.56 | $ 25.98 | $ 54,030 |
| Nashville-Davidson--Murfreesboro--Franklin, TN | 340 | 0.35 | 2.00 | $ 23.87 | $ 49,650 |
| Atlanta-Sandy Springs-Roswell, GA | 320 | 0.12 | 0.71 | $ 34.15 | $ 71,030 |
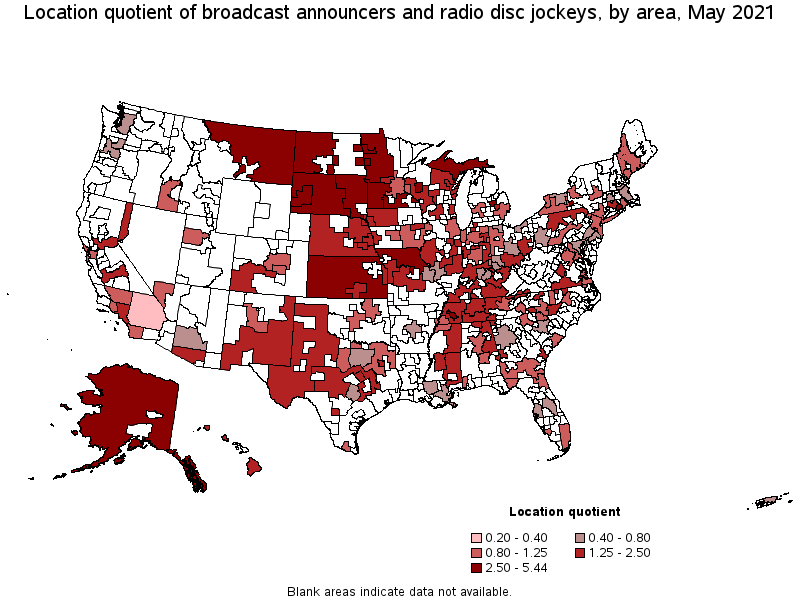
Metropolitan areas with the highest concentration of jobs and location quotients in Broadcast Announcers and Radio Disc Jockeys:
| Metropolitan area | Employment (1) | Employment per thousand jobs | Location quotient (9) | Hourly mean wage | Annual mean wage (2) |
|---|---|---|---|---|---|
| Rapid City, SD | 50 | 0.78 | 4.45 | $ 16.61 | $ 34,550 |
| Grand Forks, ND-MN | 40 | 0.76 | 4.38 | $ 21.43 | $ 44,570 |
| Ithaca, NY | 40 | 0.76 | 4.36 | (8) | (8) |
| Jackson, TN | 40 | 0.58 | 3.32 | $ 14.57 | $ 30,300 |
| Norwich-New London-Westerly, CT-RI | 60 | 0.55 | 3.13 | (8) | (8) |
| Columbia, MO | 50 | 0.53 | 3.03 | $ 20.80 | $ 43,260 |
| Fargo, ND-MN | 70 | 0.52 | 2.97 | $ 24.79 | $ 51,570 |
| Saginaw, MI | 30 | 0.44 | 2.51 | $ 17.46 | $ 36,310 |
| Eau Claire, WI | 40 | 0.44 | 2.51 | $ 17.99 | $ 37,410 |
| Kingsport-Bristol-Bristol, TN-VA | 40 | 0.39 | 2.23 | $ 15.71 | $ 32,670 |
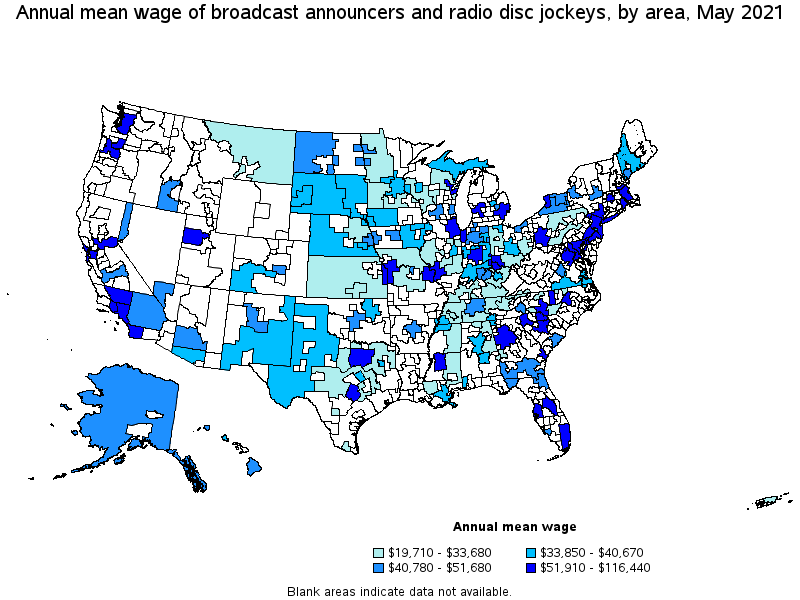
Top paying metropolitan areas for Broadcast Announcers and Radio Disc Jockeys:
| Metropolitan area | Employment (1) | Employment per thousand jobs | Location quotient (9) | Hourly mean wage | Annual mean wage (2) |
|---|---|---|---|---|---|
| New York-Newark-Jersey City, NY-NJ-PA | 1,380 | 0.16 | 0.91 | $ 55.98 | $ 116,440 |
| Providence-Warwick, RI-MA | 100 | 0.18 | 1.04 | $ 47.10 | $ 97,960 |
| Salt Lake City, UT | 120 | 0.16 | 0.94 | $ 43.45 | $ 90,370 |
| Washington-Arlington-Alexandria, DC-VA-MD-WV | 580 | 0.20 | 1.13 | $ 40.84 | $ 84,950 |
| Boston-Cambridge-Nashua, MA-NH | 360 | 0.14 | 0.79 | $ 40.20 | $ 83,610 |
| Miami-Fort Lauderdale-West Palm Beach, FL | 410 | 0.17 | 0.95 | $ 38.11 | $ 79,270 |
| St. Louis, MO-IL | 180 | 0.14 | 0.79 | $ 37.75 | $ 78,510 |
| Sacramento--Roseville--Arden-Arcade, CA | 240 | 0.24 | 1.38 | $ 36.91 | $ 76,770 |
| Charlotte-Concord-Gastonia, NC-SC | 250 | 0.21 | 1.18 | $ 36.03 | $ 74,940 |
| San Francisco-Oakland-Hayward, CA | 370 | 0.17 | 0.95 | $ 35.65 | $ 74,150 |
Nonmetropolitan areas with the highest employment in Broadcast Announcers and Radio Disc Jockeys:
| Nonmetropolitan area | Employment (1) | Employment per thousand jobs | Location quotient (9) | Hourly mean wage | Annual mean wage (2) |
|---|---|---|---|---|---|
| Kansas nonmetropolitan area | 210 | 0.55 | 3.17 | $ 14.22 | $ 29,570 |
| East South Dakota nonmetropolitan area | 120 | 0.95 | 5.44 | $ 16.30 | $ 33,890 |
| Northwest Minnesota nonmetropolitan area | 110 | 0.61 | 3.47 | $ 15.33 | $ 31,880 |
| Southeast Minnesota nonmetropolitan area | 90 | 0.58 | 3.33 | $ 15.35 | $ 31,920 |
| Piedmont North Carolina nonmetropolitan area | 70 | 0.30 | 1.73 | $ 13.41 | $ 27,890 |
Nonmetropolitan areas with the highest concentration of jobs and location quotients in Broadcast Announcers and Radio Disc Jockeys:
| Nonmetropolitan area | Employment (1) | Employment per thousand jobs | Location quotient (9) | Hourly mean wage | Annual mean wage (2) |
|---|---|---|---|---|---|
| East South Dakota nonmetropolitan area | 120 | 0.95 | 5.44 | $ 16.30 | $ 33,890 |
| West South Dakota nonmetropolitan area | 40 | 0.72 | 4.11 | $ 16.30 | $ 33,910 |
| East-Central Montana nonmetropolitan area | 40 | 0.64 | 3.67 | $ 15.29 | $ 31,800 |
| North Missouri nonmetropolitan area | 60 | 0.62 | 3.57 | $ 12.26 | $ 25,510 |
| Northwest Minnesota nonmetropolitan area | 110 | 0.61 | 3.47 | $ 15.33 | $ 31,880 |
Top paying nonmetropolitan areas for Broadcast Announcers and Radio Disc Jockeys:
| Nonmetropolitan area | Employment (1) | Employment per thousand jobs | Location quotient (9) | Hourly mean wage | Annual mean wage (2) |
|---|---|---|---|---|---|
| Alaska nonmetropolitan area | 50 | 0.52 | 2.99 | $ 22.90 | $ 47,630 |
| South Georgia nonmetropolitan area | 40 | 0.21 | 1.22 | $ 21.32 | $ 44,340 |
| Northern Indiana nonmetropolitan area | 30 | 0.17 | 0.95 | $ 20.90 | $ 43,470 |
| West North Dakota nonmetropolitan area | 60 | 0.58 | 3.32 | $ 20.87 | $ 43,420 |
| Hawaii / Kauai nonmetropolitan area | 30 | 0.37 | 2.10 | $ 20.18 | $ 41,970 |
These estimates are calculated with data collected from employers in all industry sectors, all metropolitan and nonmetropolitan areas, and all states and the District of Columbia. The top employment and wage figures are provided above. The complete list is available in the downloadable XLS files.
The percentile wage estimate is the value of a wage below which a certain percent of workers fall. The median wage is the 50th percentile wage estimate—50 percent of workers earn less than the median and 50 percent of workers earn more than the median. More about percentile wages.
(1) Estimates for detailed occupations do not sum to the totals because the totals include occupations not shown separately. Estimates do not include self-employed workers.
(2) Annual wages have been calculated by multiplying the hourly mean wage by a "year-round, full-time" hours figure of 2,080 hours; for those occupations where there is not an hourly wage published, the annual wage has been directly calculated from the reported survey data.
(3) The relative standard error (RSE) is a measure of the reliability of a survey statistic. The smaller the relative standard error, the more precise the estimate.
(8) Estimate not released.
(9) The location quotient is the ratio of the area concentration of occupational employment to the national average concentration. A location quotient greater than one indicates the occupation has a higher share of employment than average, and a location quotient less than one indicates the occupation is less prevalent in the area than average.
Other OEWS estimates and related information:
May 2021 National Occupational Employment and Wage Estimates
May 2021 State Occupational Employment and Wage Estimates
May 2021 Metropolitan and Nonmetropolitan Area Occupational Employment and Wage Estimates
May 2021 National Industry-Specific Occupational Employment and Wage Estimates
Last Modified Date: March 31, 2022