
An official website of the United States government
An official website of the United States government
The .gov means it's official.
Federal government websites often end in .gov or .mil. Before sharing sensitive information,
make sure you're on a federal government site.
The site is secure.
The
https:// ensures that you are connecting to the official website and that any
information you provide is encrypted and transmitted securely.
Promote or create an intended public image for individuals, groups, or organizations. May write or select material for release to various communications media. May specialize in using social media.
Employment estimate and mean wage estimates for Public Relations Specialists:
| Employment (1) | Employment RSE (3) |
Mean hourly wage |
Mean annual wage (2) |
Wage RSE (3) |
|---|---|---|---|---|
| 242,710 | 0.9 % | $ 35.22 | $ 73,250 | 0.9 % |
Percentile wage estimates for Public Relations Specialists:
| Percentile | 10% | 25% | 50% (Median) |
75% | 90% |
|---|---|---|---|---|---|
| Hourly Wage | $ 17.80 | $ 23.40 | $ 30.19 | $ 39.40 | $ 59.91 |
| Annual Wage (2) | $ 37,020 | $ 48,670 | $ 62,800 | $ 81,960 | $ 124,620 |
Industries with the highest published employment and wages for Public Relations Specialists are provided. For a list of all industries with employment in Public Relations Specialists, see the Create Customized Tables function.
Industries with the highest levels of employment in Public Relations Specialists:
| Industry | Employment (1) | Percent of industry employment | Hourly mean wage | Annual mean wage (2) |
|---|---|---|---|---|
| Advertising, Public Relations, and Related Services | 34,190 | 7.86 | $ 41.27 | $ 85,840 |
| Colleges, Universities, and Professional Schools | 19,220 | 0.64 | $ 31.75 | $ 66,050 |
| Business, Professional, Labor, Political, and Similar Organizations | 17,290 | 4.22 | $ 37.27 | $ 77,520 |
| Local Government, excluding schools and hospitals (OEWS Designation) | 13,570 | 0.25 | $ 32.46 | $ 67,510 |
| Management of Companies and Enterprises | 12,260 | 0.48 | $ 40.75 | $ 84,760 |
Industries with the highest concentration of employment in Public Relations Specialists:
| Industry | Employment (1) | Percent of industry employment | Hourly mean wage | Annual mean wage (2) |
|---|---|---|---|---|
| Advertising, Public Relations, and Related Services | 34,190 | 7.86 | $ 41.27 | $ 85,840 |
| Social Advocacy Organizations | 10,300 | 4.60 | $ 31.98 | $ 66,520 |
| Business, Professional, Labor, Political, and Similar Organizations | 17,290 | 4.22 | $ 37.27 | $ 77,520 |
| Grantmaking and Giving Services | 5,880 | 4.21 | $ 38.46 | $ 79,990 |
| Radio and Television Broadcasting | 2,760 | 1.45 | $ 27.40 | $ 56,990 |
Top paying industries for Public Relations Specialists:
| Industry | Employment (1) | Percent of industry employment | Hourly mean wage | Annual mean wage (2) |
|---|---|---|---|---|
| Merchant Wholesalers, Nondurable Goods (4242 and 4246 only) | 610 | 0.16 | $ 60.23 | $ 125,280 |
| Computer and Peripheral Equipment Manufacturing | 360 | 0.23 | $ 58.55 | $ 121,790 |
| Independent Artists, Writers, and Performers | (8) | (8) | $ 58.21 | $ 121,090 |
| Petroleum and Coal Products Manufacturing | 70 | 0.06 | $ 52.30 | $ 108,790 |
| Monetary Authorities-Central Bank | 90 | 0.44 | $ 51.64 | $ 107,400 |
States and areas with the highest published employment, location quotients, and wages for Public Relations Specialists are provided. For a list of all areas with employment in Public Relations Specialists, see the Create Customized Tables function.
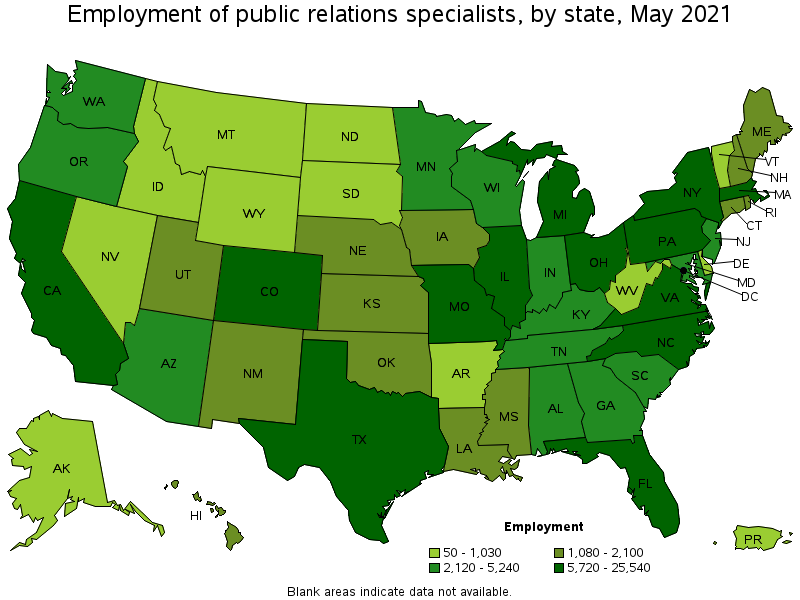
States with the highest employment level in Public Relations Specialists:
| State | Employment (1) | Employment per thousand jobs | Location quotient (9) | Hourly mean wage | Annual mean wage (2) |
|---|---|---|---|---|---|
| New York | 25,540 | 2.95 | 1.71 | $ 40.13 | $ 83,460 |
| California | 25,050 | 1.52 | 0.88 | $ 39.35 | $ 81,840 |
| Texas | 21,720 | 1.78 | 1.03 | $ 30.55 | $ 63,540 |
| District of Columbia | 17,750 | 26.82 | 15.57 | $ 50.98 | $ 106,040 |
| Florida | 17,380 | 2.02 | 1.17 | $ 30.57 | $ 63,590 |
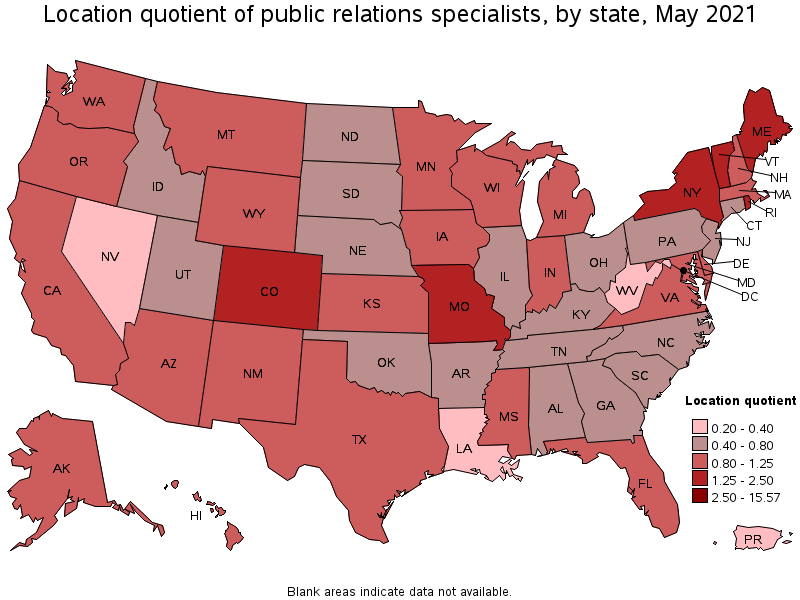
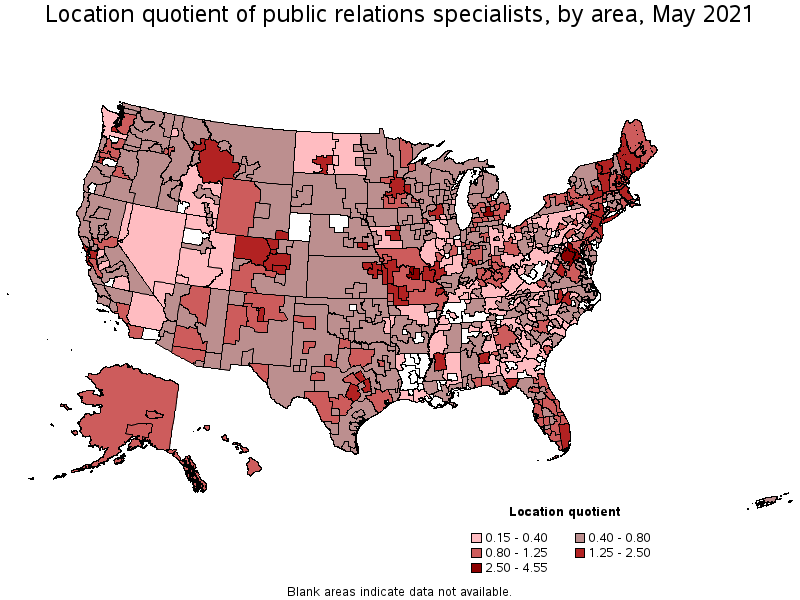
States with the highest concentration of jobs and location quotients in Public Relations Specialists:
| State | Employment (1) | Employment per thousand jobs | Location quotient (9) | Hourly mean wage | Annual mean wage (2) |
|---|---|---|---|---|---|
| District of Columbia | 17,750 | 26.82 | 15.57 | $ 50.98 | $ 106,040 |
| New York | 25,540 | 2.95 | 1.71 | $ 40.13 | $ 83,460 |
| Maine | 1,720 | 2.91 | 1.69 | $ 25.20 | $ 52,420 |
| Missouri | 7,510 | 2.75 | 1.60 | $ 29.34 | $ 61,020 |
| Vermont | 770 | 2.72 | 1.58 | $ 27.05 | $ 56,250 |
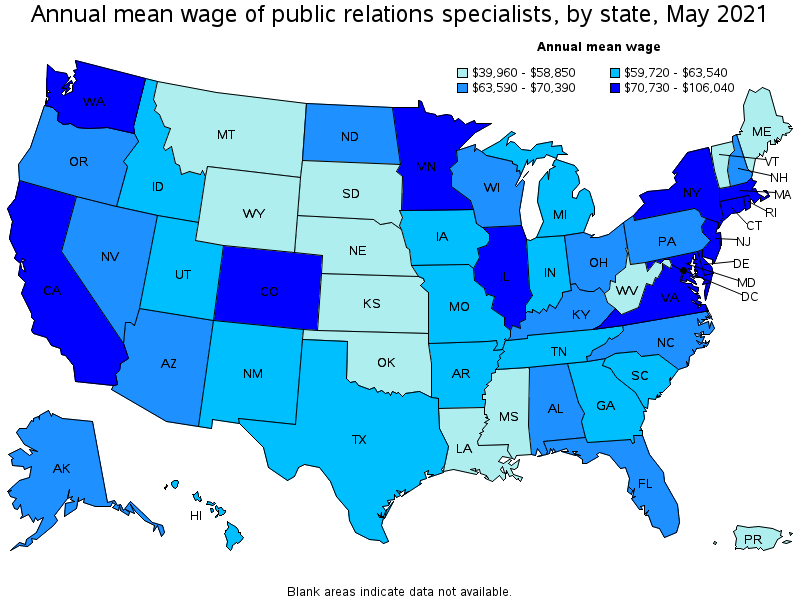
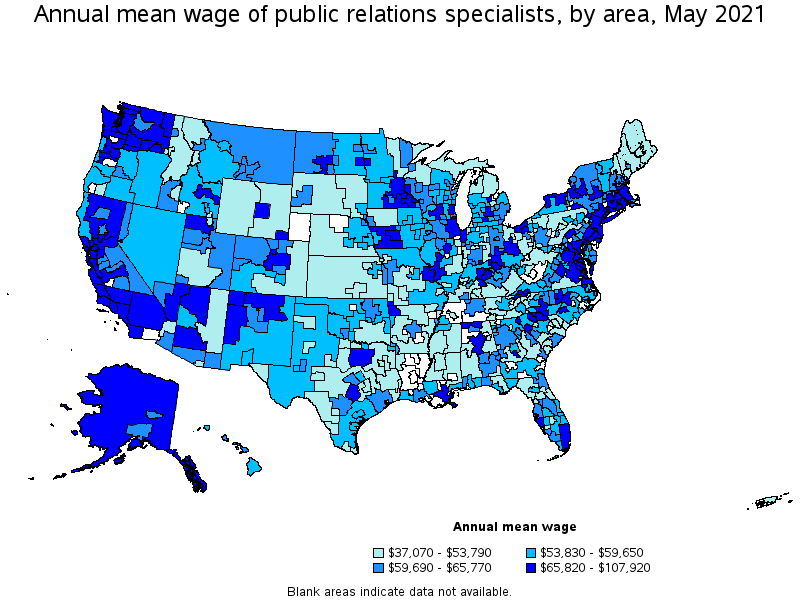
Top paying states for Public Relations Specialists:
| State | Employment (1) | Employment per thousand jobs | Location quotient (9) | Hourly mean wage | Annual mean wage (2) |
|---|---|---|---|---|---|
| District of Columbia | 17,750 | 26.82 | 15.57 | $ 50.98 | $ 106,040 |
| Washington | 5,240 | 1.63 | 0.95 | $ 41.01 | $ 85,300 |
| New York | 25,540 | 2.95 | 1.71 | $ 40.13 | $ 83,460 |
| Virginia | 7,690 | 2.05 | 1.19 | $ 39.46 | $ 82,080 |
| California | 25,050 | 1.52 | 0.88 | $ 39.35 | $ 81,840 |
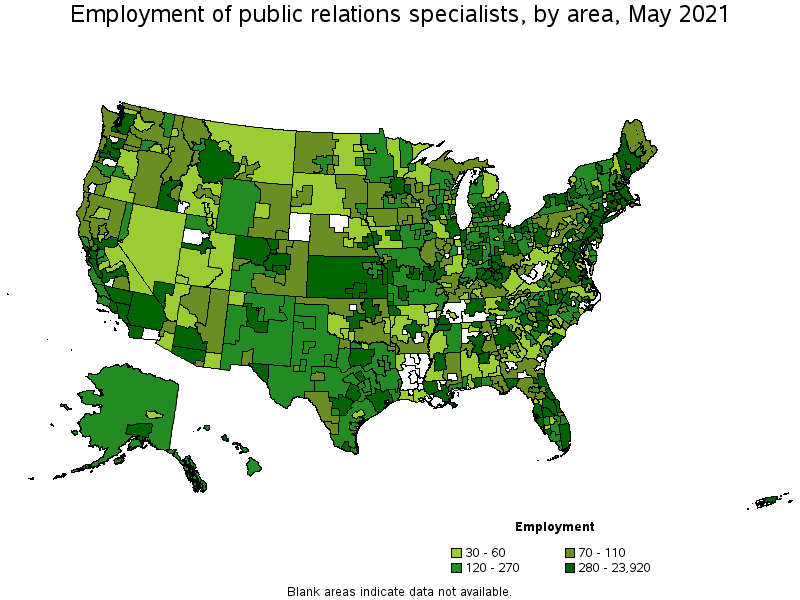
Metropolitan areas with the highest employment level in Public Relations Specialists:
| Metropolitan area | Employment (1) | Employment per thousand jobs | Location quotient (9) | Hourly mean wage | Annual mean wage (2) |
|---|---|---|---|---|---|
| New York-Newark-Jersey City, NY-NJ-PA | 23,920 | 2.76 | 1.60 | $ 41.24 | $ 85,770 |
| Washington-Arlington-Alexandria, DC-VA-MD-WV | 23,010 | 7.84 | 4.55 | $ 49.39 | $ 102,720 |
| Los Angeles-Long Beach-Anaheim, CA | 9,270 | 1.62 | 0.94 | $ 37.39 | $ 77,770 |
| Dallas-Fort Worth-Arlington, TX | 6,610 | 1.84 | 1.07 | $ 32.47 | $ 67,530 |
| Miami-Fort Lauderdale-West Palm Beach, FL | 6,610 | 2.69 | 1.56 | $ 32.22 | $ 67,010 |
| Boston-Cambridge-Nashua, MA-NH | 5,920 | 2.29 | 1.33 | $ 39.30 | $ 81,740 |
| San Francisco-Oakland-Hayward, CA | 4,990 | 2.22 | 1.29 | $ 42.35 | $ 88,090 |
| Chicago-Naperville-Elgin, IL-IN-WI | 4,600 | 1.09 | 0.63 | $ 35.31 | $ 73,440 |
| Houston-The Woodlands-Sugar Land, TX | 4,480 | 1.55 | 0.90 | $ 30.52 | $ 63,470 |
| Minneapolis-St. Paul-Bloomington, MN-WI | 3,940 | 2.16 | 1.25 | $ 36.35 | $ 75,610 |
Metropolitan areas with the highest concentration of jobs and location quotients in Public Relations Specialists:
| Metropolitan area | Employment (1) | Employment per thousand jobs | Location quotient (9) | Hourly mean wage | Annual mean wage (2) |
|---|---|---|---|---|---|
| Washington-Arlington-Alexandria, DC-VA-MD-WV | 23,010 | 7.84 | 4.55 | $ 49.39 | $ 102,720 |
| Ithaca, NY | 280 | 6.11 | 3.55 | (8) | (8) |
| Jefferson City, MO | 360 | 4.98 | 2.89 | $ 27.42 | $ 57,030 |
| Columbia, MO | 440 | 4.78 | 2.78 | $ 25.43 | $ 52,890 |
| Lansing-East Lansing, MI | 890 | 4.51 | 2.62 | $ 35.12 | $ 73,050 |
| Ames, IA | 180 | 4.04 | 2.34 | $ 30.49 | $ 63,420 |
| Olympia-Tumwater, WA | 440 | 3.91 | 2.27 | $ 36.20 | $ 75,290 |
| Portland-South Portland, ME | 750 | 3.79 | 2.20 | $ 24.78 | $ 51,540 |
| Madison, WI | 1,430 | 3.78 | 2.19 | $ 31.79 | $ 66,120 |
| Manhattan, KS | 130 | 3.57 | 2.07 | $ 24.79 | $ 51,570 |
Top paying metropolitan areas for Public Relations Specialists:
| Metropolitan area | Employment (1) | Employment per thousand jobs | Location quotient (9) | Hourly mean wage | Annual mean wage (2) |
|---|---|---|---|---|---|
| San Jose-Sunnyvale-Santa Clara, CA | 1,730 | 1.61 | 0.94 | $ 51.89 | $ 107,920 |
| Washington-Arlington-Alexandria, DC-VA-MD-WV | 23,010 | 7.84 | 4.55 | $ 49.39 | $ 102,720 |
| Midland, MI | 70 | 2.09 | 1.21 | $ 43.67 | $ 90,820 |
| Seattle-Tacoma-Bellevue, WA | 3,630 | 1.89 | 1.10 | $ 43.42 | $ 90,310 |
| Kennewick-Richland, WA | 160 | 1.36 | 0.79 | $ 43.31 | $ 90,080 |
| Fayetteville-Springdale-Rogers, AR-MO | 310 | 1.26 | 0.73 | $ 42.76 | $ 88,940 |
| Sacramento--Roseville--Arden-Arcade, CA | 2,000 | 2.04 | 1.18 | $ 42.73 | $ 88,880 |
| San Francisco-Oakland-Hayward, CA | 4,990 | 2.22 | 1.29 | $ 42.35 | $ 88,090 |
| Bloomington, IL | 110 | 1.35 | 0.79 | $ 41.26 | $ 85,820 |
| New York-Newark-Jersey City, NY-NJ-PA | 23,920 | 2.76 | 1.60 | $ 41.24 | $ 85,770 |
Nonmetropolitan areas with the highest employment in Public Relations Specialists:
| Nonmetropolitan area | Employment (1) | Employment per thousand jobs | Location quotient (9) | Hourly mean wage | Annual mean wage (2) |
|---|---|---|---|---|---|
| Southwest Maine nonmetropolitan area | 530 | 2.90 | 1.68 | $ 25.75 | $ 53,550 |
| Kansas nonmetropolitan area | 360 | 0.96 | 0.56 | $ 23.61 | $ 49,110 |
| Southwest Montana nonmetropolitan area | 330 | 2.36 | 1.37 | $ 27.13 | $ 56,430 |
| Northwest Colorado nonmetropolitan area | 300 | 2.56 | 1.49 | $ 30.27 | $ 62,960 |
| Central Kentucky nonmetropolitan area | 280 | 1.62 | 0.94 | $ 29.82 | $ 62,020 |
Nonmetropolitan areas with the highest concentration of jobs and location quotients in Public Relations Specialists:
| Nonmetropolitan area | Employment (1) | Employment per thousand jobs | Location quotient (9) | Hourly mean wage | Annual mean wage (2) |
|---|---|---|---|---|---|
| Northern Vermont nonmetropolitan area | 220 | 3.31 | 1.92 | $ 26.33 | $ 54,770 |
| Southwest Maine nonmetropolitan area | 530 | 2.90 | 1.68 | $ 25.75 | $ 53,550 |
| Northwest Colorado nonmetropolitan area | 300 | 2.56 | 1.49 | $ 30.27 | $ 62,960 |
| Southwest Montana nonmetropolitan area | 330 | 2.36 | 1.37 | $ 27.13 | $ 56,430 |
| Central New Hampshire nonmetropolitan area | 210 | 2.31 | 1.34 | $ 31.62 | $ 65,770 |
Top paying nonmetropolitan areas for Public Relations Specialists:
| Nonmetropolitan area | Employment (1) | Employment per thousand jobs | Location quotient (9) | Hourly mean wage | Annual mean wage (2) |
|---|---|---|---|---|---|
| Western Washington nonmetropolitan area | 70 | 0.58 | 0.33 | $ 35.12 | $ 73,060 |
| Southwest Iowa nonmetropolitan area | 50 | 0.60 | 0.35 | $ 34.58 | $ 71,930 |
| Northern New Mexico nonmetropolitan area | 120 | 1.56 | 0.91 | $ 34.32 | $ 71,390 |
| Northeast Virginia nonmetropolitan area | 40 | 0.83 | 0.48 | $ 34.15 | $ 71,030 |
| North Valley-Northern Mountains Region of California nonmetropolitan area | 80 | 0.85 | 0.49 | $ 33.75 | $ 70,210 |
These estimates are calculated with data collected from employers in all industry sectors, all metropolitan and nonmetropolitan areas, and all states and the District of Columbia. The top employment and wage figures are provided above. The complete list is available in the downloadable XLS files.
The percentile wage estimate is the value of a wage below which a certain percent of workers fall. The median wage is the 50th percentile wage estimate—50 percent of workers earn less than the median and 50 percent of workers earn more than the median. More about percentile wages.
(1) Estimates for detailed occupations do not sum to the totals because the totals include occupations not shown separately. Estimates do not include self-employed workers.
(2) Annual wages have been calculated by multiplying the hourly mean wage by a "year-round, full-time" hours figure of 2,080 hours; for those occupations where there is not an hourly wage published, the annual wage has been directly calculated from the reported survey data.
(3) The relative standard error (RSE) is a measure of the reliability of a survey statistic. The smaller the relative standard error, the more precise the estimate.
(8) Estimate not released.
(9) The location quotient is the ratio of the area concentration of occupational employment to the national average concentration. A location quotient greater than one indicates the occupation has a higher share of employment than average, and a location quotient less than one indicates the occupation is less prevalent in the area than average.
Other OEWS estimates and related information:
May 2021 National Occupational Employment and Wage Estimates
May 2021 State Occupational Employment and Wage Estimates
May 2021 Metropolitan and Nonmetropolitan Area Occupational Employment and Wage Estimates
May 2021 National Industry-Specific Occupational Employment and Wage Estimates
Last Modified Date: March 31, 2022